Parametric Optimization of EDM of EN-40 for
MRR, TWR and White Layer Thickness
Saleem Khan1, Yaqoob Ali Ansari2, Syed Asghar Husain Rizvi3
1, 2, 3
Mechanical Engineering Department, Integral University
Abstract: The present investigation is conducted on EDM is performed on EN-40 with copper as electrode to establish the relationship between process parameters of EDM on material removal rate, tool wear rate and white layer thickness. The investigation concluded that material removal rate, tool wear rate and white layer thickness were majorly influenced by the peak current and pulse on time. Pulse off time was found to be the least dominating parameter for all the performance measures. Keywords: EDM, SEM, WLT, MRR, TWR
I. INTRODUCTION
Electrical Discharge Machining (EDM) is a controlled material removal technique used to remove metal by means of spark erosion. This process utilizes an electric spark as the cutting tool to machine the workpiece to produce the finished product to the desired size and shape. The material removal process is performed in dielectric medium to enhance the efficiency of the process and applies a pulsating (ON/OFF) electrical charge of high-frequency current by the electrode on to the workpiece. This removes a very tiny layer of metal from the workpiece at a controlled rate. EDM spark erosion is similar to have an electrical short which burns a hole in a piece of material it is in contacts. In the EDM process, both the work material and the electrode material must be electrically conductive.
Deepu P.Nair et al [1] conducted an experimental investigation for surface characteristics of M300 Steel and concluded that the parameter current was the most effective for surface roughness followed by the voltage and pulse on time. In another investigation carried by George et al [2] to optimize the machining parameters, according to their relative significance, gap voltage, peak current were the main influencing parameters for the performance measures. S. Ben Salem et al [3] conducted experiments and found that a fewer number of experiments is required to optimize the surface roughness and it was found that the current intensity is the major dominating parameter for surface roughness.
In another investigation carried out by V. Chandrasekaran et al [4] through their investigation revealed that the MRR is highest for all compositions. As the percentage of nickel increases the thermal conductivity of the composition increases since the nickel material is easily removed from the surface of the parent material. Hence the MRR increases with increase in the percentage of nickel. It is also found that the surface roughness increases with current and flushing pressure and doesn’t depend on percentage of Ni. The optimum Ra values decreased with increasing electrode rotation. Francesco Modica et al [5] investigation throw light on relation between the material removal technique, identified during the evaluation of MRR and TWR. The selected parameters were voltage, discharge current, pulse width and frequency, so as to experimentally quantify the waste of material produced and optimize the technological process in order to decrease it. Kumar Sandeep [6] investigated surface quality and metal removal rate which are the utmost important factors for selecting the optimum condition of processes and also the economical aspects. The research reported the trend of research in EDM.
Lau et al [7] established the feasibility of using Electrical Discharge Machining for machining carbon fiber composite materials. Parameters selected were currents, pulse durations, tool materials and polarities and it concluded that it is totally feasible for EDM to machine carbon fiber composite. Copper is found to be better than graphite electrodes for tool wear and surface finish. They suggested that positive polarity must be opted for machining carbon fiber composite materials so as to achieve low tool wear ratio. An experimental investigation carried by Amoljit S Gill et al [8] on EN31with Cu-Cr-Ni Powder Metallurgy Tool found that current is the most contributing parameter towards surface roughness. Navdeep Malhotra et al [9] conducted experiments on EN-31 and found that surface roughness of EN-31 Die Steel was majorly influenced by the current and pulse on time. Lower the value of current better the surface finish and same effect in case of pulse on time.
thickness and also the induced stress which promote crack formation. Rajesha S et al [11] studied surface roughness on AL-7075 metal matrix composite and concluded that the Surface Roughness initially increases rapidly with an increase in pulse off-time and decreases at a slower pace with increase in level of pulse off time.
Pravin R. Kubade et al [12] studied the dominance of EDM parameters on tool wear rate, material removal rate and radial overcut of AISI D3 using a copper electrode. The results revealed that MRR is mainly dominated by peak current while other factors were less effective. Tool wear rate is majorly influenced by both peak current and pulse on time, while duty cycle and gap voltage were very less effective on it. Peak current also has the major influence on radial overcut followed by duty cycle and pulse on time while almost very less influence was observed by gap voltage.
II. EXPERIMENTANDMETHODOLOGY
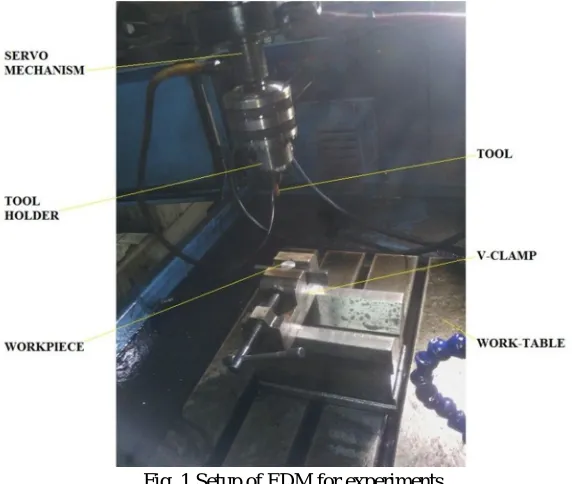
[image:2.612.165.451.258.500.2]ELECTRONICA ZNC EDM machine was used for machining the samples. The machine setup is shown in figure 1. The material used for this work is EN 40. The samples for experiment were 8 mm thick and 16 mm in diameter which were prepared by a centre lathe. The tool or electrode material used for this work is 100% Copper. The tool specimen was prepared of dimensions as 1 inches length and 5 mm diameter.
Fig. 1 Setup of EDM for experiments
The parameters selected for present research are peak current, pulse on time and pulse off time while the responses selected are MRR, TWR and white layer thickness. The experiments were designed on the basis of Taguchi L9 orthogonal array and the experiments were performed accordingly. SEM was conducted in order to assess the white layer thickness after machining. The following table 1 shows the set of parameters with corresponding values of MRR, TWR and Average White Layer Thickness.
Table I: Parameter Set For Experiment With Corresponding Values Of Mrr, Twr And Average White Layer Thickness Exp. No
Ip Ton Toff MRR
(mm3/min)
TWR
(mm3/min)
Average WLT (µm)
1 1 10 10 0.167 0.073 47.32
2 1 20 20 0.204 0.090 48.16
3 1 30 30 0.254 0.074 56.57
4 4 10 20 1.098 0.321 58.29
5 4 20 30 1.470 0.859 66.01
6 4 30 10 3.539 3.100 80.71
7 7 10 30 1.196 0.524 85.26
8 7 20 10 8.888 2.596 97.24
[image:2.612.99.507.583.740.2]III.RESULTSANDDISCUSSION A. Material Removal Rate
Material removal rate is a performance measure that gives the productivity of EDM process. Material removal rate is calculated by dividing the work piece weight loss in grams to the product of density of the work piece in gm/cc and the machining time in minutes. For calculation of MRR, the specimen is weighed before machining and after each run using electronic balance. The weight difference gives the amount of material lost during machining which is noted down as weight loss. During machining of specimen, the machining time is also noted down for each run to calculate MRR.
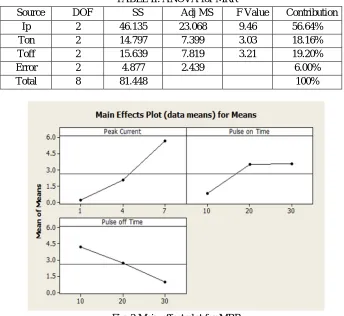
[image:3.612.135.479.215.531.2]The following table II shows the ANOVA for MRR. Its clear from the table that the major influencing parameter for MRR is peak current with a contribution of 56.64% while the least influencing is pulse on time with a contribution of 18.16%.
TABLE II: ANOVA for MRR
Source DOF SS Adj MS F Value Contribution
Ip 2 46.135 23.068 9.46 56.64%
Ton 2 14.797 7.399 3.03 18.16%
Toff 2 15.639 7.819 3.21 19.20%
Error 2 4.877 2.439 6.00%
Total 8 81.448 100%
Fig. 2 Main effect plot for MRR
The figure 2 above presents the mean effect plot for MRR. It shows that the MRR increases with both peak current and pulse on time. In addition, both these parameters have major influence on MRR with increase in the level of peak current and pulse on time, the MRR is observed to follow an increasing trend. It probably occurred because the intensity of spark is more at higher level of parameters and hence MRR increases. MRR is observed to be follow a decreasing trend with pulse off time and it is the least influencing parameter for MRR and has only 19.20% contribution.
B. Tool Wear Rate
For calculation of TWR, the tool is weighed before machining and after each run using electronic balance. The weight difference gives the amount of material eroded during machining, also the machining time is noted down for each experiment to calculate TWR. Tool wear rate is calculated by dividing the tool weight loss in grams to the product of density of the tool in gm/cc and the machining time.
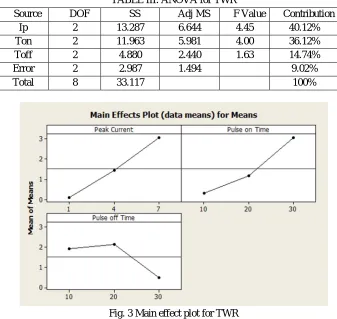
TABLE III: ANOVA for TWR
Source DOF SS Adj MS F Value Contribution
Ip 2 13.287 6.644 4.45 40.12%
Ton 2 11.963 5.981 4.00 36.12%
Toff 2 4.880 2.440 1.63 14.74%
Error 2 2.987 1.494 9.02%
[image:4.612.138.475.83.402.2]Total 8 33.117 100%
Fig. 3 Main effect plot for TWR
The figure 3 above illustrates that the tool starts to degrade with increase in levels of peak current and pulse on time while with pulse off time reverse trend is followed. This is similar to the case of MRR. Since pulse on time and peak current are the most influencing parameters, hence the plot obtained for them are showing increasing trend. On the other hand for pulse duty factor, the curve obtained is almost flat for first two levels. On further increasing the value of pulse duty factor, a declining trend is followed. Peak current is the major influencing parameter for tool wear rate with a contribution of 40.12%.
C. White Layer Thickness
White layer (WL) is a re-deposited or recast layer caused by rapid quenching in dielectrics in EDM. Unlike the uniform solid WL by a mechanical cutting, the WL in EDM at main cutting mode is a bi-layer structure. White layer thickness was calculated by SEM. Figure 4 shows the SEM image of machined sample 2.
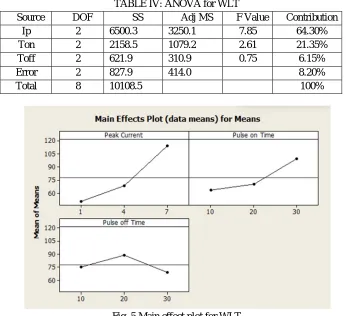
[image:4.612.157.468.545.710.2]The following table IV shows the ANOVA for WLT. Its clear from the table that the major influencing parameter for WLT is peak current followed by pulse on time. The pulse off time is the least influencing parameter and has negligible influence on WLT. Its contribution is 6.15%.
TABLE IV: ANOVA for WLT
Source DOF SS Adj MS F Value Contribution
Ip 2 6500.3 3250.1 7.85 64.30%
Ton 2 2158.5 1079.2 2.61 21.35%
Toff 2 621.9 310.9 0.75 6.15%
Error 2 827.9 414.0 8.20%
Total 8 10108.5 100%
Fig. 5 Main effect plot for WLT
The above graph shows the effect of input parameters on White layer thickness. By increasing the peak current and pulse on time, the white layer thickness increases. Peak current is the most dominating factor for white layer thickness with a contribution of 64.30% and has major influence on it. Higher intensity sparks are generated at higher levels of peak current, hence influence of peak current is highest and white layer thickness increases due to sudden quenching with increase in the value of peak current. Pulse on time is found to be the second most dominating parameter for White layer thickness with a contribution of 21.35%. With pulse off time, the white layer formation first increases. On further increase in pulse off time value, the white layer formation tends to decrease. Pulse off time has least influence on white layer thickness formation and has a contribution of only 6.15%.
IV.CONCLUSIONS
The present experimental study describes the optimization of input machining parameters in Electrical Discharge Machining of EN-40 with copper electrode using L9 orthogonal array of Taguchi method. These results show the performance of parameters at different levels to optimize the MRR, TWR and White Layer Thickness. Following conclusions are made:
A. Material removal rate increases with peak current and pulse on time and both the parameters have major influence on MRR.
MRR is observed to follow an increasing trend with increase in the level of peak current and pulse on time. It probably occurred because the intensity of spark is more at higher level of parameters and hence MRR increases.
B. MRR is observed to be follow a decreasing trend with pulse off time and it is the least influencing parameter for MRR and has
only 19.20% contribution.
C. The same behavior of parameters is also notice for tool wear rate. Tool starts to degrade with increase in levels of peak current
and pulse on time while with pulse off time reverse trend is followed.
E. By increasing the peak current and pulse on time, the white layer thickness increases. Peak current is the most dominating factor for white layer thickness with a contribution of 64.30% and has major influence on it. It is usually due to higher intensity sparks generated at higher levels of peak current, hence influence of peak current is highest.
F. White layer thickness increases due to sudden quenching with increase in the value of peak current.
G. Pulse on time is found to be the second most dominating parameter for white layer thickness with a contribution of 21.35%.
H. With pulse off time, the white layer formation first increases but on further increase in pulse off time value, the white layer formation tends to decrease. Pulse off time has least influence on white layer thickness formation and has a contribution of only 6.15%.
REFERENCES
[1] Deepu P.Nair, Dr. Binu C.Yeldose, Dr. Cibu K. Varghese, “Investigation of Surface Roughness on M300 Steel Machined By EDM”, International Journal of Engineering and Innovative Technology Volume 4, Issue 2, August 2014.
[2] PP.M. George, B.K. Rahunath, L.M. Manocha and Ashish M. Warrier, “EDM machining of carbon composite a Taguchi approach”, Journal of Material Processing Technology Vol 145, 66-71, 2004.
[3] S. Ben Salem , W. Tebni , E. Bayraktar, “Prediction of surface roughness by experimental design methodology in Electrical Discharge Machining (EDM)”, Journals of Achievements in Materials and Manufacturing Engineering Volume 49, Issue 2, December 2011.
[4] V. Chandrasekaran, D. Kanagarajan, R. Karthikeyan, “Optimization of EDM Characteristics of WC/5ni Composites Using Response Surface Methodology”, International Journal of Recent Technology and Engineering, Volume-2, Issue-5, November 2013.
[5] Francesco Modica, Valeria Marrocco, Giacomo Copani and Irene Fassi Sustainable Micro-Manufacturing of Micro-Components via Micro Electrical Discharge Machining, Sustainability2011, 3, 2456-2469.
[6] Kumar Sandeep, “Current Research Trends in Electrical Discharge Machining” Research Journal of Engineering Sciences Volume 2(2), 56-60, February 2013. [7] W.S. Lau, M. Wang and W.B. Lee, “Electric discharge machining of Carbon fiber composite materials” Int. J. Machine Tools Manufacture. Volume 30, No. 2,
pp.297-308, 1990.
[8] Amoljit S. Gill, Sanjeev Kumar, “Surface Roughness Evaluation for EDM of En31 with Cu-Cr-Ni Powder Metallurgy Tool”, International Journal of Mechanical, Aerospace, Industrial, Mechatronic and Manufacturing Engineering Vol:8, No:7, 2014.
[9] Navdeep Malhotra, Sona Rani and Khalid Sheikh, “Optimization of control parameters for surface roughness in side flushing form of die sink EDM”, Journal of engineering research and studies pp. 228-233, 2011.
[10] H.T.Lee and T.Y.Tai, “Relationship between EDM parameters and surface crack formation” Journal of Materials Processing Technology 142 (2003) 676-683. [11] Rajesha S, C.S. Jawalkar, Radha Raman Mishra, A.K. Sharma, Pradeep Kumar, “Study of Recast Layers and Surface Roughness on Al-7075 metal matrix
composite during EDM machining”, International Journal of Recent advances in Mechanical Engineering, Vol.3, No.1, February 2014.