Performance Analysis of Various Two Stage Non
Linear Adaptive FIR Filter Algorithms for PLI and
BW Artifact Cancellation in
ECG
Marwan Abdul Kaeem Aziz1, B. Bhaskara Rao 2, Ch. D Uma Sankar 3 1
M.Tech Student, Dept. of ECE, University College of Engineering and Technology, Acharya Nagarjuna University, Guntur, AP, India
2
Assistant Professor, Dept. of ECE, University College of Engineering and Technology, Acharya Nagarjuna University, Guntur, AP, India
3
Assistant Professor, Dept. of ECE, University College of Engineering and Technology, Acharya Nagarjuna University, Guntur, AP, India
Abstract: Electrocardiogram (ECG) is a measure of the electrical activity of the heart, and is obtained by surface electrodes at standardized locations on the patient’s chest. During acquisition, various artifacts/noises such as power-line interference (PLI), baseline wander (BW), muscle artifacts (MA) and motion artifacts (EM), obscure the ECG. It is important that these artifacts are minimized for the clinicians to make better diagnoses on heart problems. This paper investigates the innovative concept of adaptive noise cancellation (ANC) using two stage form of adaptive filters. The concept of cascading and its algorithm for real-time application is simulated on MATLAB. The proposed algorithm utilizes two adaptive filters to estimate gradients accurately which results in good adaptation and performance. The objective of the present investigation is to provide solution in order to improve the performance of noise canceller in terms of filter parameters which are obtained with the help of adaptive algorithms. Different kinds of two stage ANC algorithms are used to eliminate artifacts in Electrocardiogram (ECG) by considering the noises such as power line interference and baseline wander. The simulation results show that the performance of the two stage ANC is superior to the conventional single stage ANC system in terms of higher signal-to-noise ratio. Finally, two stage adaptive algorithms are applied on real time ECG signals obtained from the Massachusetts Institute of Technology-Beth Israel Hospital (MIT-BIH) data base and compared their performance with the conventional single stage adaptive algorithms in terms of parameters Signal-to-Noise Ratio (SNR), Mean Square Error (MSE), Root Mean Square Error (RMSE) and Distortion.
Keywords: ECG , PLI, BW, MA, EM, ANC,MIT-BIH, SNR, MSE, RMSE, Distortion
I. INTRODUCTION
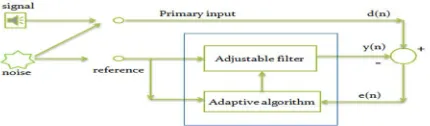
Signals play important role in the field of medical, electrical, electronic and communication engineering. The signals related to medical are known as biomedical signals such as ECG, EEG and EMG that contain lot of information. ECG is an important biomedical tool for the diagnosis of heart disorders. It is a non invasive technique that is measured on the surface of the human body, which is used in identification of heart diseases. Any disorder of heart beat or rhythm, or change in the morphological pattern, is an indication of cardiac arrhythmia, which could be detected by analysis of recorded ECG waveform. ECG signal represents an extremely important measure for doctors, as it provides vital information about a patient’s cardiac condition and general health. Generally the frequency band of the ECG signal is 0.05 Hz to 100 Hz. In these situations, adaptive algorithms are needed in order to continuously update the filter coefficient. Adaptive filtering finds application in noise cancellation called as Adaptive Noise Cancellation (ANC) which involves in time-varying signals and systems. ANC is an effective method for recovering a signal corrupted by additive noise and it is an important core area of the digital signal processing. Fig.1 shows the basic problem and the
adaptive noise cancelling solution. A signal s(n) is transmitted over a channel to a sensor that also receives a noise n1(n)
uncorrelated with the signal.The primary input to the canceller is combination of signal and noise i.e. s(n) + n1(n). A second sensor
receives a noise n2(n) uncorrelated with the signal but correlated with the noise n1(n) that provides the
FIGURE 1: Adaptive Noise Canceller
Fig.1 shows a block diagram in which a sample from a digital reference input x(n) is fed into a device, called an adaptive filter, that computes a corresponding output sample y(n) at time n. As the time index n is incremented, it is estimated that the output of the adaptive filter becomes a better and better match to the desired response signal through this adaptation process, such that the magnitude of e(n) decreases over time. An adaptive algorithm is a set of recursive equations used to adjust the weight vector w(n) automatically to minimize the error signal e(n) such that the weight vector converges iteratively to the optimum solution i.e. the minimum MSE[3].
II. PROBLEM IDENTIFICATION
In order to review the ECG of the patient in real-time, there is a chance that the ECG signal may be contaminated by noise. The predominant artifacts present in the ECG includes: power-line interference (PLI), baseline wander (BW), muscle artifacts (MA) and motion artifacts (EM), mainly caused by patient breathing, movement, power line interference, bad electrodes and improper electrode site preparation. Most types of interference that affect ECG signals may be removed by band pass filters which may not give best result. The disturbances in ECG signal need to be reduced to improve the accuracy and reliability for better diagnosis.Many methods have been implemented to remove the noise from noisy ECG signal. The basic method is to pass the signal through static filters such as high pass, low pass and notch filters. The static filters have fixed filter coefficients by which it is difficult to reduce the instrumentation noise due to the time varying behavior that is unknown. To overcome these limitations of static filters, different adaptive filtering methods have been developed.
III. PROPOSED METHODOLOGY
LMS algorithm is most commonly used adaptive algorithm than RLS, Kalman filter. LMS algorithm uses a gradient vector to estimate a time-varying signal. The gradient is the Del operator that is applied to find the estimate of a function which is the error with respect to the nth coefficient at every instant of time. The concept of cascading adaptive FIR filters is presented in which various types of cascading is done using LMS adaptive filter. The block diagram shown in figure.2. Implements the principle of two stage adaptive noise canceller (ANC).
STAGE 1 STAGE 2
d(n) + e(n) dc(n) + ec(n)
_ _
xc(n) yc(n)
x(n) y(n)
+
FIGURE 2: Proposed Two Stage Adaptive Noise Canceller for ECG denoising
In this method the input signal given to the first adaptive filter consists of original clean ECG signal s(n) and noise n1(n) which is
denoted as primary signal d(n) in fig.2 The secondary noise or the reference noise signal x(n) given to adaptive filter is noise signal
Adaptive filter Adaptive
filter
[image:2.612.25.464.468.677.2]n2(n).The output of the adaptive filter y(n), subtracted from the primary signal d(n) gives the desired signal or the error signal e(n)
for second adaptive filter.
A. Analysis of Single Stage Adaptive algorithms
The two stage ANC shown in figure.2 consists of first adaptive filter whose parameters d(n) is the primary signal, e(n) is the desired
signal or error signal, y(n) is the output of an adaptive FIR filter, µ is the step size, w(n) is the filter weight vector, x(n) is the
reference input signal vector, and N is the filter length used as parameters of first LMS filter. Here x(n) is the input vector of time
delayed input values, x(n)=[x(n) x(n-1) x(n-2)…...x(n-N+1)]T. The vector w(n)=[w0(n) w1(n) w2(n)……wN-1(n)] T represents the
coefficients of the adaptive FIR filter tap weight vector at time n. Selection of a suitable value for step size parameter µ is imperative to the performance of the adaptive algorithms, i.e is if µ too small the time taken by the adaptive filter to converge on
the optimal solution will be too long; and µ is too large the adaptive filter becomes unstable and its output diverges.The single stage
adaptive algorithms require three distinct steps in each iteration as follows. The output of the first stage adaptive FIR filter, y(n) is calculated using equation(2)
( ) =∑ ( ) ( − ) = ( ) ( ) (2)
The value of the error estimation is calculated using equation(3)
( ) = ( )− ( ) (3)
The tap weight vectors of the first stage adaptive FIR filter are updated for the next iteration by using equations (4)-(7) for different adaptive algorithms.
(i) ( ) ℎ
( + 1) = ( ) + 2 ( ) ( ) (4)
( ) ℎ
( + 1) = ( ) + 2∗ ∗ { ( )}∗ ( ) (5)
Sgn is signum, function
( ) ℎ
( + 1) = ( ) + 2∗ ∗ { ( )}∗ { ( )} (6)
( ) ℎ
( + 1) = ( ) + 2∗ ∗ ( )∗ { ( )} (7)
B. Analysis of Two Stage Adaptive algoRithms
The two stage structure of ANC as shown in Figure. 2, consist of input signal xc(n) that is cascaded reference input signal
vector xc(n) and cascaded primary signal dc(n) [19]
The two stage adaptive algorithms require five distinct steps in each iteration as follows.
Compute the cascaded input signal vector xc(n) using equation(8)
( ) = ( )− ( ) (8)
The output of the second stage adaptive FIR filter, yc(n) is calculated using equation(9)
( ) =∑ ( ) ( − ) = ( ) ( ) (9)
Here xc(n) and wc(n) are the input vector of time delayed cascaded reference input signal values, the tap weights of thesecond stage
adaptive FIR filter
Assign first stage error signal to second stage as acascaded primary signal dc(n)
( ) = ( ) (10)
The value of the error estimation is calculated using equation(11)
( ) = ( )− ( ) (11)
The tap weight vectors of the second stage adaptive FIR filter are updated in preparation for the next iteration by equations (12)-(19) for different adaptive algorithms.
( ) ℎ
( + 1) = ( ) + 2 ( ) ( ) (12)
( + 1) = ( ) + 2∗ ∗ { ( )}∗ ( ) (13)
The step size value for the input vector is calculated as
( ) ℎ
( + 1) = ( ) + 2∗ ∗ { ( )}∗ { ( )} (14)
( ) ℎ
( + 1) = ( ) + 2∗ ∗{ ( )}∗ { ( )} (15)
Equation (28) is used to estimate the remaining error presented in the system as
( ) = ( )− ( ) ( ) (16)
( ) = ( )− ( ) = ( ) + ( )− ( ) (17)
( ) = ( ) + ( )− ( ) = ( ) + ( ) (18)
( ) = ( )− ( ) (19)
Here n3 (n) assumption made for the second adaptive filters as input signal.
C. Performance Parameters of Two Stage ANC
In the two stage ANC algorithm, the error signal e(n) of first adaptive filter is used as a primary signal dc(n) of second Adaptive
filter, the output y(n) of first adaptive filter subtracted from the reference noise signal x(n) is xc(n) serves as the reference noise
signal for second adaptive filter. Therefore, the two stage adaptive algorithms are generations and simulations are performed by MATALB for non-stationary environment. Desired signal d(n) is a noisy signal including clean ECG signal and the reference signal x(n) is the predominant artifacts(noise) present in the ECG which may be caused due to power-line interference (PLI), baseline wander (BW), muscle artifacts (MA) and motion artifacts (EM).The clean ECG signal can be extracted from primary signal. The performances of simulation of two stage ANC and single stage ANC are compared quantitatively by parameters Mean Square Error (MSE), Root Mean Square Error (RMSE), Signal-to-Noise Ratio (SNR) and Distortion [3-5]
IV. SIMULATION RESULTS AND DISCUSSION
The benchmark MIT-BIH arrhythmia database [48] was used to test the performance of various adaptive algorithms for ECG denoising.The data base consists of 48 half hour excerpts of two channel ambulatory ECG recordings, which were obtained from 47 subjects, including 25 men aged 32-89 years, and women aged 23-89 years. The recordings were digitized at 360 samples per second per channel with 11-bit resolution over a 10 mV range. The simulations were done by collecting 3600 samples of ECG
recordings. In this simulation the initial filter weight vector for both the filters is N+1 filter coefficients that are designed from an
Nth order low pass FIR digital filter with length same as the length of ECG record using kaiser window function with filter cut-off
frequency Fc=100 Hz, sampling frequency Fs=360 Hz and beta=3. A dataset of five ECG records: data100, data105, data108,
data203 and data228 are considered to ensure the consistency of the results. The reference signal n2 (n) shown in figure 1 is taken
from noise generator. A synthetic PLI with 1mv amplitude is simulated for PLI cancellation where no harmonics are synthesized. In order to test the filtering capability in non-stationary environment real BW, MA and EM noises with 3600 samples are considered. These are taken from MIT-BIH normal sinus rhythm database (NSTDB) [53] which consists of 12 half-hour ECG recordings and 3 half-hour recordings of noise typical in ambulatory ECG recordings. The noise recordings that occur due to physically active volunteers, standard ECG recorders, leads, and electrodes that were placed on the limbs in positions of the subjects’ ECGs that contain predominantly baseline wander (in record 'bw'), muscle (EMG) artifact (in record 'ma'), and electrode motion artifact (in record 'em'). Electrode motion artifact is generally considered the most troublesome, since it can mimic the appearance of ectopic beats and cannot be removed easily by simple filters, as can noise of other types.
A. Adaptive Power-line Interference (PLI) Cancellation
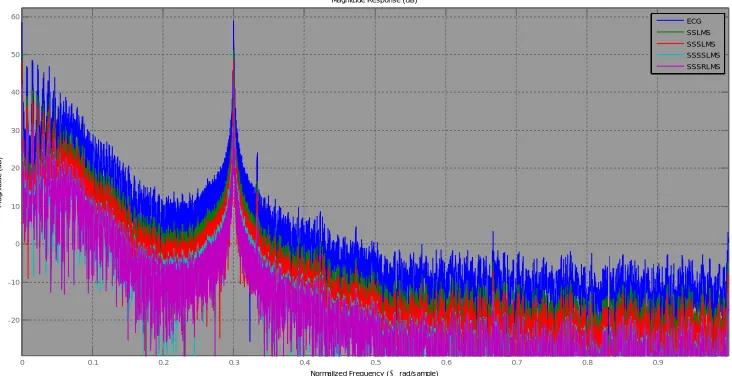
RMSE and Distortion improvement over the conventional single stage adaptive algorithms. The figures 5-6 depict the Frequency spectrum of various single stage adaptive filter algorithms and two stage adaptive filter algorithms in PLI cancellation respectively. Table.3-6 shows improvement for the entire dataset in terms of SNR, Mean Square Error (MSE), Root Mean Square Error (RMSE) and Distortion.Table.3 SNR improvement for the dataset.
Rec.No SNRBF SSLMS TSLMS SSSLMS TSSLMS SSSSLMS TSSSLMS SSSRLMS TSSRLMS
100 0.2144 1.6081 14.1319 1.4359 14.1793 2.7108 15.663 1.8941 12.306
105 0.712 2.2436 14.6067 1.5759 15.2973 3.1044 16.1033 2.5346 13.1566
108 -0.0059 1.2449 14.3381 1.2473 14.2305 2.3853 16.3903 1.4478 13.0667
203 2.9671 4.2209 15.4799 2.9805 18.2001 3.929 16.9684 4.2068 14.6273
228 -1.0532 0.0691 14.6472 0.0118 14.3514 1.4297 15.527 0.3669 13.1478
AVG.SNR 0.56688 1.87732 14.64076 1.45028 15.25172 2.71184 16.1304 2.09004 13.26088
Table.3 shows the performance of SSLMS, TSLMS, SSSLMS, TSSLMS, SSSSLMS, TSSSLMS, SSSRLMS, and TSSRLMS algorithms in terms of SNR. The simulation results state that Two Stage Adaptive algorithms have greater efficiency than Single Stage Adaptive algorithms. It is clear from Table 3 that Two Stage Adaptive algorithms outperform Single Stage Adaptive algorithms in estimating the ECG noises.
Table.4 MSE improvement for the dataset.
Rec.No SSLMS TSLMS SSSLMS TSSLMS SSSSLMS TSSSLMS SSSRLMS TSSRLMS
100 0.0907 0.0771 0.0944 0.0793 0.0704 0.0706 0.0849 0.0731
105 0.0879 0.0765 0.1025 0.0848 0.0721 0.0729 0.0822 0.0737
108 0.0937 0.0791 0.0937 0.0791 0.0721 0.0674 0.0894 0.075
203 0.0937 0.1004 0.1246 0.1108 0.1002 0.1132 0.094 0.1039
228 0.0965 0.0798 0.0978 0.0804 0.0706 0.0626 0.0901 0.0729
AVG.MSE 0.0925 0.08258 0.1026 0.08688 0.07708 0.07734 0.08812 0.07972
Table.5 RMSE improvement for the dataset.
Rec.No SSLMS TSLMS SSSLMS TSSLMS SSSSLMS TSSSLMS SSSRLMS TSSRLMS
100 0.3011 0.2778 0.3072 0.2816 0.2652 0.2657 0.2914 0.2704
105 0.2964 0.2766 0.3201 0.2911 0.2684 0.27 0.2866 0.2715
108 0.3061 0.2813 0.3061 0.2812 0.2685 0.2595 0.2991 0.2738
203 0.306 0.3168 0.353 0.3328 0.3165 0.3364 0.3065 0.3223
228 0.3107 0.2824 0.3128 0.2836 0.2656 0.2502 0.3002 0.27
AVG.RMSE 0.30406 0.28698 0.31984 0.29406 0.27684 0.27636 0.29676 0.2816
Table.4-5 shows the performance of SSLMS, TSLMS, SSSLMS, TSSLMS, SSSSLMS, TSSSLMS, SSSRLMS, and TSSRLMS algorithms in terms of MSE and RMSE. The simulation results state that Two Stage Adaptive algorithms have minimum MSE and RMSE than single stage adaptive algorithms.
Table.6 DISTORTION for the dataset.
Rec.No SSLMS TSLMS SSSLMS TSSLMS SSSSLMS TSSSLMS SSSRLMS TSSRLMS
100 -10.4246 -11.1267 -10.2524 -11.0089 -11.5273 -11.5134 -10.7106 -11.3599
105 -10.5625 -11.1624 -9.8948 -10.7178 -11.4233 -11.3741 -10.8535 -11.3256
108 -10.2817 -11.017 -10.2841 -11.0201 -11.4221 -11.716 -10.4846 -11.2501
203 -10.2847 -9.9845 -9.0443 -9.5562 -9.9928 -9.4625 -10.2706 -9.8347
228 -10.1532 -10.9812 -10.0959 -10.9467 -11.5138 -12.0349 -10.451 -11.3735
Table.6 shows the performance of SSLMS, TSLMS, SSSLMS, TSSLMS, SSSSLMS, TSSSLMS, SSSRLMS, and TSSRLMS algorithms in terms of distortion. The simulation results state that two stage adaptive algorithms have minimum signal distortion than single stage adaptive algorithms.
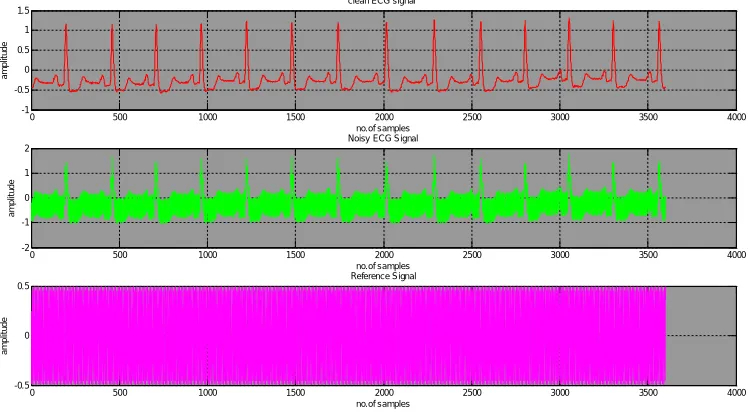
[image:6.612.122.497.152.358.2]These results for data105 are shown in figure 3.
FIGURE 3: Simulated model l filtering results of PLI Cancelation (a) Clean ECG Signal(red) for MIT-BIH Record Number 105 (b) MIT-BIH Record 105 with 60Hz Noise(green) (c) Reference 60Hz Noise Signal(magenta)
FIGURE 4: Simulation results of PLI Cancelation for MIT-BIH Record Number 105 (a) Recovered (first red) signal using SSLMS algorithm (b) Recovered (second red) signal using TSLMS algorithm (c) Recovered(first blue) signal using SSNLMS algorithm (d) Recovered(second blue) signal using TSNLMS algorithm (e) Recovered (first green) signal using SSVSLMS algorithm (f) Recovered(second green) signal using TSVSLMS algorithm (g) Recovered(first magenta) signal using SSVSNLMS algorithm (h) Recovered(second magenta) signal using TSVSNLMS algorithm
0 500 1000 1500 2000 2500 3000 3500 4000
-1 -0.5 0 0.5 1 1.5
clean ECG signal
no.of samples
amplit
u
de
0 500 1000 1500 2000 2500 3000 3500 4000
-2 -1 0 1 2
Noisy ECG Signal
no.of samples
amplit
u
de
0 500 1000 1500 2000 2500 3000 3500 4000
-0.5 0 0.5 Reference Signal no.of samples amplit u de
0 500 1000 1500 2000 2500 3000 3500 4000 -1
0 1 2
Single Stage Adaptive filtered Output signal Using LMS
no.of samples a m p li tu d e
0 500 1000 1500 2000 2500 3000 3500 4000 -2
0 2
Single Stage Adaptive filtered Output signal Using SLMS
no.of samples a m p li tu d e
0 500 1000 1500 2000 2500 3000 3500 4000 -1
0 1 2
Single Stage Adaptive filtered Output signal Using SSLMS
no.of samples a m p lit u d e
0 500 1000 1500 2000 2500 3000 3500 4000 -1
0 1 2
Single Stage Adaptive filtered Output signal Using SRLMS
no.of samples a m p lit u d e
0 500 1000 1500 2000 2500 3000 3500 4000 -1
0 1 2
Second Stage Adaptive filtered Output signal Using LMS
no.of samples a m p li tu d e
0 500 1000 1500 2000 2500 3000 3500 4000 -2
0 2
Second Stage Adaptive filtered Output signal Using SLMS
no.of samples a m p li tu d e
0 500 1000 1500 2000 2500 3000 3500 4000 -1
0 1 2
Second Stage Adaptive filtered Output signal Using SSLMS
no.of samples a m p lit u d e
0 500 1000 1500 2000 2500 3000 3500 4000 -1
0 1 2
Second Stage Adaptive filtered Output signal Using SRLMS
[image:6.612.123.502.420.631.2]FIGURE 5: Frequency Spectrum of ECG Signal with PLI for MIT-BIH Record Number 105 using Single Stage Adaptive algorithms
FIGURE 6: Frequency Spectrum of ECG Signal with PLI for MIT-BIH Record Number 105 using Two Stage Adaptive algorithms
B. Baseline Wander (BW) Removal
In this experiment 3600 samples of ECG signal corrupted with real baseline wander (BW of MIT-BIH NSTDB), are considered which are given as primary input to the adaptive filter of figure 1. The figures 7-8 depict the BW cancellation by considering the number of samples and amplitude on x-axis and y-axis respectively. The performance of the adaptive filter algorithms are assessed by SNR, MSE, RMSE and Distortion Values for entire dataset. The two stage adaptive algorithms achieve SNR, MSE, RMSE and Distortion improvement over the conventional single stage adaptive algorithms. The figures 9-10 depict the Frequency spectrum of various single stage adaptive filter algorithms and two stage adaptive filter algorithms in BW cancellation respectively.Table.7-10 shows improvement for the entire dataset in terms of SNR, Mean Square Error (MSE), Root Mean Square Error (RMSE) and Distortion.
0 0.1 0.2 0.3 0.4 0.5 0.6 0.7 0.8 0.9
-20 -10 0 10 20 30 40 50 60
Normalized Frequency ( rad/sample)
M
a
g
n
itu
d
e
(
d
B
)
Magnitude Response (dB)
ECG SSLMS SSSLMS SSSSLMS SSSRLMS
0 0.1 0.2 0.3 0.4 0.5 0.6 0.7 0.8 0.9
-30 -20 -10 0 10 20 30 40 50 60
Normalized Frequency ( rad/sample)
M
a
g
n
it
u
d
e
(
d
B
)
Magnitude Response (dB)
Table.7 SNR improvement for the dataset.
Rec.No SNRBF SSLMS TSLMS SSSLMS TSSLMS SSSSLMS TSSSLMS SSSRLMS TSSRLMS
100 1.1285 6.0577 10.9859 5.8554 11.0713 9.2653 19.0823 7.1094 10.366
105 1.6261 5.3775 11.6642 4.8272 12.3375 6.8567 18.6 5.9054 11.0613
108 0.9082 5.5552 11.0375 5.5704 10.7452 9.3451 18.0143 6.3952 10.8015
203 3.8812 5.5024 13.1221 5.3478 15.1044 5.1471 20.5569 5.5158 12.5127
228 -0.1391 3.4892 11.0337 3.5345 10.639 7.275 16.4032 4.3969 10.6105
AVG.SNRS 1.48098 5.1964 11.56868 5.02706 11.97948 7.57784 18.53134 5.86454 11.0704
Table.7 shows the performance of SSLMS, TSLMS, SSSLMS, TSSLMS, SSSSLMS, TSSSLMS, SSSRLMS, and TSSRLMS algorithms in terms of SNR. The simulation results state that Two Stage Adaptive algorithms have greater efficiency than Single Stage Adaptive algorithms. It is clear from Table 3 that Two Stage Adaptive algorithms outperform Single Stage Adaptive algorithms in estimating the ECG noises.
Table.8 MSE improvement for the dataset.
Rec.No SSLMS TSLMS SSSLMS TSSLMS SSSSLMS TSSSLMS SSSRLMS TSSRLMS
100 0.0326 0.0216 0.0341 0.0218 0.0156 0.0135 0.0256 0.022
105 0.0427 0.0351 0.0485 0.0346 0.0304 0.03 0.0378 0.0368
108 0.0347 0.0211 0.0346 0.0215 0.0145 0.0123 0.0286 0.019
203 0.0697 0.0873 0.0723 0.0687 0.0757 0.0792 0.0695 0.0915
228 0.0439 0.0261 0.0435 0.0259 0.0184 0.0156 0.0356 0.0217
AVG.MSE 0.04472 0.03824 0.0466 0.0345 0.03092 0.03012 0.03942 0.0382
Table.9 RMSE improvement for the dataset.
Rec.No SSLMS TSLMS SSSLMS TSSLMS SSSSLMS TSSSLMS SSSRLMS TSSRLMS
100 0.1804 0.147 0.1847 0.1477 0.1247 0.116 0.1598 0.1485
105 0.2066 0.1874 0.2201 0.186 0.1743 0.1732 0.1944 0.1919
108 0.1864 0.1452 0.1861 0.1467 0.1205 0.1111 0.1692 0.138
203 0.2641 0.2954 0.2688 0.2621 0.2751 0.2814 0.2636 0.3025
228 0.2096 0.1616 0.2085 0.161 0.1355 0.1248 0.1888 0.1472
AVG.RMSE 0.20942 0.18732 0.21364 0.1807 0.16602 0.1613 0.19516 0.18562
Table.8-9 shows the performance of SSLMS, TSLMS, SSSLMS, TSSLMS, SSSSLMS, TSSSLMS, SSSRLMS, and TSSRLMS algorithms in terms of MSE and RMSE. The simulation results state that Two Stage Adaptive algorithms have minimum MSE and RMSE than single stage adaptive algorithms. Table.10 DISTORTION for the dataset.
Rec.No SSLMS TSLMS SSSLMS TSSLMS SSSSLMS TSSSLMS SSSRLMS TSSRLMS
100 -14.8742 -16.6511 -14.6719 -16.6141 -18.0817 -18.7102 -15.9259 -16.5669
105 -13.6964 -14.5438 -13.1461 -14.6091 -15.1756 -15.2282 -14.2243 -14.3399
108 -14.592 -16.7593 -14.6072 -16.6727 -18.3819 -19.0893 -15.432 -17.2018
203 -11.5662 -10.592 -11.4116 -11.6322 -11.2109 -11.0141 -11.5796 -10.3857
228 -13.5733 -15.83 -13.6186 -15.8609 -17.3592 -18.0787 -14.481 -16.6425
AVG.DIST -13.66042 -14.87524 -13.49108 -15.0778 -16.04186 -16.4241 -14.32856 -15.02736
FIGURE 7: Simulated model filtering results of BW Cancelation (a) Clean ECG Signal(red) for MIT-BIH Record Number 105 (b) MIT-BIH Record 105 with 60Hz Noise (green) (c) Reference BW Noise Signal (magenta)
FIGURE 8: Simulation results of Baseline Wander (BW) Cancelation for MIT-BIH Record Number 105 (a) Recovered (first red) signal using SSLMS algorithm (b) Recovered (second red) signal using TSLMS algorithm (c) Recovered(first blue) signal using SSNLMS algorithm (d) Recovered(second blue) signal using TSNLMS algorithm (e) Recovered (first green) signal using SSVSLMS algorithm (f) Recovered(second green) signal using TSVSLMS algorithm (g) Recovered(first magenta) signal using
SSVSNLMS algorithm (h) Recovered(second magenta) signal using TSVSNLMS algorithm
0 500 1000 1500 2000 2500 3000 3500 4000
-1 -0.5 0 0.5 1 1.5
clean ECG signal
no.of samples a m p lit u d e
0 500 1000 1500 2000 2500 3000 3500 4000
-1 -0.5 0 0.5 1
Noisy ECG Signal
no.of samples a m p lit u d e
0 500 1000 1500 2000 2500 3000 3500 4000
-0.4 -0.35 -0.3 -0.25 -0.2 Reference Signal no.of samples a m p lit u d e
0 500 1000 1500 2000 2500 3000 3500 4000 -1
0 1
Single Stage Adaptive filtered Output signal Using LMS
no.of samples a m p lit u d e
0 500 1000 1500 2000 2500 3000 3500 4000 -1
0 1
Single Stage Adaptive filtered Output signal Using SLMS
no.of samples a m p li tu d e
0 500 1000 1500 2000 2500 3000 3500 4000 -1
0 1
Single Stage Adaptive filtered Output signal Using SSLMS
no.of samples a m p lit u d e
0 500 1000 1500 2000 2500 3000 3500 4000 -1
0 1
Single Stage Adaptive filtered Output signal Using SRLMS
no.of samples a m p lit u d e
0 500 1000 1500 2000 2500 3000 3500 4000 -1
0 1
Second Stage Adaptive filtered Output signal Using LMS
no.of samples a m p lit u d e
0 500 1000 1500 2000 2500 3000 3500 4000 -1
0 1
Second Stage Adaptive filtered Output signal Using SLMS
no.of samples a m p li tu d e
0 500 1000 1500 2000 2500 3000 3500 4000 -1
0 1
Second Stage Adaptive filtered Output signal Using SSLMS
no.of samples a m p lit u d e
0 500 1000 1500 2000 2500 3000 3500 4000 -1
0 1
Second Stage Adaptive filtered Output signal Using SRLMS
[image:9.612.114.507.367.645.2]FIGURE 9: Frequency Spectrum of ECG Signal with BW for MIT-BIH Record Number 105 using Single Stage Adaptive algorithms
FIGURE 10: Frequency Spectrum of ECG Signal with BW for MIT-BIH Record Number 105 using Two Stage Adaptive algorithms
V. CONCLUSIONS
This paper presents the adaptive noise cancellation of ECG Signals using two stage adaptive FIR filters. The algorithm is same as the traditional methods using gradient descent technique with single adaptive FIR filter. Two stage adaptive FIR filter algorithm guarantees a more stable conversion in response to variations in input signal power. The performance analysis of two stage adaptive FIR filter based algorithm is carried out for noise cancellation and its simulation is performed successfully using MATLAB 2013a. In order to study the performance of system, a comparison has been made between single stage and two stage two stage adaptive FIR filters. The proposed two stages ANC consist of noise and clean ECG signal as input parameters for which adaptive filtered output signal, error signal and filter weights are obtained as output parameters. The performance of single ANC and two stages ANC are compared on the basis of output signal, error signal, and filter weights, SNR, MSE, RMSE and distortion. The Two stage adaptive filter is much efficient in terms of noise cancellation than single stage adaptive filter. Simulation results demonstrate that the proposed method achieves good adaptation and performance in biomedical signal processing field. The Signal-to-Noise Ratio for various filters of two stages ANC was found to be higher than single stage ANC system.
0 0.1 0.2 0.3 0.4 0.5 0.6 0.7 0.8 0.9
-20 -10 0 10 20 30 40 50 60
Normalized Frequency ( rad/sample)
M
a
g
n
itu
d
e
(
d
B
)
Magnitude Response (dB)
ECG SSLMS SSSLMS SSSSLMS SSSRLMS
0 0.1 0.2 0.3 0.4 0.5 0.6 0.7 0.8 0.9
-20 -10 0 10 20 30 40 50 60
Normalized Frequency ( rad/sample)
M
a
g
n
itu
d
e
(
d
B
)
Magnitude Response (dB)
REFERENCES
[1] Mandic, Danilo P. ”A generalized normalized gradient descent algorithm.” IEEE Signal Processing Letters 11.2 (2004): 115-118.
[2] Van Alste, Jan A., and T. S. Schilder. ”Removal of base-line wander and power-line interference from the ECG by an efficient FIR filter with a reduced number of taps.” IEEE transactions on biomedical engineering 12 (1985): 1052-1060.
[3] Chavan, Mahesh S., R. A. Agarwala, and M. D. Uplane. ”Suppression of Baseline Wander and power line interference in ECG using Digital IIR Filter.” InternationaL journal of circuits, systems and signal processing 2.2 (2008): 356-365.
[4] Shantha Selva, S. Bharathi, and V. Sadasivam. ”Design of Optimal Discrete Wavelet for ECG Signal using orthogonal filter bank.” Conference on Computational Intelligence and Multimedia Applications, 2007. International Conference on. Vol. 1. IEEE, 2007.
[5] Hargittai, S. ”Savitzky-Golay least-squares polynomial filters in ECG signal processing.” Computers in Cardiology, 2005. IEEE, 2005
[6] Weiting, Yuan, and Zhou Runjing. ”An improved self-adaptive filter based on LMS algorithm for filtering 50Hz interference in ECG signals.” Electronic Measurement and Instruments, 2007. ICEMI’07. 8th International Conference on. IEEE, 2007.
[7] Rahman, Mohammad Zia Ur, Rafi Ahamed Shaik, and DV Rama Koti Reddy. ”Adaptive noise removal in the ECG using the block LMS algorithm.” Adaptive Science Technology, 2009. ICAST 2009. 2nd International Conference on. IEEE, 2009.
[8] Dixit, Shubhra, and Deepak Nagaria. ”Design and analysis of cascaded lms adaptive filters for noise cancellation.” Circuits, Systems, and Signal Processing 36.2 (2017): 742-766.
[9] Sun, Xu, and Sen M. Kuo. ”Active narrowband noise control systems using cascading adaptive filters.” IEEE Transactions on Audio, Speech, and Language Processing 15.2 (2007): 586-592.
[10] Sharma, Arpit, Sandeep Toshniwal, and Richa Sharma. ”Noise reduction technique for ECG signals using adaptive filters.” Int J Res Rev 7.2 (2014): 187-191. [11] Rahman, Md Zia Ur, Rafi Ahamed Shaik, and D. V. R. K. Reddy. ”Noise cancellation in ECG signals using computationally simplified adaptive filtering
techniques: Application to biotelemetry.” Signal Processing: An International Journal (SPIJ) 3.5 (2009): 1-12.
[12] Huang, Hsu-Chang, and Junghsi Lee. ”A new variable step-size NLMS algorithm and its performance analysis.” IEEE Transactions on Signal Processing 60.4 (2012): 2055-2060
[13] Gorriz, Juan Manuel, et al. ”A novel LMS algorithm applied to adaptive ´ noise cancellation.” IEEE Signal Processing Letters16.1 (2009): 34-37.
[14] Huang, Hsu-Chang, and Junghsi Lee. ”A new variable step-size NLMS algorithm and its performance analysis.” IEEE Transactions on Signal Processing 60.4 (2012): 2055-2060.
[15] Sankar, A. Bhavani, D. Kumar, and K. Seethalakshmi. ”Performance study of various adaptive filter algorithms for noise cancellation in respiratory signals.” Signal processing: An international journal (SPIJ) 4.5 (2010): 267.
[16] Yazdanpanah, Babak, K. Sravan Kumar, and G. S. N. Raju. ”Noise removal ecg signal using non-adaptive filters and adaptive filter algorithm.” 2015 International Conference on Electrical, Electronics, Signals, Communication and Optimization (EESCO). 2015.