Optimization of Process Parameters of Plastic
Injection Molding Machine by using Taguchi
Method
Parvinder Singh Brar
1, Abdul Samad
21Mtech Mechanical Engineering ( production), Marudhar Engineering College, Bikaner, Rajasthan 2 Assistant Professor Mechanical Engineering , Marudhar Engineering College, Bikaner, Rajasthan
Abstract: The present study is application of taguchi method to optimize the process parameters of injection molding machine to minimize the shrinkage of product to enhance the quality of product. The predicted optimal setting ensures minimum shrinkage of product. Five process parameters of plastic injection molding machine were taken as melt temperature, mold temperature, injection pressure, holding pressure and cooling time. By ANOVA analysis it is found that melt temperature is most significant and cooling time is least significant factor affecting the dimensional shrinkage of manufactured plastic product.
Keywords: Plastic injection molding, Dimensional shrinkage, Taguchi method, ANOVA Aanalysis, process parameter
I.INTRODUCTION AND LITERATURE REVIEW
Plastic injection molding is a technique which is used to produce plastic products. In this technique raw thermo plastic material is used to make the plastic products. Thermo plastic material is having property of easy melting and regaining shape when temperature is lowered. Raw material in form of pallets is fed into hopper. From hopper the raw material is transferred to machine by piston and cylinder mechanism. Raw material is heated to melting temperature with the help of heating elements during movement of raw material to injection chamber. The raw material which is in molten phase is transferred to mold cavity with the help of injection nozzle. The required injection pressure and holding pressure is applied with the help of control panel of plastic injection molding machine. It has the mechanism of product cooling so that product gets solidify. The product is holded for some time for proper cooling of product. After that product was removed from machine using clamping pressure. The product cools fast in mold cavity and finished product is removed from mold cavity. Like metal casting, in PIM also various types of defects are present due to process and design parameters maintained during plastic product manufacturing. Common defects are like shrinkage, warpage, sink mark. Most general and considerable defect is shrinkage of product during PIM process. In small and medium scale industries most of the workers set the process parameter data by their experience so that product dimensional shrinkage can be minimized, they do not have guidance in technical way for proper selection and tuning of process parameters and constants. Proper selection of process parameters in PIM Machine lead to minimize the defects from product and maintain best quality component in first attempt for the specific material [1].
Akbarzadeh, et al. [2]usedPolypropylene as raw material and process parameters which were selected for optimization are injection
pressure, melt temperature, packing pressure, packing time. Response surface methodology (RSM) is used to optimize the process parameters and response was in the terms of product shrinkage. Different type of regression equations are used to interpolate the
data of experiments and to get optimum value of parameters for minimum dimensional shrinkage. Andrisano, et al. [3] used
Polyphenylsulfone (ppsu) as raw material and process parameters which were selected for optimization are mold temperature, melt temperature, holding pressure, packing time. Response surface methodology (RSM) and Design of Simulation Experiments (DOSE) is used to optimize the process parameters and response was warpage. Warpage was less affected by mold temperature and more
affected by melt temperature & holding pressure. Barghash, et al. [4] used seven process parameters with three levels to reduce
shrinkage and warpage of plastic product made of Polypropylene (PP). Taguchi and ANOVA analysis is used to optimize the
process parameters. Dimensional shrinkage is more affected by melt temperature and hold time. E. Bociaga, et al [5]used RSM and
ANOVA to optimize the process parameters to reduce the cycle time of plastic injection molding process. Lixia, et al. [6]Artificial
Neural network (ANN) and Genetic Algorithm (GA) optimization technique is used by researchers for five process parameters to
reduce shrinkage defect from plastic cover. Xuan-Phuong Dang, et al.,[7]optimized directional shrinkage and war page by using
II.EXPERIMENTAL SET-UP
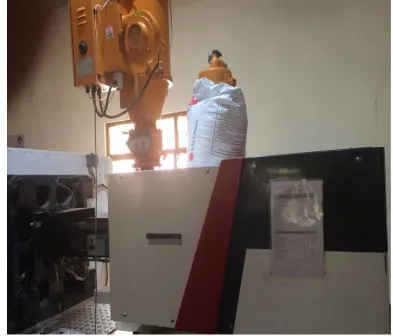
[image:2.595.99.492.176.512.2]The analysis was done on a plastic injection molding machine with fixed column and moving table as shown in figure 1 named as Electron-155 PIM. The raw material which is used in this research is thermoplastic which will be used to make top cover of food packaging box. This examination was conducted by using design of experiment (DOE) strategy named as Taguchi Method [8]. The essential execution measure in PIM is dimensional shrinkage which demonstrates the quality aspect of plastic product. [9].
Figure 1: PIM machine used for experimentation
Table 1: Process Parameters and their Levels
Factor Parameter Name Levels
I II III IV
A Mold Temperature 50 55 60 65
B Melt Temperature 205 210 215 220
C Injection Pressure 60 65 70 75
D Holding-Pressure 70 80 90 100
E Cooling time 20 25 30 35
Table 1 shows the process parameters and their levels. Total five process parameters and four levels are taken and accordingly orthogonal array has been made.
III.RESULTS AND DISCUSSION
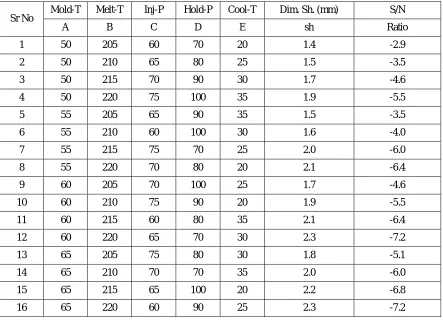
Table 2: Experimental result of Dimensional shrinkage
Sr No Mold-T Melt-T Inj-P Hold-P Cool-T Dim. Sh. (mm) S/N
A B C D E sh Ratio
1 50 205 60 70 20 1.4 -2.9
2 50 210 65 80 25 1.5 -3.5
3 50 215 70 90 30 1.7 -4.6
4 50 220 75 100 35 1.9 -5.5
5 55 205 65 90 35 1.5 -3.5
6 55 210 60 100 30 1.6 -4.0
7 55 215 75 70 25 2.0 -6.0
8 55 220 70 80 20 2.1 -6.4
9 60 205 70 100 25 1.7 -4.6
10 60 210 75 90 20 1.9 -5.5
11 60 215 60 80 35 2.1 -6.4
12 60 220 65 70 30 2.3 -7.2
13 65 205 75 80 30 1.8 -5.1
14 65 210 70 70 35 2.0 -6.0
15 65 215 65 100 20 2.2 -6.8
16 65 220 60 90 25 2.3 -7.2
In order to know the significance of process parameters on dimensional shrinkage on product, ANOVA analysis [10] was performed and it was observed that melt temperature was most significant factor and cooling time is least significant factor. The rank is assigned to the factors based on delta statistics. The value with highest delta is ranked highest and lowest delta with least rank.
Table 3: Response table for DS ( Raw data)
Level A B C D E
1 -4.157 -4.040 -5.171 -5.550 -5.448
2 -5.017 -4.800 -5.282 -5.379 -5.346
3 -5.966 -5.981 -5.421 -5.235 -5.258
4 -6.302 -6.622 -5.569 -5.279 -5.390
Delta 2.145 2.582 0.398 0.314 0.190
Rank 2 1 3 4 5
In figure 2 it is clear that factors which are ranked higher are having peak profile and factors which are having lower ranks are having low profiles. Our objective is to always have higher value of S/N ratio which can be achieved by the peak point of the factors in figure 2 which will give the optimal case for DS response as shown in table 4.
Table 4: Optimal case for DS response
A B C D E
Figure 2: S/N ratio analysis for DS
Table 5: Analysis of variance for dimensional shrinkage
Source DF Adj SS Adj MS
F-Value P-Value
Regression 5 1.22150 0.244300 85.72 0.000
A 1 0.48050 0.480500 168.60 0.000
B 1 0.72200 0.722000 253.33 0.000
C 1 0.00450 0.004500 1.58 0.237
D 1 0.01250 0.012500 4.39 0.063
E 1 0.00200 0.002000 0.70 0.422
Error 10 0.02850 0.002850
Total 15
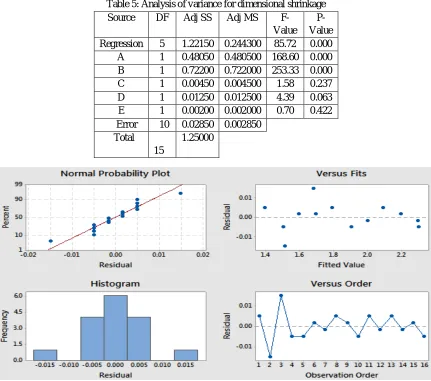
[image:4.595.82.513.349.730.2]Figure 3 shows the residual plots for dimensional shrinkage. In normal probability plot, residuals follow the straight line. Histogram is also symmetric in nature which indicates normal distribution of residuals. In residual versus fitted value, residuals are scattered randomly around zero which shows that they posses constant variance. There is no error due to time or data collection order as no clear pattern is exhibited by residuals.
A. Optimum Value of Dimensional Shrinkage
The optimum value of process parameters have been found as A1, B1, C1, D3, E3 to minimize the dimensional shrinkage which is given by equation
µds =A1+ B1+C1+D3+E3-4 T
Where, T = overall mean of dimensional shrinkage = (∑Ri)/16 = 1.875 mm
Where, values of R1 to R16 has been taken from the Table 2, and the values of A1,B1,C1,D3 &E3 has been taken from taguchi experimental data.
A1 =average value of dimensional shrinkage at first level of mold temperature = 1.625 mm B1= average value of dimensional shrinkage at first level of melt temperature= 1.6 mm C1= average value of dimensional shrinkage at first level of Injection pressure = 1.85mm D3= average value of dimensional shrinkage at third level of holding pressure = 1.85 mm E3= average value of dimensional shrinkage at third level of cooling time = 1.85mm
Substituting the values of various terms in the above equation, µds = 1.625 + 1.6+ 1.85+ 1.85+ 1.85- 4*1.875 = 1.275
The 95 % confidence intervals of confirmation experiments (CICE) and population (CIPOP) are calculated as below:
Where, Fα (1, fe) = The F ratio at the confidence level of (1-α) against DOF 1 and error degree of freedom fe.
= 16 / (1+3) = 4
N = Total number of results = 16,
R = Sample size for confirmation experiments = 1
Ve = Error variance = 0.0028; fe = error DOF = 10
(Table 5)
F0.05 (1, 10) = 4.97 (Tabulated F value ; Roy,1990)
(Tabulated F value (Ross, 1996))
CICE = ±0.1318, and CIPOP = ± 0.059
Therefore, the predicted confidence interval for confirmation experiments is: Mean µds - CICE < µds < Mean µds + CICE
i.e. 1.1432 < µds < 1.14068
The 95% confidence interval of the population is: Mean µds – CIPOP < µds < Mean µds + CIPOP i.e. 1.1216 < µds < 1.334
B. Confirmation Test
Confirmation test is very important in research which is designed by taguchi method. The objective of confirmation experiment is to know that how close theoretical value which is suggested by matrix experiment is to real data.
Table 6: Predicted optimal value and result of confirmation experiment
Response Parameter Optimal Set of Parameters Predicted Optimal Value
Predicted Confidence Intervals at 95% Confidence Level
Experiment al Value
Dimensional
Shrinkage A1B1C1D3E3 1.275
CIPOP: 1.1216<μds<1.334 CICE: 1.1432<μds<1.4068
1.2
As the result is tabulated in table 6. It is clear that optimal value predicted by matrix experiment using taguchi method is very close to experimental value.
IV.CONCLUSION
Influence of plastic injection molding machine process parameters on dimensional shrinkage was studied in this research. The process parameters included in this study are mold temperature, melt temperature, injection pressure, holding pressure and cooling time. Significant variables affecting the dimensional shrinkage were identified by ANOVA analysis. Result shows that most
significant variable affecting dimensional shrinkage is melt temperature and least significant variable is cooling time. A1 = 50, B1 =
205, C1= 60, D3 = 90 and E3 = 30 is the optimized value of machine process parameters for the present study.
REFERENCES
[1] Behrooz Farshi, Siavash Gheshmi and Elyar Miandoabchi, “Optimization of injection molding process parameters using sequential simplex algorithm”, Materials and Design 32, 414–423, 2011.
[2] Alireza Akbarzadeh and Mohammad Sadeghi, “Parameter Study in Plastic Injection Molding Process using Statistical Methods and IWO Algorithm”, International Journal of Modeling and Optimization, Vol. 1, No. 2,June 2011.
[3] A.O.Andrisano, F.Gherardini, F.Leali, M.Pellicciari and A.Vergnano, “Design of Simulation Experiments method for Injection Molding process optimization”, International conference on Innovative Methods in Product Design, Venice, Italy, June 2011.
[4] Mahmoud A. Barghash and Faisal Alkhannan Alkaabneh, “Shrinkage and Warpage Detailed Analysis and Optimization for the Injection Molding Process Using Multistage Experimental Design”, Quality Engineering, 26:319–334, 2014.
[5] E. Bociga and T. Jaruga, “Experimental investigation of polymer flow in injection mold”, Archives of Materials Science and Engineering, Volume 28 Issue 3 Pages 165-172, March 2007.
[6] Shen Changyu, Wang Lixia and Li Qian, “Optimization of injection molding process parameters using combination of artificial neural network and genetic algorithm method”, Journal of Materials Processing Technology 183, 412–418, 2007.
[7] Xuan-Phuong Dang, “General frameworks for optimization of plastic injection molding process parameters”, Simulation Modelling Practice and Theory 41, 15–27, 2014.
[8] Radhwan Hussin, Rozaimi Mohd Saad, Razaidi Hussin and Mohd Syedi Imran Mohd Dawi, “An Optimization of Plastic Injection Molding Parameters Using Taguchi Optimization Method”, Asian Transactions on Engineering (ATE ISSN: 2221-4267) Volume 02, Issue 05, 2014.
[9] M.C. Song, Z. Liu, M.J. Wang, T.M. Yu and D.Y. Zhao, “Research on effects of injection process parameters on the molding process for ultra-thin wall plastic parts”, Journal of Materials Processing Technology, 187–188 ,668–671, 2007.