Abstract— The world today is facing an extreme crude oil crisis. Petroleum products in the primary form are largely consumed for transportation and industrial purposes. This paper deals with the development of a system dynamics model to simulate the rise in fuel consumption in a district in India. The main aim of the paper is to study the influence of dynamic factors: Population, Fuel prices, Gross domestic product (GDP) growth, and Segment wise increase in fuel consumption. The model is used to simulate the fuel requirements for the two decades from 2011. The simulation results have aided the formulation of policies to check the rising fuel consumption, based on the projected figures. Although the input parameters are at the regional level, the influence of the before mentioned factors can be generalized to the global level.
Index Terms— Fuel consumption, system dynamics, fuel crisis, modeling and simulation.
I. INTRODUCTION
Fuel crisis is one of the major crises to be managed in the years to come. History has witnessed its first major oil crisis in 1973, which was caused by major Arab oil producing states in response to western support of Israel during the Yom Kippur war. This was followed by the crisis caused by the Iranian war during 1979. The 1990 witnessed the price shock caused by the Gulf war [1].
While the study of alternative fuels is emerging as one stream of interest as a part of crisis management, scenario planning for the consumption of petroleum based fuels is a continuous endeavour as a separate stream. The two major consumers of petroleum based fuels are electricity plants and transport vehicles. It has been found that the supply of fuel is much lesser than the demand for it due to several factors the major being increase in global population. Hence, the general prediction is that the increase in the demand may finally result in a crisis leading to an emergency, which needs to be prevented through proper planning well in advance.
The research methodology adopted in this paper goes in accordance to the principles of system dynamics methodology [2]. This includes Problem identification, System conceptualization, Model formulation, Simulation
Manuscript received May 10, 2011; revised May 18, 2011. Vehicle Fuel Consumption Modelling: A System Dynamics Approach.
Prof. Dr. Lewlyn L. R. Rodrigues is HOD of Department of Humanities and Social Sciences, Manipal Institute of Technology, Manipal 576104, Karnataka, India (Ph: +91-820-2924033; Fax: 091-820-2571071; [email protected]).
Kalpit Gupta is a final year graduation student in the Department of Mechanical and Manufacturing Engineering, Manipal Institute of
Technology, Manipal 576104, Karnataka, India
Farahnaz Golrooy Motlagh, has a Masters in Computer Engineering from Near East University, Nicosia Europe, Cyprus. She has Diploma in Management Administration. Currently she is preparing for her Ph.D. registration in Dubai. ([email protected]).
and validation and Policy analysis and improvement [3]. The causal loop provides the base for the formulation of the model. The modelling and simulation are performed using VENSIM PLE® software. It is important to note that in a system dynamics research, the trend that is studied is more important than the accuracy of values of input parameters.
II. LITERATURE REVIEW
Using system archetypes as the basis for modelling and simulation of the dynamics of alternative fuels is a very useful approach in scenario planning [4]. This stream of study focuses on the future car market share scenario planning, but does not address the issue of increase in fuel consumption.
System dynamics based simulation in the context of alternative fuel technology has been used widely with an approach to change the technology to meet the fuel crisis [5], [6] & [7]. Even though this approach addresses to some extent the exploitation of technology to reduce the fuel consumption it does not make predictions of future fuel consumption.
Hence, to fill the gap in the existing literature, this research focuses on the modeling and simulation of future fuel consumption and the analysis of possible consequences.
III. INDIAN AUTOMOBILE AND OIL SECTOR SCENARIO
Post liberalization of the Indian economy, the automobile industry has witnessed a rapid growth in volumes and capacity which has opportunity as well as challenges [8]. Seventeen new ventures have come up in the past decade which includes global giants such as Ford, General motors, Toyota, Fiat, and Hyundai. The industry comprises of commercial vehicles, multi-utility vehicles, two wheelers, three wheelers and auto components. In terms of volume two wheelers dominate the market with nearly 80% share, followed by four wheelers with 13% and commercial vehicles with 7 % of the share [9].
India imports around 70% of its crude oil from the countries like Saudi Arabia, Iran, Iraq, Nigeria, Kuwait, UAE, Malaysia, and Yemen. The Indian refinery capacity is poised to increase by 58% to 235 million tonnes in the next 5 years, and the imports are likely to increase to 85% by 2012 [10].
IV. CONSTRUCTION OF MODEL
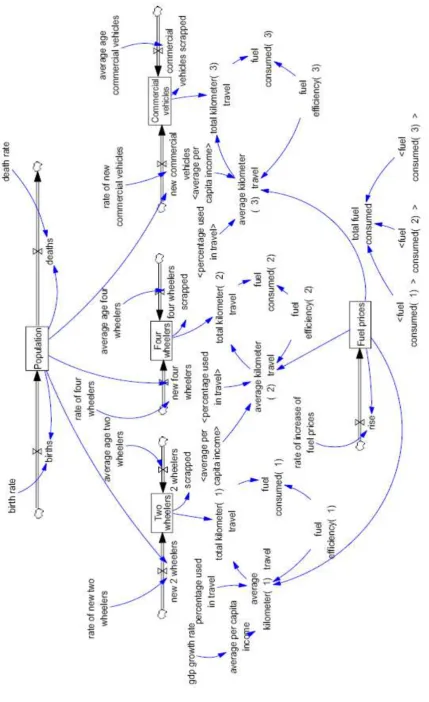
The Stock and flow diagram indicates the causal relationship between all the exogenous and endogenous variables considered in this study (Fig. 1). The model is based on the data collected in Udupi District of Karnataka State in India. The population increase is considered as a rate of increase/year, based on the data obtained from municipality.
Vehicle Fuel Consumption Modelling: A
System Dynamics Approach
F
ig.
1
.
S
toc
k
a
n
d
F
low
di
a
gra
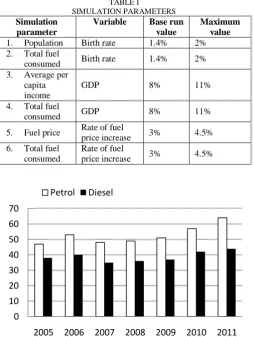
[image:2.595.70.500.56.759.2]Fuels used are petroleum and diesel, and hence, an average price is taken year wise, based on the price fluctuation during the past seven years (Fig. 2). A steady GDP growth of 8% is considered based on the data for the past six years. The automobile segment consists of two wheelers, four wheelers, and commercial vehicles. Hence, the segment wise consumption of fuel is taken for simulation. The distance travelled under each segment is calculated based on the amount spent on fuel year wise. Average mileage of the group of vehicles has been considered for each segment [11]. Also the average lifespan of two wheelers, four wheelers and commercial vehicles is assumed to be 20, 15 and 15 years respectively based on the existing data in the regional transport office. The base run values and the maximum values of simulation are shown in the table 1. The governing equations used in the model have been listed in Appendix I.
TABLE I
SIMULATION PARAMETERS
Simulation parameter
Variable Base run value
Maximum value 1. Population Birth rate 1.4% 2% 2. Total fuel
consumed Birth rate 1.4% 2% 3. Average per
capita income
GDP 8% 11%
4. Total fuel
consumed GDP 8% 11%
5. Fuel price Rate of fuel
price increase 3% 4.5% 6. Total fuel
consumed
Rate of fuel
price increase 3% 4.5%
Fig. 2. Fuel price fluctuation in INR (≈ 0.014 £) since past seven years
The entry rate of new Two wheelers, Four wheelers and Commercial vehicles is taken based on the average of the vehicles registered each year in the regional transport office.
V. RESULTS AND ANALYSIS
Simulation has been performed for a period of 26 years (2005 to 2030). The population growth and the total fuel consumed are shown in Fig. 3 & 4. It can be observed that for the given rate of increase in population, an exponential growth of fuel consumption is observed.
Fig. 3. Population growth for varying birth rate
Figure 4. Fuel consumed for varying birth rate
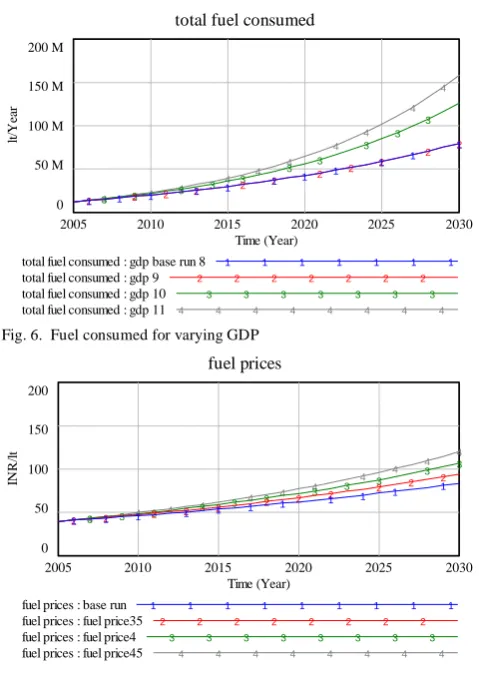
Fig. 5 depicts that the variation in average per capita income for a given variation in GDP. With the increase in the rate of GDP an exponential increase can be observed in the per capita income. Further, the increase in GDP also increases the total fuel consumption (Fig. 6). Starting at a current rate of about 20 Ml/year, by the year 2030 the total fuel consumption crosses 150 Ml/ year. Moreover, it is very clear that a small increase in GDP (8 to 9%) will not have a significant increase in fuel consumption, but if it increases at a higher rate (10 to 11%), a significant increase in fuel consumption can be observed. By the year 2030 the total fuel consumption may increase to 160 Ml/year from the current rate of about 25Ml/year. As India is the second largest growing economy in the world, the increase in GDP will substantially contribute to the total increase in fuel consumption.
Fig. 7 shows the increase in fuel price based on different rates of increase of fuel price over a period of time. It is clear that on a longer run even a small increase in the rate of fuel price causes a significant rise in fuel price.
For a given increase in the rate of fuel price from the total current fuel consumption of about 20 Ml/year (Fig. 8), the consumption increases to about 80 Ml/year by 2030. Moreover, currently the difference in increase rate of fuel prices may not have a significant influence on fuel consumption, but over a period of time even a small difference in increase rate of fuel price will contribute to a significant amount of decrease in fuel consumption.
0 10 20 30 40 50 60 70
2005 2006 2007 2008 2009 2010 2011
Petrol Diesel
Population
800,000
700,000
600,000
500,000
400,000
4 4
4 4
4 4
4 4
4 4
3 3 3
3 3 3
3 3
3 3
2 2 2
2 2 2 2
2 2 2
1 1 1 1 1 1 1 1 1 1 1
2005 2010 2015 2020 2025 2030
Time (Year)
pe
opl
e
Population : birth rate base run 1 1 1 1 1 1 1 1
Population : birth rate 16 2 2 2 2 2 2 2 2
Population : birth rate 18 3 3 3 3 3 3 3 3
Population : birth rate 20 4 4 4 4 4 4 4 4
total fuel consumed
100 M
75 M
50 M
25 M
0
4 4
4
4 4
4 4
4 4
4
3 3
3 3 3
3 3
3 3
3
2 2
2 2
2 2
2 2
2 2
2
1 1
1
1 1
1 1
1 1
1 1
2005 2010 2015 2020 2025 2030
Time (Year)
lt
/Y
ea
r
total fuel consumed : birth rate base run 1 1 1 1 1 1
total fuel consumed : birth rate 16 2 2 2 2 2 2
total fuel consumed : birth rate 18 3 3 3 3 3 3 3
[image:3.595.311.549.243.413.2] [image:3.595.44.299.260.598.2]Fig. 5. Average per capita income for varying GDP
Fig. 6. Fuel consumed for varying GDP
[image:4.595.50.285.616.771.2]Fig. 7. Fuel price for various rates of increase in fuel price
Fig. 8. Fuel consumed for with varying fuel prices
VI. CONCLUSIONS AND IMPLICATIONS
1. At the current rate of increase in population, petroleum based fuel consumption is going to be exponentially increased over the next two decades in direct proportion to the increase in GDP, despite the increase in its price.
2. A small increase in the GDP may not have a drastic increase in fuel consumption but a higher rate of increase in GDP, say 10 to 11%, the fuel consumption is sure to increase significantly.
3. Rate of increase in fuel price will decrease the fuel consumption. Even a small increase in rate of increase of fuel price, say 1.5% may result in a decrease of about 25 Ml/year of fuel consumption.
In response to the above points following measures may be considered for better fuel crisis management:
1. Promote fuel efficient vehicles in a larger scale. 2. Consider the use of alternative fuels such as bio-fuels
and hydrogen.
3. Enhance the engine technology and consider the use of hybrid vehicles.
4. Use innovative approaches in engine management systems with fuel economy in the focus.
5. Educate the drivers on running the vehicles at the most fuel economic speeds.
6. Devise better transport systems with minimum waiting time for vehicles and directed shortest route maps through geographical positioning systems.
7. Encourage the use of public transport systems. 8. Promote go-green projects on a larger scale.
As „prepare and prevent is better than repent and repair‟, measures in a systematic manner to educate people for the most efficient use of their vehicles is worth a consideration. Even though this research has a regional perspective, as the study is based in a small district in India, the concept can be extended easily to national or international levels. The results can be generalized to a significant extent as the simulation parameters are based on real life data in a growing economy.
The system dynamics model developed in this research gives immense scope for future researchers to delve into the intricacies and criticality of influencing factors on fuel consumption to extend the model to the next level. One immediate consideration in this direction could be the inclusion of the influence of renewable energy usage and the influence of innovative technologies.
APPENDIX
The governing equations and parameters for the simulation: 1. "2 wheelers scrapped"=
Two wheelers/average age two wheelers Units: vehicle/Year
2. average age commercial vehicles=15 Units: Year
3. average age four wheelers=15 Units: Year
4. average age two wheelers=20 Units: Year
average per capita income
400,000
300,000
200,000
100,000
0 4 4 4 4 4
4 4
4 4
4
3 3 3 3
3 3
3 3 3
3
2 2 2 2
2 2
2 2
2 2
1 1 1 1
1 1 1 1 1 1 1
2005 2010 2015 2020 2025 2030
Time (Year) IN R /Y ea r
average per capita income : gdp 3 1 1 1 1 1 1 1
average per capita income : gdp 2 2 2 2 2 2 2
average per capita income : gdp 1 3 3 3 3 3 3 3
average per capita income : base run 4 4 4 4 4 4
total fuel consumed
200 M 150 M 100 M 50 M 0 4 4 4 4 4 4 4 4 4 4
3 3 3
3 3
3 3 3
3 3
2 2 2
2 2 2
2 2
2
2 2
1 1 1 1 1
1 1
1 1
1 1
2005 2010 2015 2020 2025 2030
Time (Year)
lt
/Y
ea
r
total fuel consumed : gdp base run 8 1 1 1 1 1 1 1
total fuel consumed : gdp 9 2 2 2 2 2 2 2
total fuel consumed : gdp 10 3 3 3 3 3 3 3
total fuel consumed : gdp 11 4 4 4 4 4 4 4 4
fuel prices 200 150 100 50 0
4 4 4
4 4
4 4
4 4
4 4
3 3 3 3
3 3
3 3
3 3
3
2 2 2 2
2 2 2
2 2
2 2
1 1 1 1 1 1
1 1 1
1 1
2005 2010 2015 2020 2025 2030
Time (Year)
IN
R
/l
t
fuel prices : base run 1 1 1 1 1 1 1 1 1
fuel prices : fuel price35 2 2 2 2 2 2 2 2
fuel prices : fuel price4 3 3 3 3 3 3 3 3
fuel prices : fuel price45 4 4 4 4 4 4 4 4
total fuel consumed
80 M 60 M 40 M 20 M 0 4 4 4 4 4 4 4 4 4 4 3 3 3 3 3 3 3 3 3 3 3 2 2 2 2 2 2 2 2 2 2 2 1 1 1 1 1 1 1 1 1 1 1
2005 2010 2015 2020 2025 2030
Time (Year)
lt
/Y
ea
r
total fuel consumed : base run 1 1 1 1 1 1 1 1
total fuel consumed : fuel price35 2 2 2 2 2 2
total fuel consumed : fuel price4 3 3 3 3 3 3 3
5. "average kilometer (2) travel"=
(average per capita income*percentage used in travel*"fuel efficiency(2)" )
/fuel prices
Units: km/(Year*vehicle)
6. "average kilometer (3) travel"=(average per capita income*percentage used in travel*"fuel
efficiency(3)") /fuel prices
Units: km/(Year*vehicle)
7. "average kilometer(1) travel"=
(average per capita income*percentage used in travel*"fuel efficiency(1)")
/fuel prices
Units: km/(Year*vehicle)
8. average per capita income= INTEG ( average per capita income*GDP growth rate,21950)
Units: INR/Year
9. birth rate=0.014 Units: 1/Year
10. births=Population*birth rate Units: people/Year
11. Commercial vehicles= INTEG (
(new commercial vehicles)-(commercial vehicles scrapped),30000)
Units: vehicle
12. commercial vehicles scrapped=
Commercial vehicles/average age commercial vehicles
Units: vehicle/Year
13. death rate=0.01 Units: 1/Year
14. deaths=Population*death rate Units: people/Year
15. FINAL TIME = 2030 Units: Year
The final time for the simulation. 16. four wheelers scrapped=
Four wheelers/average age four wheelers Units: vehicle/Year
17. Four wheelers= INTEG (
(new four wheelers)-(four wheeler s scrapped),12670)
Units: vehicle
18. "fuel consumed(1)"=
"total kilometer(1) travel"/"fuel efficiency(1)" Units: lt/Year
19. "fuel consumed(2)"=
"total kilometer(2) travel"/"fuel efficiency(2)"
Units: lt/Year
20. "fuel consumed(3)"=
"total kilometer(3) travel"/"fuel efficiency(3)" Units: lt/Year
21. "fuel efficiency(1)"=46 Units: km/lt
22. "fuel efficiency(2)"=12 Units: km/lt
23. "fuel efficiency(3)"=9 Units: km/lt
24. fuel prices= INTEG (rise,40) Units: INR/lt
25. gdp growth rate=0.08 Units: 1/Year 26. new 2 wheelers=
Population*rate of new two wheelers Units: vehicle/Year
27. new commercial vehicles=
Population*rate of new commercial vehicles Units: vehicle/Year
28. new four wheelers=
Population*rate of new four wheelers Units: vehicle/Year
29. percentage used in travel=0.2 Units: 1/vehicle
30. Population= INTEG (births-deaths, 540432)
Units: people
31. rate of increase of fuel prices=0.03 Units: 1/Year
32. rate of new commercial vehicles=0.006 Units: vehicle/(people*Year)
33. rate of new four wheelers=0.0028 Units: vehicle/(people*Year)
34. rate of new two wheelers=0.016 Units: vehicle/(people*Year)
35. rise= rate of increase of fuel prices*fuel prices Units: INR/(Year*lt)
36. total fuel consumed=
"fuel consumed(1)"+"fuel consumed(2)"+"fuel consumed(3)"
Units: lt/Year
37. "total kilometer(1) travel"=
38. "total kilometer(2) travel"=
"average kilometer (2) travel"*Four wheelers Units: km/Year
39. "total kilometer(3) travel"=
Commercial vehicles*"average kilometer (3) travel"
Units: km/Year
40. Two wheelers= INTEG (
(new 2 wheelers)-("2 wheelers scrapped"), 71264)
Units: vehicle
ACKNOWLEDGMENT
The authors thank Manipal University for permitting this research as a part of the academic project work. We wish to place on record the assistance provided by The Regional Transport Officer and the Municipal Council of Udupi, Karnataka State, India. The data provided by these government offices has been of immense use to this research.
REFERENCES
[1] Wikipedia, http://en.wikipedia.org/wiki/Energy_crisis last accessed 5th April, 2011.
[2] J.W. Forrestor , “System Dynamics, Systems thinking and soft OR”, System Dynamics review,1994, vol 10, no. 2-3, pp. 245-256.
[3] Sushil, System Dynamics: A Practical approach for
Managerial Problems, Wiley Eastern publication, New Delhi,
India, 1993.
[4] Wolstenhome, “Towards the definition and use of a core set of archetypal structures in system dynamics”, System Dynamics Review, 2003, Vol. 20, No.: pp. 341-356.
[5] A.E. Farrel, D.W. Keith, and J.J. Corbett, “A strategy to introduce hydrogen into transportation”, Energy Policy, 31, 2003, pp. 1357-1367.
[6] R. Kemp, J. Schot and R. Hoogma, “Regime shift to sustainability through process of niche formation: The approach of strategic niche management”, Technology analysis and strategic management, 10, 1998, pp. 175-196.
[7] J.J. Winebrake, “The AFV credit program and its role in future AFV market development”, Transportation Research, Part D 2, 1997, pp. 125-132.
[8] V. Krishnan, V. „Indian Automotive Industry: Opportunities
and Challenges Posed By Recent Developments‟ The
International Motor Vehicle Program at MIT, 1996, pp.1-2.
[9] H. Jaipuriar, L.L.R. Rodrigues, B. Gopal Krishna, “Future of Indian Automobile Industry: A System Dynamic Approach, Conference proceedings”, Proceedings of II UKSim European Symposium on Computer Modelling and Simulation, 2008, pp. 323-328.
[10] Armen Hareyan (2007, August 16), India‟s dependence on oil imports,Available: http://www.huliq.com, Last accessed on 2nd April, 2011.