Abstract— In this oligopolistic electricity market, the maximization of profit for generators is mainly dealt with the used bidding strategies. For selling of electricity with maximum profit power companies required suitable bidding models that includes power operating constraints and price uncertainty within the market. In this paper, we present particle swarm optimization (PSO) algorithms to determine bid prices and quantities under the rules of a competitive power market with using emission as a constraint. The Objective of this paper is the potential impacts of emissions trading on power industries and electricity markets. Increasing environmental issues and regulations have forced Generation companies (GENCOs) to review the policies being used for long term planning. Constraints on CO2 emission are restricted the GENCOs to adopt the green technologies.
Index Terms— Bidding, Electricity market, PSO, Carbon
Emission
I. INTRODUCTION
very corner of the world continues to be opened to competitive forces for electricity market. Introducing competition to these markets is to make them more efficient. The electricity industry throughout the world, which has long been dominated by vertically integrated utilities, is undergoing enormous restructuring processes. For Gencos, maximization of their individual profit requires an optimal bidding strategy decision of an individual supplier. Electricity is evolving into a distributed commodity in which market forces are bound to drive the price of it and reduce the net cost through increased competition. The key factors which affect the bidding strategy decision are the variation in demands: production cost of generator, operating constraints or regulatory constraints, other opponent’s bidding behavior etc. The opponent’s bidding strategy behavior and grid power demand, at any time are the most uncertainty factor that compounds the difficulties in bidding strategy decision process, where each participant tries to maximize their own profit [1]. An overall strategy in a day-ahead market was proposed using two different bidding schemes [2].
In Strategic bidding problem generators try to maximize their profit, based on the market clearing price (MCP) or bid price and the demand is obtained from an optimal power flow model, such problems has been categorized as bi-level optimization problem [3].
Manuscript received January 8, 2012; revised January 22, 2012.
Kaustubh Dwivedi ([email protected]), Yogendra Kumar ([email protected]) and Ganga Agnihotri ([email protected]) are with the Electrical Engineering Department, Maulana Azad National Institute of Technology Bhopal, (M.P.) India.
There are various conventional [4]-[7] and non-conventional (heuristic) [8]-[13] methods to solve the optimal strategic bidding problem. The deterministic approaches are not able to obtain the global solution of such two level optimization problem due to the non-convex and non-differentiable objective functions and their non-linear constraints of bidding models. In Heuristic approaches such as genetic algorithm (GA), evolutionary programming (EP), Fuzzy, Simulated Annealing (SA) particle swarm optimization (PSO) and combination of these approaches are used to obtain a global solution for strategic bidding problems. These heuristics approaches are commonly restricted by their receptivity to the choice of parameters, such as the crossover and mutation probabilities in GA, temperature in SA, scaling factor in EP and inertia weight and learning factors in PSO.
Particle swarm optimization (PSO) is a population based stochastic optimization technique with random initialization. In PSO only characteristics (i.e. position and velocity) of the particle is changed and in other approaches, as like in EP, the individuals in population change, with new individuals being ‘generated’ in each iteration. PSO generates much better quality solution, within less calculation time & stable convergence characteristic than other heuristic approaches such as GA, EP, SA & other combination of these[14].
In the monetary evaluation of power plants, the price of emissions is one of the decisive factors. Authors investigate an influence of emission constraints on generation scheduling & solving the new profit-based UC problem with carbon trading [15-20]. Hence it is essential to investigate the resulting market price for emissions.
Given this background, it is the objective of this paper to propose an alternative framework within which bidding strategies for competitive suppliers can be developed, in addition, the CO2 emissions within the restrictions for the unit commitment. It is assumed that the suppliers have the freedom to price away from their marginal production costs, and they submit linear bid functions and are paid the market clearing price once their bids are selected. The problem is formulated as a stochastic optimization procedure and swarm intelligence technique is applied to search the optimal solution.
The remaining paper is organized as follows: in section II describes the model & formulation of strategic bidding problem. Section III gives the brief description of the classical particle swarm optimization. Section IV analyzes the linear bid curve for generators with constant & linear variation in demand. The conclusions are given in Section V.
Competitive Bidding in Electricity Markets
with Carbon Emission by Using Particle Swarm
Optimization
K.Dwivedi, Y. Kumar, G. Agnihotri
II. PROBLEM FORMULATION
In this paper, linear bid model of electricity market have been considered. In that a supplier submits a bid curve which is a function of quantity in terms of market price (p). For any bidder ‘b’, a supply bid curve can be represented as
⁄ , where mb is the slope of supply bid curve and qb (p) is the output power at price ‘p’. One-part price-bid[16] format is considered, in which generators bid only independent prices for each hour, and a simple market clearing process based on the intersection of supply and demand bid curves is used to determine the winning bids. System demand considered in a trading period is assumed to be insensitive to change in price. It is assumed that the bidders are having the information about system demand, number of bidders and network configuration.
Assume that there are ‘n’ no of independent generators to sell their power outputs in an electricity market, suppose all (n-1) independent generators (opponents) are integrated into a single entity.
Suppose the linear supply bid curve for generator ‘G’ is expressed as
(1) Where mG is the slope of supply curve within the limits of
min max
[
m
G,
m
G].
the cumulative supply curve of opponents is(2) Where, ‘mO’ is the slope of cumulative supply curve of opponents in the range
min max
[
m
O,
m
O]
.The augmented supply curve, as shown in fig.1, of all the generators will be
∗ ∗ (3) On the basis of proportionate sharing rule, the individual supply quantity can be defined as qG & qO respectively
∗ (4)
∗ (5) Here ‘Q’ is the total supply quantity by the ‘n’ independent generators. The objective function and constraints for maximizing the benefit can be expressed as:
∗ ∗ (6)
s.t.
∈ ∗
0 0
(7)
Where c (qG) is the production cost function of generator ‘G’ & defined as:
(8) ao, a1, a2 are no-load, linear, and quadratic cost coefficients of the generator’s cost function, in eqn (7)
2 CO G
A
,
is the yearly CO2 allowance,( )
q
G
, is the emission cost function, expressed as∈
∗
(9)2 CO G
, is defined as emission coefficient andformulated as [22]:
∈
∗∗ (10)
,
is the fuel unit price;T
, is the thermodynamic efficiency of the plant; LHVfuel is the fuel lower heating value [Mcal/kg].III. PARTICLE SWARM OPTIMIZATION
The PSO method introduced by Kennedy and Eberhart [13] is originally intent to graphically simulate the graceful but unpredictable choreography of a bird flock & fish schooling. In PSO the system is initialized with a population of random solutions. PSO is a group of particles that are able to optimize a certain fitness function. Each Particle knows its best value (Pbest) and location at any given time. Each particle always refers to the best value (Gbest) and its location in the group. The updated velocity of each particle for the next step can be calculated using its current velocity and distance from Pbest & Gbest. The terms which are used in the PSO technique are particle, population, velocity, inertia weight, individual best, global, learning coefficients and stopping criteria best. The equations for the updating of particle are discussed below:
1
1 1
2 2
*(
)
*(
)
k k k k k
r r best r r
k k
best r
V
V
c rand
P
X
c rand
G
X
(11)(12)
(13) Equation (11) calculates a new velocity for each particle r, based on previous velocity k
r
V
. The learning factors c1 & c2 are the acceleration constants in “(11)” calculates a new velocity for each particle r, based on previous velocity kr
experiences, c1 and c2 were often set to 2.0 and ‘ ’often decreases linearly from approximately 0.9 to 0.4 during a run, ‘k’ is the iteration counter & kmax is maximum iteration no. in “(13)”.
(A)PSO Algorithm for bidding problem
For the bidding problem position of each particle ‘r’ of generator ‘G’ is represented by the slope of the supply curve ‘ . The fitness function for each particle is the benefit of generator ‘G’ in “(6)”. The PSO algorithm, for the bidding- search process, is as follows:
Step 1: Define input parameters with all constraints for the swarm.
Step 2: Initialize the position ‘ ’for all particles randomly with satisfying all the constraints.
Step 3: Find supply quantity of Generator ‘G’ for randomly generated position ‘ ’ using “(4)”.
Step 4: Calculate the fitness value (benefit) of each particle in the swarm using fitness function “(6)”.
Step 5: Compare the fitness value of each particle found in step 4 with Pbest of each particle. Update Pbest of a particle if its fitness is greater than its Pbest.
Step 6: Update Gbest if any particle has greater fitness than fitness of current Gbest.
Step 7: Update the inertia weight ‘ω’ by using “(13)”. Step 8: Modify the velocity of each particle by “(11)”. Step 9: Modify the position of each particle by using “(12)” with the updated velocity in step 8.
Step 10: Check iteration counter, if it reaches its maximum then go to step 11, else go to step 3.
Step 11: The swarm that generates the latest Gbest in step 6 is the optimal value.
IV. CASE STUDIES
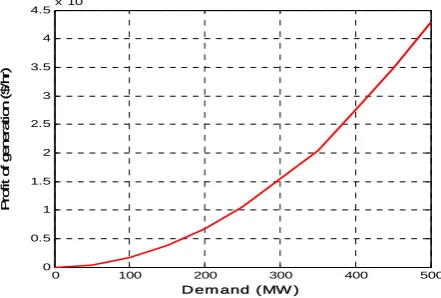
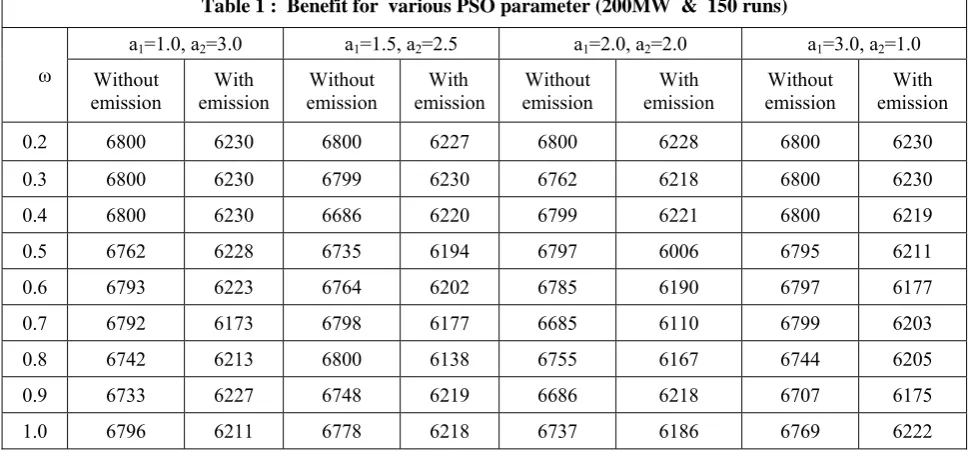
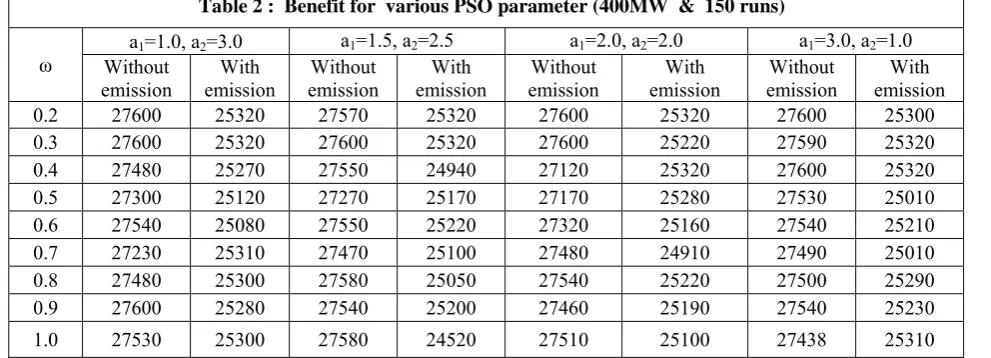
Let Generator ‘G’ for which the linear bid curve is taken as ⁄ with the minimum & maximum Limits on slope of offer curve as ‘0.3≤ mG ≤0.9’. The generation cost coefficients used in “(8)” are taken as a0=0, a1=2, a2=0.1. The output power of generator ‘G’ are within the limit of 0≤ qG ≤500. Table 1 and 2 shows the variation in benefit of generator ‘G’ with & without consideration of emission coefficient. Parameters are tested for 50 particles with 150 no of iterations with linear variations in inertia weight with different combinations of acceleration coefficient. Fig. 2 & 4 shows that how the benefit of generator ‘G’ increases. It is varying as quadratic in nature for both the cases because the benefit function is quadratic function of output power of generator ‘G’. The absolute value of generator ‘G’ is higher when the emission coefficient is not being considered .Fig. 3 & 5 shows that variation of optimal slope for both cases, bid curve offered by generator ‘G’ to gain maximum benefit with demand variation from 50MW t0 500 MW. It depicts that gain at the demand of 50 MW of generator ‘G’ abruptly increases & become s stable. The profit of generator ‘G’ is not proportional to the optimal slope because if the slope increases, profit as well as the demand met by generator ‘S’ decreases. So the optimal value is being stable nearby some value. The optimal slope for both the cases is near about same & as the system demand crosses 200 MW, optimal slope is being stabilized. Fig. 6-9 depicts that the PSO is
[image:3.595.309.530.81.230.2]converge for profit & optimum slope for both cases around 10-20 iterations.
Fig. 2 Benefit curve of generator G without Emission
0 100 200 300 400 500
0 0.2 0.4 0.6 0.8 1
D e m a n d ( MWH )
O
p
ti
m
a
l s
lope (
$
/h
r)
Fig. 3 Optimum slope of bid curve of generator ‘S’ without Emission
0 100 200 300 400 500
0 0.5 1 1.5 2 2.5 3 3.5
4x 10
4
Dem and (MW H)
Pr
o
fi
t of
gener
at
ion(
$/
h
[image:3.595.313.543.580.734.2]r)
Fig.4 Benefit curve of generator G with Emission
0 100 200 300 400 500
0 0.1 0.2 0.3 0.4 0.5 0.6 0.7 0.8 0.9 1
D em and ( MW H)
O
p
ti
m
a
l s
lope (
$
/h
r)
Fig.5 Optimum slope of bid curve of generator ‘S’ with Emission
0 100 200 300 400 500
0 0.5 1 1.5 2 2.5 3 3.5 4 4.5x 10
4
D em and ( MW )
P
ro
fi
t of
gener
at
ion (
$
/h
Fig. 6 Net profit after convergence without Emission
0 50 100 150
0.8975 0.898 0.8985 0.899 0.8995 0.9
No of iterations
c
o
ll
e
c
ti
oPr
o
fi
t of
Gener
at
or
'
S
'
($
/h
r)
[image:4.595.318.542.57.212.2]Fig. 7 Net Slope after convergence without Emission
[image:4.595.320.540.234.395.2]Fig. 8 Net profit after convergence with Emission
Fig. 9 Net slope after convergence with Emission
0 50 100 150
4.3235 4.324 4.3245 4.325 4.3255x 10
4
No of iter ations
P
ro
fi
t of
ge
ner
a
to
r '
S
'(
$/
hr
)
0 50 100 150
3.8265 3.827 3.8275 3.828 3.8285 3.829 3.8295
3.83x 10
4
No of iterations
P
rof
it
of
G
ener
at
or
S
($/
hr
)
0 50 100 150
0.85 0.86 0.87 0.88 0.89 0.9
No of iterations
O
p
ti
m
u
m
s
lo
pe(
$/
h
r)
Table 1 : Benefit for various PSO parameter (200MW & 150 runs)
ω
a1=1.0, a2=3.0 a1=1.5, a2=2.5 a1=2.0, a2=2.0 a1=3.0, a2=1.0 Without
[image:4.595.49.270.242.397.2] [image:4.595.40.526.485.713.2]V. Conclusion
In this Paper, the work is mainly concerned with the development of a mathematical model for generation planning including investment, different cost components & existing regulatory requirements such as emission. For Competitive electricity market, The PSO has been applied for strategic bidding of an electricity supplier with the consideration of carbon emission. A linear bidding model has been postulated with the inclusion of the imperfect bidding behavior of the rival’s. In this Paper PSO gives the global optimum solution for this continuous type of Mathematical model. The PSO has works efficiently for getting bidding price of single generator ‘G’ and has ability to control the convergence. To get an optimal solution PSO parameters are found. The results show that profit is less with emission consideration so when the cost of carbon is accounted for, the situation will become worse and the price is much greater than only coverage of costs would require, but the concern over an imperfect electricity market paired with emissions trading is justified.
References
[1] F. Wen and A. K. David, “Optimal bidding strategies and modeling of imperfect information among competitive generators,” IEEE Transaction Power Systems, vol. 16, no. 1, pp. 15–21, Feb. 2001. [2] F. S.Wen and A. K. David, “Strategic bidding for electricity supply in
a day-ahead energy market,” Electrical Power System Research 59 (2001) 197–206.
[3] Weber J. D., Overbye T. J.: ‘A Two-Level optimization problem for analysis of market bidding strategies’ IEEE Power Engineering society summer meeting,1999,vol 2, pp: 682 – 687.
[4] Fushuan Wen, A. Kumar David, “Optimal Bidding Strategies and Modeling of Imperfect Information Among Competitive Generators ” IEEE transactions on power systems, vol. 16, no. 1, February 2001
[5] F.S. Wen, A.K. David, “Optimally co-ordinated bidding strategies in energy and ancillary service markets” IET Generation. Transmission. Distribution, Vol. 149, No. 3, May 2002
[6] Ashkan R. Kian, Jose B. Cruz, Jr., Robert J. Thomas, “Bidding Strategies in Oligopolistic Dynamic Electricity Double-Sided Auctions” IEEE transactions on power systems, vol. 20, no. 1, February 2005.
[7] You Seok Son, Ross Baldick, Shams Siddiqi, “Reanalysis of “Nash Equilibrium Bidding Strategies in a Bilateral Electricity Market”, IEEE transactions on power systems, vol. 19, no. 2, may 2004. [8] Charles W. Richter, Jr. Gerald B. Sheble , “ Genetic Algorithm
evolution of utility bidding strategies for the competitors market place”, IEEE Transactions on Power Systems, Vol. 13, No. 1, February 1998
[9] Charles W. Richter, Jr., Gerald B. Sheblé,, “A Profit-Based Unit Commitment GA for the Competitive Environment”, IEEE transactions on power systems, vol. 15, no. 2, may 2000.
[10] Man Leung Wong, Kwong Sak Leung, “An Efficient Data Mining Method for Learning Bayesian Networks Using an Evolutionary Algorithm-Based Hybrid Approach”, IEEE transactions on evolutionary computation, vol. 8, no. 4, august 2004.
[11] B. Venkatesh, T. Jamtsho, H.B. Gooi, “Unit commitment – a fuzzy mixed integer Linear Programming solution”, IET Generation. Transmission. Distribution , 2007, 1, (5), pp. 836 –846.
[12] Simopoulos, D.N., Kavatza, S.D., Vournas, C.D.: “Unit Commitment by an Enhanced simulated annealing algorithm”, IEEE Transaction on Power Systems, 2006, 21(1), pp.68-76.
[13] Kennedy, J., and Eberhart, R.: ‘Particle swarm optimization’. Proceedings IEEE Int. Conf. Neural Networks, 1995, vol. 4, pp. 1942–1948
[14] P. Bajpai, S.K. Punna, S.N. Singh, “Swarm intelligence-based strategic bidding in competitive electricity markets” strategies’ IET Generation. Transmission. Distribution, 2008, 2, (2), pp. 175-184. [15] Bajpai, P.; Singh, S.N, “Fuzzy Adaptive Particle Swarm Optimization
for Bidding Strategy in Uniform Price Spot Market”Power Systems, IEEE Transactions Vol: 22 , Issue: 4,2007, pp: 2152 - 2160
[16] Kockar, I, “Unit commitment for combined pool/bilateral markets with emissions trading”, Power and Energy Society General Meeting - Conversion and Delivery of Electrical Energy in the 21st Century,2008 IEEE 20-24 July 2008, pp. 1 – 9.
[17] T. Gjengedal, “Emission Constrained Unit Commitment (ECUC)”, IEEE Transactions on Energy Conversion, vol. 11, no. 1, March 1996, pp. 132-138
[18] Kockar, A.J.Conejo and J.R. McDonald, “Influence of the Emissions Trading Scheme on Market Clearing”, Submitted to Power System Computation Conference (PSCC) 2008.
[19] C. Genesi, G.P. Granelli, P. Marannino, M. Montagna, S. Rossi, I. Siviero, L. Desiata, G. Gentile, “Impact of Renewable Energy Quotas and Emission Trade on Generation Planning”, 2009 IEEE Bucharest power tech conference, june 28th-july 2nd.
[image:5.595.37.533.54.233.2][20] Ting-Chia Ou, Kai-Hung Lu, Whei-Min Lin, and Chih-Ming Hong, “A Study for Price-Based Unit Commitment with Carbon Trading by DI&C simulation”, Industrial Informatics (INDIN), 8th IEEE International Conference Year 2010 Year2010 , Page(s): 73 – 78 and Computer Science: World Congress on Engineering 2010, pp. 1–4.
Table 2 : Benefit for various PSO parameter (400MW & 150 runs)
ω a1=1.0, a2=3.0
a1=1.5, a2=2.5 a1=2.0, a2=2.0 a1=3.0, a2=1.0 Without