Model Design of Low-Pass Filter of Integrated
Pulse Width Modulation for Aircraft System
Optimization
Francis T. Omigbodun1,Aderinsola M. Olawumi2, Bankole. I. Oladapo3, Oluwole K. Bowoto4, Funso P. Adeyekun5 1, 3
School of Engineering and Sustainable Development, De Montfort University, Leicester, UK
2, 4
Department of Physics Electronics, Federal University of Technology, Akure, Nigeria
5
Afe Babalola University, Ado Ekiti, Nigeria
Abstract: Aircraft system optimization control lead to less fuel consumption and operation costs, among other benefits. A novel Arduino based prototype of an Aerospace system that takes in an analogue signal of a variable frequency and zero voltage to produces an analogue output via pulse width modulation (PWM) was design. A suitable RC circuit which performs a low-pass digital filter with a cut-off frequency of 70Hz, with no attenuation of the signal should occur for the frequencies of 70Hz was model. The transfer region from 70Hz to 85Hz and output has no significant amplitude for input with frequency over 85Hz. This research also entails the electronic model design of the hardware for the prototype together with the MATLAB code that was used to design and calculate the filter and the source of the software that was used for the Arduino C code. The behaviour of the hardware design was proposed, assuming a “Blackbox” abstraction only for the Arduino board that was used. A detailed description of the MATLAB code and frequency response diagram that is produce using filter design. Also, a detailed description of the behaviour and semantics of the Arduino C code was used for the fueling, control module, communication and the vibration system of aircraft application. The images of the system working for different input signals of aircraft for frequencies in the pass-band, transfer region and the stop-band of the filter used for aircraft control.
Keywords: Low Pass Filter; analogue signal; pulse width modulation; aircraft system; stopband;
I. INTRODUCTION
Due to its inherent stability and linear phase characteristics, the filter is sometimes an ultimate choice for digital filtering. Digital filters are an integral part of many digital signal processing systems, including control systems, audio and video processing systems, communication systems, and medical application systems [1]. Due to the growing number of applications that include digital signal processing and digital filtering, digital filters have also met many requirements. Therefore, there is a need for flexible techniques for designing digital filters that accomplish complicated separations. The filter is a frequency selection device in the sense that it accepts an input signal, blocks the specified frequency components and then transmits the original signal minus these components to the output. Digital filtering is the most critical DSP operating system. On the other hand, in order to convert a transfer function into a state space equation, one can use the theory of the realisation which provides a method for deriving state-space matrices of a given transfer function [2-4]. Digital filters are used in a variety of signal processing applications, such as Spectrum analysis, digital image processing and pattern recognition [5]. Digital filters eradicate several problems coupled with their traditional analogue equivalents and are therefore often used instead of analogue filters. It was practised by the mathematical approach, which must take and consume over time. The result of this technology is the use of software products that save time, money and energy. Now it is more convenient to use the way researchers use the MATLAB software to design different filters. The FIR filter to be designed is a linear phase because of its property. Designing the FIR low pass filter with hardware is difficult and time-consuming [6,7]. It got annoying to go over that for his analysis and understanding. The design, however, became attractive with the help of the MATLAB software. Today, modern technology is used for learning purposes for the simplicity of complex circuits. The main advantage of the design of the low pass FIR filter is that of obtaining a linear phase frequency response. The above arguments related to the issues faced by various stakeholders that MATLAB need to adapt adapted technologies and simulation techniques to encourage researchers to propose an alternative solution to pave the way for solving community problems and challenges [8]. The Arduino FIR Low Pass Filter Study using MATLAB software will provide students and other interested parties with learning opportunities about the alternative solution and the significant implications of the software. The study will enhance students' ability to design filters to
prototype embedded in it, that takes in an analogue signal of a variable frequency and voltage between 0 and 5V, produces an analogue output via PWM and a suitable RC circuit. It then performs like a low-pass digital filter with a cut-off frequency of 70Hz, which implies that no attenuation of the signal should occur for frequencies between 0 and 70Hz. The transfer region from 70Hz to 85Hz and output with no significant amplitude for input with a frequency of over 85Hz.
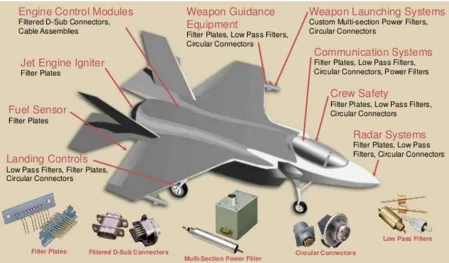
Fig 1: Aircraft application of low-pass filter of PWM
The specific objectives of the study are model design and develop the Arduino-based FIR low-pass filter using MATLAB. Design the FIR lowpass filter with MATLAB and develop and implement (FIR low-pass filter) according to the specified design parameters for the aircraft system in communication, vibration and fuelling system [9]. Evaluate the performance and acceptability of the system (FIR filter) based on acceptable test measurements design of the FIR low-pass filter using MATLAB to implement the output using the simulation which can be used in various aspect of aerospace. Digital signal processing is a growing field. Most of the work in signal processing is digitised to ensure the accessibility and reliability of digital signal processing. It is an excellent time to work in this field. The critical factor in digital signal processing is the design of the filter to meet the needs of different applications. However, the limitation is in the fact that more calculations are required to obtain specific filter response characteristics.
II. METHODOLOGY
A. Microcontroller And Software Environment
and platforms for computer and construction projects, but Arduino offers great benefits to its users, from students to teachers and interested people with little or nothing. Experience in this field. Some of these advantages. The table is relatively cheap. The cheaper version of the module costs less than $ 50 and can be assembled by hand with easy-to-understand procedures. The software integrated development environment is independent of the operating system. It works on most operating systems, unlike other microcontrollers that are limited to Windows. The programming environment is simple and clear. This defines why it is flexible and easy for beginners and advanced users to get the most out of the platform. Arduino software and hardware are open sources and extensible [14,15]. This means that experienced programmers are available to expand their versatility with increasing knowledge and experience.
B. RC- Circuit
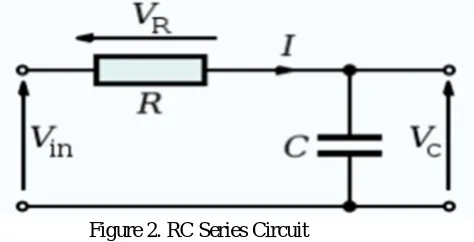
A resistor-capacitor (RC) circuit is an electrical circuit consisting of resistors and capacitors with a voltage or current source [4]. The simplest example of an RC circuit is a circuit that includes a resistor and a capacitor.
[image:3.612.207.444.289.410.2]In many cases, this circuit is used as a filter to "filter" a waveform of the signal, which is a representation of the received or observed signal that modifies the magnitude of the high and low frequencies concerning its input signals [4]. For this purpose, three different types of filters contain the low pass filters, band pass filter and the High pass filters. One widespread example of filtering is smoothing a signal, so a low pass type is applied in this case.
Figure 2. RC Series Circuit
Viewing the circuit in Figure 2 above as a voltage divider voltage across the capacitor is given as; ( ) =
( )
The voltage across the resistor is given as; ( ) = ( ) = ( )
C. Arduino Uno Microcontroller Hardware
The model used in this experiment is Arduino UNO R2. The hardware resources include One, 14 digital I / O pins, six analogue inputs and six of which can generate a pulse width modulated (PWM) signals, the Atmel Amega328 microcontroller SPI, RX / TX serial communication and external interrupts, etc [4]. The Arduino microcontroller (Genuine uno) receives the analogue input signals from the signal generator as frequency via pin A5. The received signal passes through the RC circuit forming the filter and sends a pulse width modulation (PWM) signal to the oscilloscope through the cable of the probe connecting the Arduino board to the oscilloscope channel 1. To get the desired sinusoid. The resolution of the Arduino is 8 bits, which simply means that the pulse width modulation (PWM) signal can be set to an integer between 0 and 255 to obtain a voltage amplitude in a range. Depending on the application, but for our filter, its value is between 0 and 5 V (i.e. the output voltage of the power supply is determined by the duty cycle of the PWM signal) [3]. It is a cable with a plug at one end corresponding to the signal generator and the oscilloscope, and a rigid plastic end that includes a handle and a probe body to make a rigid contact. The handle makes it possible to hold and guide the probe without affecting the measurement.
III. EXPERIMENT
A. Theory this Experiment
The design and testing of a prototype Arduino-based signal filtering system using an Arduino Uno microcontroller is done . This work aims to design and build a system with an Arduino-based prototype that contains an analogue signal with a frequency and a variable voltage between 0 and 5 V, whereby an analogue output signal is generated by PWM and a suitable RC circuit. Then it works as a digital low-pass filter with a cut-off frequency of 70 Hz, which means that for frequencies between 0 and 70 Hz, a transmission range of 70 Hz to 85 Hz and output without significant amplitude, no signal attenuation should occur for an input frequency higher than 85Hz. These introduce the concept of the filter and define its bandwidth, transition band and stop band. We will also see the characteristics of the different filter types: low-pass, high-pass, bandpass and stopband during the analysis. To facilitate a convenient laboratory session that facilitates analysis and understanding, a recipe is provided for establishing a simple analogue filter circuit of a resistor (R) and a capacitor (C) of known values. We will also describe how this filter (RC circuit) can be analysed with a signal generator to provide an input signal to the filter (RC circuit) and an oscilloscope to correlate the input/output ratio of the filter. This relationship is then used to create a filter feature for a high pass and low pass filter application if required. As we progress, we find that the system described here is a concrete example of how filters can be used to read a value in a noisy environment. Therefore, a filter is integrated that provides an average signal between 70 and 85 Hz in a test loop and a maximum flux of 85 Hz. After several attempts have been made to identify simple parameters that can be analysed or accessed. The dynamic behaviour of the system implements a progress control routine. It is then shown that the resulting system is capable of providing a tolerable margin of error to the objective representative waveform. Finally, we intuitively explain how to increase the accuracy of the system further and tailor it to the specific needs and applications of users and applications.
B. Frequency Domain Consideration
The expression below is the frequency domain expressions and their effect. The analysis of each of the expressions shows which frequencies the circuit pass or blocks/filters. This analysis is hinged on the effect of gains as frequencies become large and small
C. Experimental Hardware Design
A schematic of the circuit built is shown in Figure. 1. Pins of the ATmega328P microcontroller are run out to the edges of the Arduino Uno board and are labelled at the connector pins. The filter to be included in the board is formed by joining the resistor and the capacitor in series. To achieve this, since the capacitor is not polarised, one end of it is connected to one end of the resistor and soldered to establish contact between the resistor and the capacitor. The free end of the capacitor is then connected to pin 9(PWM) while the free end of the resistor is connected to through GND on the Arduino board. In order to send a signal in the form of frequency input to the Arduino board. The probe wire is used to establish a connection between the Arduino board and the signal generator by fixing the connector part of the probe wire to the signal output port of the signal generator and the other end of the wire to port A5 of the Arduino board. To observe and analyse the behaviour of the signal, the junction point of the resistor and capacitor is connected to one of the channels of the oscilloscope. Notice that once it is programmed, the Arduino requires no external parts to run, except power (assuming you disconnect it from the USB), and whatever you want to hook up to the I/O pins.
Fig. 3. Circuit Diagram and schematic diagram of the hardware design
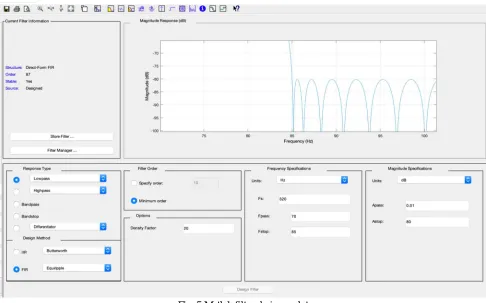
During the design phase of this work, in order to be more flexible in computing for different parameters and testing of samples. A PC with MATLAB software in the laboratory is used to send the order of the filter(N), and trial sampling frequency(Fs) obtained
from the filter design platform on the MATLAB iterative environment as shown below in fig. 3. Then the MATLAB code below is
implemented to generate the coefficient of the filter corresponding to the order of the filter used. to the Arduino, and to monitor the waveform generated by the oscilloscope.
Fig. 4. Illustration of Filtering [7]
This filter works based on a differential equation. The diagram depicts if the Arduino hardware is thought of as a black box.
Where b = coefficients of the inputs, a = coefficients of outputs. Assuming the Arduino hardware is thought of as a black box when the inputs (x1, x2x3…xn) go in, we obtain the outputs (y1, y2y3….yn). The difference equation is implemented within the black box shows that the present output depends on previous data as depicted above. In essence, the entire filtering process involves finding out what the coefficients of the filter are using the Matlab code below, recreate the difference equation, then find out what the current output will be. The process continues until the desired output is reached.
D. Matlab code to Generate filter coefficients N=90; %order of the filter
Fs=329; %sample frequency which can be measured using the toggle pin selected on the Arduino hardware board Fp=70; % cutoff frequency of the low pass filter
Ap = 0.01; % passband ripple is 0.01 dB Ast = 80; % stopband attenuation is set to 80 dB Rp = (10^(Ap/20) - 1)/(10^(Ap/20) + 1);% magnitude of the ripple in the passband in dB
Rst = 10^(-Ast/20); % magnitude of the ripple in the stopband in dB NUM = firceqrip(N, Fp/(Fs/2),[Rp Rst],'passedge');%
designs an order N filter (filter length equal N + 1),
where Fp/(Fs/2) specifies the frequency at which the passband starts to rolloff.
E. Arduino code to Implement Filtering #include <TimerOne.h> // timer one library
#define ORDER 87 // define here the order of the filter, the order of the filter is defined as 87th order int initial; const int out = 9; // output pin where the output values are put in to in course of calculation unsigned char i, j; //declaration of variables i and j to have values with +ve or -ve signs
char k; // declaring variable k according to the order of the filter with signed values from -128 to 127
float x[ORDER+1]; // the input array declared where the analogue input signal will be stored but initially stored as zero double acc; // accumulator to obtain precise values of result calculated
float a[ORDER + 1] = {0.00013651,0.00029168,2.1275e05,0.00033077, 0.00014521, 0.00047778, 0.00035118, 0.00059422,
-0.0006825, 0.00065696,0.0011339,-0.00060314, 0.0017059, 0.00037323, 0.0023714,
0.00010225,-0.0030823,-0.00088936,0.0037616,0.0020464,-0.0043042,-0.0036148,0.0045763,
0.0056124,-0.0044174,-0.0080269,0.0036414,0.010812,-0.0020348,-0.013888,-0.00065391,0.017139, 0.0047433,-0.020428,
-0.010695,0.023595,0.019301,-0.026476,-
0.032216,0.028912,0.053763,-0.030764,-0.099985,0.031922,0.31624,0.46768,0.31624,0.031922,-0.099985,-
0.030764,0.053763,0.028912,-0.032216,-0.026476,0.019301,0.023595,-0.010695,-0.020428,0.0047433,0.017139,-0.00065391,-0.013888,-0.0020348, 0.010812,0.0036414,-0.0080269,-0.0044174,0.0056124,0.0045763,-0.0036148,-0.0043042,0.0020464,
0.0037616,-0.00088936,-0.0030823,0.00010225,0.0023714,0.00037323,-0.0017059,-0.00060314,0.0011339,
0.00065696,-0.0006825,-0.00059422,0.00035118,0.00047778,-0.00014521,-0.00033077,2.1275e-05,0.00029168,0.00013651};// input values with decimal parts approximated to 8 decimal places obtained from MATLAB
void setup(void) // runs the code under this loop just once { Serial.begin(9600); // baud rate
Timer1.initialize(40); // setting PWM output frequency where 40 us = 25 kHz acc = k =initial= 0; // initialize values of k and accumulator to zero
for(i=0; i<ORDER+1; i++) x[i]=0; // for loop to increment the order of the filter by 1 pinMode(9, OUTPUT); // sample rate toggle pin}
void loop(void) // loop functions run the code forever { acc=0; // sample the input and put it in the current element of the input array indexed by the current index, set accumulator to 0 before taking next reading of the
input x[initial] = analogRead(A5); // to sample the signal and pin takes out the output, take an input reading from the input signal on Pin A5 and place it into the current element n of the input array
for(j=0; j<(ORDER+1); j++)// ‘for loop’ to increment the order of the filter by 1, the array replaces the previously stored values of x[inital] as n changes
{acc = acc + a[j]*x[(initial+j)%(ORDER+1)]; // implement the difference equation for the filter and accumulate the result in acc} Timer1.pwm(9, (int) (acc<0)?0:acc); // output the accumulator on the PWM pin 10// move the input array index to the next element of the // input array
if (initial==0){ initial=ORDER; }else { initial--;
}k = (k>0) ? 0:1; // this toggles the value k with eachy iteration . if k is greater than 0 else k is equal to 1
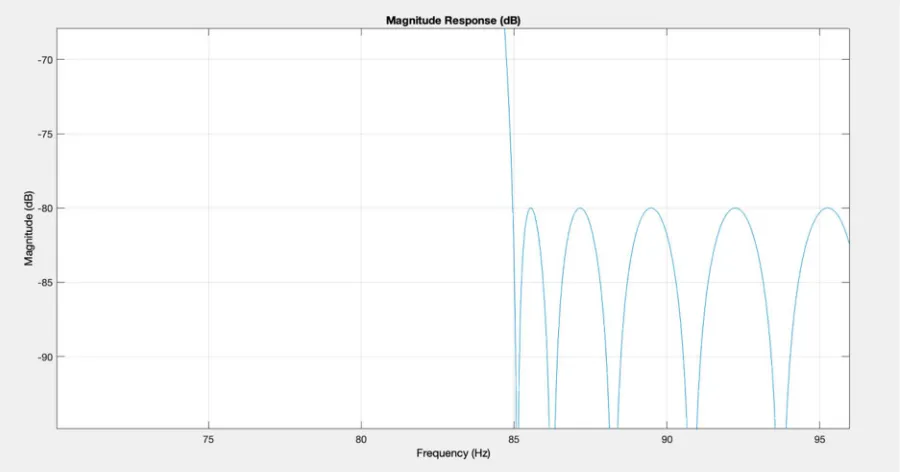
Fig. 5 Matlab filter designer plot
IV. RESULTS
Fig. 7 shows the picture of the designed Arduino based low pass filter prototype. The sample the input and put it in the current element of the input array indexed by the current index, set accumulator to 0 before taking the next reading of the input. The sample the signal and pin takes out the output, take an input reading from the input signal on Pin A5 and place it into the current element n of the input array The ‘loop’ to increment the order of the filter by 1, the array replaces the previously stored values of x[inital] as n changes. To implement the difference equation for the filter and accumulate the result in acc Timer1. PWM output
[image:8.612.153.461.476.702.2]A. Attenuation At Different Frequency Input Signals Investigated
The following figures illustrate the attenuation at input signals of 70Hz to 85Hz
a
b
c
[image:9.612.65.534.97.293.2]d
Fig. 7. lowpass filter prototype of (a) Input at 70Hz (b) Input Signal at 75Hz (c) Input Signal at 80Hz (d) Input Signal at 80Hz
B. Calculation of Sampling Frequency from the plot
Let t = period of one cycle in millisecond (Ms), n = the total number of cycles and the total Period ‘T’= × , the Sampling
Frequency = 1 ×
From the plot generated, the following parameters were extracted and Period for one cycle ‘t’ = 20ms at a total number of cycles
‘n’ = 1
Number of Samples = Total time period = × = Sampling Frequency = 1 × = 1 0.02 × 7 = 350Hz
From the plots shown in the results for the waveform in the oscilloscope depicting the attenuation pattern for the different frequency signals, as the frequency of the signal is increased its starts attenuating at 70Hz but it is greatly attenuated from 85Hz to infinity. This clearly explains the operation of a low pass filter, which allows the passage of lower frequency range up to 70Hz set as observed in Fig 7 and blocks higher frequencies from going through as seen in Fig. 8.
[image:9.612.82.533.465.701.2]V. CONCLUSION
The design of an Arduino based low pass filter using MATLAB for aircraft system control was implemented in this research and analysed in detail. The design has a cut off frequency of 75Hz and was significantly attenuated at 85Hz of the aircraft system. It has been observed that the circuit which is designed has worked properly. For op-amp, its output stability is very good for 48.45 dB gain. For the integrator, we got charging and discharging pulse at the output. For a given rectangular pulse, a triangular pulse was observed in the system. It was noticed that once the frequency is increased to a high frequency of 300Hz which is close to the sampling frequency (Nyquist frequency), the attenuation stops, aliasing effect the control of many aircraft systems like fuel, vibration and communication system occurs that is it starts allowing the passage of signal. The solution to this problem which could be the implementation of sales-key low pass filter of a second order low pass filter whereby an operational amplifier is introduced should be implemented in the future design to eliminate aliasing effect
REFERENCES
[1] Ruan, A.W., Liao, Y.B. and Li, J.X. (2009) An ALU-Based Universal Architecture for FIR Filters. IEEE Proceedings of International Conference on Communications, Circuits and Systems, Milpitas, July 2009, 1070-1073.
[2] Panayotatos, P. (2005) Frequency Response of Filters. Rutgers University, New Brunswick.
[3] Vincent A Balogun, Omonigho B Otanocha, Bankole I Oladapo, Development of smart linear velocity measuring device by embedding sensors with the arduino microcontroller, Proceedings of the 1st International Conference on Internet of Things and Machine Learning, Article No. 64, 2017
[4] Arduino, “ARDUINO,” 2018. [Online]. Available: https://www.arduino.cc/en/Guide/Introduction. [Accessed 5 May 2019]. [5] https://www.slideshare.net/JaymieMurray/eis-military-aircraft-product-applications [Accessed 6th May 2019]
[6] BI Oladapo, VA Balogun, AOM Adeoye, CO Ijagbemi, AS Oluwole, ..Model design and simulation of automatic sorting machine using proximity sensor, Engineering science and technology, an international journal 19 (3), 1452-1456
[7] W. Drongelen, Signal Processing for Neuroscientists (Second Edition), Chicago, IL, USA: Elsevier, 2018.
[8] Adeyinka O. M. Adeoye, Bankole I. Oladapo, Adefemi A. Adekunle, Ayamolowo J. Olademeji, Joseph F. Kayode. Design, simulation and implementation of a PID vector control for EHVPMSM for an automobile with hybrid technology, Journal of Materials Research and Technology, Volume 8, Issue 1, January– March 2019, Pages 54-62
[9] R. capacitors, "capacitors" [Online]. Available: https://www.radioshack.com/products/radioshack-0-1uf-50v-hi-q-ceramic-disc- capacitor-pk-2. [Accessed 5th May 2019].
[10] Vincent A. Balogun, Bankole I. Oladapo, Adeyinka O. M. Adeoye, Joseph F. Kayode, Samuel O. Afolabi, Hysteresis analysis of Thornton (IP6, IP12E and TH5V) magnetic materials through the use of Arduino microcontroller. Journal of Materials Research and Technology, Volume 7, Issue 4, October–December 2018, Pages 443-449
[11] A. Industries, "Google," Adafruit Industries, [Online]. Available: https://www.adafruit.com/product /2781. [Accessed 6th May 2018].
[12] G. Instek, "Google(Analog Function Generator)," GW Instek, [Online]. Available: http://www.gwinstek.com/en- global/products/Signal_Sources/Analog_Function_Generators/GFG-8020H. [Accessed 6th May 2019]
[13] Francis T. Omigbodun, Bankole I. Oladapo, Oluwole K. Bowoto, Funso P. Adeyekun, Modelling detection of magnetic hysteresis properties with a microcontroller. International Journal of Engineering Trends and Technology (IJETT) 67 (6), 5-12
[14] C. wires, "Google," carstool.ru, [Online]. Available: http://carstool.ru/nabor-tectovix- provodov-dlya-mul-time try-banana-krokodil. [Accessed 5th May 2018]. [15] Bowoto, O.K.; Oladapo, B.I.; Nimako, P.A.; Omigbodun, F.T.; Emenuvwe, O.A. Arduino Fault Tolerant System, Internet of Things (IoT). Preprints 2019,
2019060034 (doi: 10.20944/preprints201906.0034.v1)
![Fig. 4. Illustration of Filtering [7]](https://thumb-us.123doks.com/thumbv2/123dok_us/1238244.649600/6.612.167.443.76.260/fig-illustration-of-filtering.webp)