Multi-paragraph Subtopic Passages
Marti A. Hearst*
Xerox PARCTextTiling is a technique for subdividing texts into multi-paragraph units that represent passages,
or subtopics. The discourse cues for identifying major subtopic shifts are patterns of lexical
co-occurrence and distribution. The algorithm is fully implemented and is shown to produce
segmentation that corresponds well to human judgments of the subtopic boundaries of 12 texts.
Multi-paragraph subtopic segmentation should be useful for many text analysis tasks, including
information retrieval and summarization.
1. Introduction
Most work in discourse processing, both theoretical and computational, has focused on analysis of interclausal or intersentential phenomena. This level of analysis is im- portant for m a n y discourse-processing tasks, such as anaphor resolution and dialogue generation. However, important and interesting discourse phenomena also occur at the level of the paragraph. This article describes a paragraph-level model of discourse structure based on the notion of
subtopic shift,
and an algorithm for subdividing expository texts into multi-paragraph "passages" orsubtopic segments.
In this work, the structure of an expository text is characterized as a sequence of subtopical discussions that occur in the context of one or more main topic discussions. Consider a 21-paragraph science news article, called
Stargazers,
whose main topic is the existence of life on earth and other planets. Its contents can be described as consisting of the following subtopic discussions (numbers indicate paragraphs):l m 3 Intro - the search for life in space 4 - - 5 The moon's chemical composition
6m8 How early earth-moon proximity shaped the moon 9--12 How the moon helped life evolve on earth
13 Improbability of the earth-moon system 1 4 - - 1 6 Binary/trinary star systems make life unlikely 17--18 The low probability of nonbinary/trinary systems 19--20 Properties of earth's sun that facilitate life
21 Summary
Subtopic structure is sometimes marked in technical texts by headings and sub- headings. Brown and Yule (1983, 140) state that this kind of division is one of the most basic in discourse. However, m a n y expository texts consist of long sequences of para- graphs with very little structural demarcation, and for these a subtopical segmentation can be useful.
Computational Linguistics Volume 23, Number 1
This article describes fully implemented techniques for the automatic detection of multi-paragraph subtopical structure. Because the goal is to partition texts into contiguous, nonoverlapping subtopic segments, I call the general approach TextTiling (Hearst, 1993, 1994a, 1994b). 1 Subtopic discussions are assumed to occur within the scope of one or more overarching main topics, which span the length of the text. This two-level structure is chosen for reasons of computational feasibility and for the purposes of the application types described below.
TextTiling makes use of patterns of lexical co-occurrence and distribution. The algorithm has three parts: tokenization into terms and sentence-sized units, determi- nation of a score for each sentence-sized unit, and detection of the subtopic bound- aries, which are assumed to occur at the largest valleys in the graph that results from plotting sentence-units against scores. Three methods for score assignment have been explored: blocks, vocabulary introductions, and chains, although only the first two are evaluated in this article (the third is discussed in Hearst [1994b]). All three scoring methods make use only of patterns of lexical co-occurrence and distribution within texts, eschewing other kinds of discourse cues.
The ultimate goal of passage-level structuring is not just to identify the subtopic units, but also to identify and label their subject matter. This article focuses only on the discovery of the segment boundaries, but there is extensive ongoing research on automated topic classification (Lewis and Hayes 1994). Most classification work focuses on identifying main topic(s), as opposed to TextTiling's method of finding both globally distributed main topics and locally occurring subtopics; nevertheless, variations on some existing algorithms should be applicable to subtopic classification. The next section argues for the need for algorithms that can detect multi-paragraph subtopic structure (referred to here interchangeably as passages and subtopic seg- ments), and discusses application areas that should benefit from such structure. Sec- tion 3 describes in more detail what is meant in this article by "subtopic" and presents a description of the discourse model that underlies this work. Section 4 introduces the general framework of using lexical co-occurrence information for detecting subtopic shift, and describes other related work in empirical discourse analysis. The TextTil- ing algorithms are described in more detail in Section 5 and their performance is assessed in Section 6. Finally, Section 7 summarizes the work and describes future directions.
2. Why Multi-paragraph Units?
In school we are taught that paragraphs are to be written as coherent, self-contained units, complete with topic sentence and summary sentence. In real-world text, these expectations are often not met. Paragraph markings are not always used to indicate a change in discussion, but instead can sometimes be invoked just to break up the physical appearance of the text in order to aid reading (Stark 1988). A conspicuous example of this practice can be found in the layout of the columns of text in many newspapers (Longacre 1979). Brown and Yule (1983, 95-96) note that text genre has a strong influence on the role of paragraph markings, and that markings differ for different languages. Hinds (1979, 137) also suggests that different discourse types have different organizing principles.
Although most discourse segmentation work is done at a finer granularity than
that suggested here, multi-paragraph segmentation has many potential applications. TextTiling is geared towards expository text; that is, text that explicitly explains or teaches, as opposed to, say, literary texts, since expository text is better suited to the main target applications of information retrieval and summarization. More specifi- cally, TextTiling is meant to apply to expository text that is not heavily stylized or structured, and for simplicity does not make use of headings or other kinds of or- thographic information. A typical example is a 5-page science magazine article or a 20-page environmental impact report.
This section concentrates on two application areas for which the need for multi- paragraph units has been recognized: hypertext display and information retrieval. There are also potential applications in some other areas, such as text summarization. Some summarization algorithms extract sentences directly from the text. These meth- ods make use of information about the relative positions of the sentences in the text (Kupiec, Pedersen, and Chen 1995; Chen and Withgott 1992). However, these methods do not use subtopic structure to guide their choices, focusing more on the beginning and ending of the document and on position within paragraphs. Paice (1990) recog- nizes the need for taking topical structure into account but does not suggest a method for determining such structure.
Another area that models the multi-paragraph unit is automated text generation. Mooney, Carberry, and McCoy (1990) present a method centered around the notion of Basic Blocks: multi-paragraph units of text, each of which consists of (1) an organiza- tional focus such as a person or a location, and (2) a set of concepts related to that focus. Their scheme emphasizes the importance of organizing the high-level structure of a text according to its topical content, and afterwards incorporating the necessary related information, as reflected in discourse cues, in a finer-grained pass.
2.1 Online Text Display and Hypertext
Research in hypertext and text display has produced hypotheses about how textual information should be displayed to users. One study of an on-line documentation system (Girill 1991) compares display of fine-grained portions of text (i.e., sentences), full texts, and intermediate-sized units. Girill finds that divisions at the fine-grained level are less efficient to manage and less effective in delivering useful answers than intermediate-sized units of text.
Girill does not make a commitment about exactly h o w large the desired text unit should be, but talks about "passages" and describes passages in terms of the com- municative goals they accomplish (e.g., a problem statement, an illustrative example, an enumerated list). The implication is that the proper unit is the one that groups together the information that performs some communicative function; in most cases, this unit will range from one to several paragraphs. (Girill also finds that using doc- ument boundaries is more useful than ignoring document boundaries, as is done in some hypertext systems, and that premarked sectional information, if available and not too long, is an appropriate unit for display.)
Computational Linguistics Volume 23, Number 1
Converting text to hypertext, in what is called post hoc authoring (Marchionini, Liebscher, and Lin 1991), requires division of the original text into meaningful units (a task noted by these authors to be a challenging one) as well as meaningful intercon- nection of the units. Automated multi-paragraph segmentation should help with the first step of this process, and is more important than ever now that pre-existing docu- ments are being put up for display on the World Wide Web. Salton et al. (1996) have recognized the need for multi-paragraph units in the automatic creation of hypertext links as well as theme generation (this work is discussed in Section 5).
2.2 Information Retrieval
In the field of information retrieval, there has recently been a surge of interest in the role of passages in full text. Until very recently, most information retrieval ex- periments made use only of titles and abstracts, bibliographic entries, or very short newswire articles, as opposed to full text. When long texts are available, there arises the question: can retrieval results be improved if the query is compared against only a passage or subpart of the text, as opposed to the text as a whole? And if so, what size unit should be used? In this context, "passage" refers to any segment of text isolated from the full text. This includes author-determined segments, marked orthographi- cally (paragraphs, sections, and chapters) (Hearst and Plaunt 1993; Salton, Allan, and Buckley 1993; Moffat et al. 1994) a n d / o r automatically derived units of text, includ- ing fixed-length blocks (Hearst and Plaunt 1993; Callan 1994), segments motivated by subtopic structure (TextTiles) (Hearst and Plaunt 1993), or segments motivated by properties of the query (Mittendorf and Sch~iuble 1994).
Hearst and Plaunt (1993), in some early passage-based retrieval experiments, re- port improved results using passages over full-text documents, but do not find a significant difference between using motivated subtopic segments and arbitrarily cho- sen block lengths that approximated the average subtopic segment length. Salton, Al- lan, and Buckley (1993), working with encyclopedia text, find that comparing a query against orthographically marked sections and then paragraphs is more successful than comparing against full documents alone.
Moffat et al. (1994) find, somewhat surprisingly, that manually supplied section- ing information m a y lead to poorer retrieval results than techniques that automatically subdivide the text. They compare two methods of subdividing long texts. The first con- sists of using author-supplied sectioning information. The second uses a heuristic in which small numbers of paragraphs are grouped together until they exceed a size threshold. The results are that the small, artificial multi-paragraph groupings seemed to perform better than the author-supplied sectioning information (which usually con- sisted of m a n y more paragraphs than Moffet et al.'s subdivision algorithm or Text- Tiling would create). More experiments in this vein are necessary to firmly establish this result, but it does lend support to the conjecture that multi-paragraph subtopic- sized segments, such as those produced by TextTiling, are useful for similarity-based comparisons in information retrieval.
Salton, Allan, and Buckley (1993) and Moffat et al. (1994) suggest that it is the nature of the intermediate size of the passages that matters.
Perhaps a more appropriate use of motivated segment information is in the display of information to the user. One obvious way to use segmentation information is to have the system display the passages with the closest similarity to the query, and to display a passage-based summary of the documents' contents.
As a more elaborate example of using segmentation in full-text information ac- cess, I have used the results of TextTiling in a new paradigm for display of retrieval results (Hearst 1995). This approach, called TileBars, allows the user to make informed decisions about which documents and which passages of those documents to view, based on the distributional behavior of the query terms in the documents. TileBars allows users to specify different sets of query terms, as discussed later. The goal is to simultaneously and compactly indicate:
1. the relative length of the document,
2. the frequency of the term sets in the document, and
3. the distribution of the term sets with respect to the document and to each other.
TextTiling is used to partition each document, in advance, into a set of multi-paragraph subtopical segments.
Figure 1 shows an example query about automated systems for medical diagno- sis, run over the ZIFF portion of the TIPSTER collection (Harman 1993). Each large rectangle next to a title indicates a document, and each square within the rectangle represents a TextTile in the document. The darker the tile, the more frequent the term (white indicates 0, black indicates 8 or more hits; the frequencies of all the terms within a term set are added together). The top row of each rectangle corresponds to the hits for Term Set 1, the middle row to hits for Term Set 2, and the bottom row to hits for Term Set 3. The first Column of each rectangle corresponds to the first TextTile of the document, the second column to the second TextTile, and so on. The patterns of gray- level are meant to provide a compact summary of which passages of the document matched which topics of the query.
Users' queries are written as lists of words, where each list, or term set, is meant to correspond to a different component of the query. 2 This list of words is then trans- lated into conjunctive normal form. For example, the query in the Figure is translated by the system as: (patient OR medicine OR medical) AND (test OR scan OR cure OR diagnosis) AND (software OR program). This formulation allows the interface to reflect each conceptual part of the query: the medical terms, the diagnosis terms, and the software terms. The document whose title begins "VA automation means faster ad- missions" is quite likely to be relevant to the query, and has hits on all three term sets throughout the document. By contrast, the document whose title begins "It's hard to ghostbust a network . . . " is about computer-aided diagnosis, but has only a passing reference to medical diagnosis, as can be seen by the graphical representation.
This version of the TileBars interface allows the user to filter the retrieved doc- uments according to which aspects of the query are most important. For example, if the user decides that medical terms should be better represented, the Min Hits or Min
Computational Linguistics Volume 23, Number 1
~ t =¢== wz= dLi~gumsi,,
Iii,i ii ,
~ r ~
"TextPert (So{b~mre Review) (eva{u~on)"
~ I "PC pdn~ers gain 3;;87 power with pro~col converters~ (Har~var~ "VA au~matJon means faster admissions, (US Department ol Veterans A~Iai~ "Better ADP could cut VA delays 4D%, of Bcia{s say, (autgma~c 0~a process
"Card smarts, (smart car~s)*
"It's hard to ghostbust a n e ~ k ~ current diagnostic tools managers s ~ "Army tests prototype battlefield information ~ m , & O *
• Lack of ]rnagtnat~lon stalls op*dcai-disk appiications.&O"
"The electrlc cadaver, [computerized anatomy {assorts and digits! dissection
[ "interesting r ~ , things, (monitoring and testing equipment) (buyers g
"MegaDdve 20 is fellah!e, has exceltent sol~ra~e: 'mice adjunct to standard h
Figure 1
The TileBars Display on a query about automated systems for medical diagnosis (Hearst 1995 (~) ACM).
Distribution constraint on this t e r m set c a n be a d j u s t e d accordingly. M i n Hits indicates the m i n i m u m n u m b e r of times w o r d s f r o m a t e r m set m u s t a p p e a r in the d o c u m e n t in o r d e r for it to b e d i s p l a y e d . Similarly, M i n D i s t r i b u t i o n indicates the m i n i m u m p e r - c e n t a g e of tiles that m u s t h a v e a r e p r e s e n t a t i v e f r o m the t e r m set. T h e setting M i n O v e r l a p S p a n refers to the m i n i m u m n u m b e r of tiles that m u s t h a v e at least o n e hit f r o m e a c h of the three t e r m sets. In Figure 1, the u s e r h a s indicated that the d i a g n o s i s aspect of the q u e r y m u s t b e s t r o n g l y p r e s e n t in the r e t r i e v e d d o c u m e n t s , b y setting the M i n D i s t r i b u t i o n to 30% for the s e c o n d t e r m set. 3
W h e n the u s e r m o u s e - c l i c k s o n a s q u a r e in a TileBar, the c o r r e s p o n d i n g d o c u m e n t is d i s p l a y e d b e g i n n i n g at the selected TextTile. T h u s the u s e r c a n also v i e w the s u b t o p i c structure w i t h i n the d o c u m e n t itself.
[image:6.468.58.430.52.432.2]This section has discussed w h y multi-paragraph segmentation is important and how it might be used. The next section elaborates on what is meant by multi-paragraph subtopic structure, casting the problem in terms of detection of topic or subtopic shift.
3. Coarse-Grained Subtopic Structure
3.1 What is Subtopic Structure?
In order to describe the detection of subtopic structure, it is important to define the phenomenon of interest. The use of the term subtopic here is meant to signify pieces of text "about" something and is not to be confused with the topic/comment distinc- tion (Grimes 1975), also known as the g i v e n / n e w contrast (Kuno 1972), found within individual sentences.
The difficulty of defining the notion of topic is discussed at length in Brown and Yule (1983, Section 3). They note:
The notion of 'topic' is clearly an intuitively satisfactory way of de- scribing the unifying principle which makes one stretch of discourse 'about' something and the next stretch 'about' something else, for it is appealed to very frequently in the discourse analysis literature . . . . Yet the basis for the identification of 'topic' is rarely made explicit. (pp. 69-70)
After m a n y pages of attempting to pin the concept down, they suggest, as one alternative, investigating topic-shift markers instead:
It has been s u g g e s t e d . . , that instead of undertaking the difficult task of attempting to define 'what a topic is', we should concentrate on describing what we recognize as topic shift. That is, between two con- tiguous pieces of discourse which are intuitively considered to have two different 'topics', there should be a point at which the shift from one topic to the next is marked. If we can characterize this marking of topic-shift, then we shall have found a structural basis for dividing up stretches of discourse into a series of smaller units, each on a sep- arate topic . . . . The burden of analysis is consequently transferred to identifying the formal markers of topic-shift in discourse. (pp. 94-95)
This notion of looking for a shift in content bears a close resemblance to Chafe's notion of The Flow Model of discourse in narrative texts (Chafe 1979), in description of which he writes:
Our data ... suggest that as a speaker moves from focus to focus (or from thought to thought) there are certain points at which there may be a more or less radical change in space, time, character configuration, event structure, or, even, world . . . . At points where all of these change in a maximal way, an episode boundary is strongly present. But often one or another will change considerably while others will change less radically, and all kinds of varied interactions between these several factors are possible. 4 (pp. 179-80)
Computational Linguistics Volume 23, Number 1
Thus, rather than identifying topics (or subtopics) per se, several theoretical dis- course analysts have suggested that changes or shifts in topic can be more readily identified and discussed. TextTiling adopts this stance. The problem remains, then, of how to detect subtopic shift. Brown and Yule (1983) consider in detail two markers: adverbial clauses and certain kinds of prosodic markers. By contrast, the next sub- section will show that lexical co-occurrence patterns can be used to identify subtopic shift.
3.2 Relationship to Segmentation in Hierarchical Discourse Models
Much of the current work in empirical discourse processing makes use of hierarchical discourse models, and several prominent theories of discourse assume a hierarchical segmentation model. Foremost among these are the attentional/intentional structure of Grosz and Sidner (1986) and the Rhetorical Structure Theory of Mann and Thompson (1987). The building blocks for these theories are phrasal or clausal units, and the targets of the analyses are usually very short texts, typically one to three paragraphs in length. 5 Many problems in discourse analysis, such as dialogue generation and turn- taking (Moore and Pollack 1992; Walker and Whittaker 1990), require fine-grained, hierarchical models that are concerned with utterance-level segmentation. Progress is being made in the automatic detection of boundaries at this level of granularity using machine learning techniques combined with a variety of well-chosen discourse cues (Litman and Passonneau 1995).
In contrast, TextTiling has the goal of identifying major subtopic boundaries, at- tempting only a linear segmentation. We should expect to see, in grouping together paragraph-sized units instead of utterances, a decrease in the complexity of the fea- ture set and algorithm needed. The work described here makes use only of lexical distribution information, in lieu of prosodic cues such as intonational pitch, pause, and duration (Hirschberg and Nakatani 1996), discourse markers such as oh, well, ok, however (Schiffrin 1987; Litman and Passonneau 1995), pronoun reference resolu- tion (Passonneau and Litman 1993; Webber 1988) and tense and aspect (Webber 1987; H w a n g and Schubert 1992). From a computational viewpoint, deducing textual topic structure from lexical occurrence information alone is appealing, both because it is easy to compute, and because discourse cues are sometimes misleading with respect to the topic structure (Brown and Yule 1983, Section 3).
4. Detecting Subtopic Change via Lexical Co-occurrence Patterns
TextTiling assumes that a set of lexical items is in use during the course of a given subtopic discussion, and when that subtopic changes, a significant proportion of the vocabulary changes as well. The algorithm is designed to recognize episode boundaries by determining where thematic components like those listed by Chafe (1979) change in a maximal way. However, unlike other researchers who have studied setting, time, characters, and the other thematic factors that Chafe mentions, I attempt to determine where a relatively large set of active themes changes simultaneously, regardless of
the
type
of thematic factor. This is especially important in expository text in whichthe subject matter tends to structure the discourse more so than characters, setting, and so on. For example, in the
Stargazers
text introduced in Section 1, a discussion ofcontinental movement, shoreline acreage, and habitability gives way to a discussion of binary and unary star systems. This is not so much a change in setting or character as a change in subject matter.
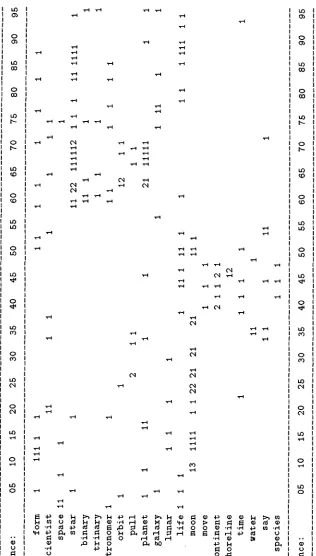
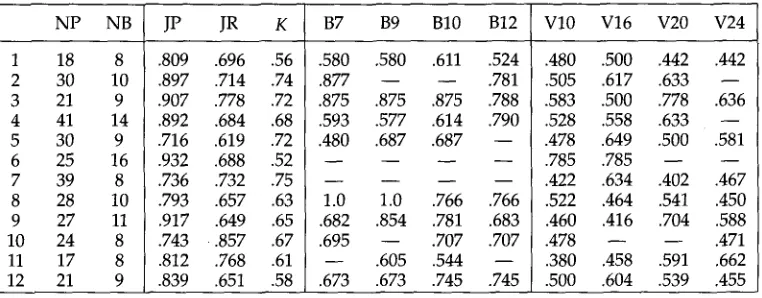
The flow of subtopic structure as determined by lexical co-occurrence is illustrated graphically in Figure 2. This figure shows the distribution, by sentence number, of se- lected terms from the
Stargazers
text. The number of times a given word occurs in a given sentence is shown, with blank spaces indicating zero occurrences. Words that occur frequently throughout the text (e.g., life, moon) are often indicative of the main topic(s) of the text. Words that are less frequent but more uniform in distribution, such as form and scientist, tend to be neutral and do not provide much information about the divisions within the discussions. The remaining words are what are of interest here. They are "clumped" together, and it is these clumps or groups that TextTiling assumes are indicative of the subtopic structure. The problem of segmentation there- fore becomes the problem of detecting where these clumps begin and end.For example, words binary through planet have considerable overlap in sentences 58 to 78, and correspond to the subtopic discussion Binary/trinary star systems make life unlikely shown in the (manually produced) outline in Section 1. There is also a well-demarcated cluster of terms between sentences 35 and 50, corresponding to the grouping together of paragraphs 10, 11, and 12 by h u m a n judges who have read the text, and to the subtopic discussion in Section 1 of How the moon helped life evolve on earth.
These observations suggest that a very simple take on lexical cohesion relations (Halliday and Hasan 1976) can be used to determine subtopic boundaries. However, from the diagram it is evident that simply looking for chains of repeated terms (as suggested by Morris and Hirst [1991]) is not sufficient for determining subtopic breaks. Even combining terms that are closely related semantically into single chains is insuf- ficient, since often several different themes are active within the same segment. For example, sentences 37 to 51 contain dense interactions among the terms move, conti- nent, shoreline, time, species, and life, and all but the latter occur only in this region. (It is, however, the case that the interlinked terms of sentences 57 to 71, space, star, binary, trinary, astronomer, orbit, are closely related semantically, assuming the appropriate senses of the words.)
Because groups of words that are not necessarily closely related conceptually seem to work together to indicate subtopic structure, I adopt a technique that can take into account the occurrences of multiple simultaneous themes rather than use chains of lexical cohesion relations alone. This viewpoint is also advocated by Skorochod'ko (1972), who suggests discovering a text's structure by dividing it up into sentences and seeing how much word-overlap appears among the sentences. The overlap forms a kind of intrastructure; fully connected graphs might indicate dense discussions of a topic, while long spindly chains of connectivity might indicate a sequential account. The central idea is that of defining the structure of a text as a function of the con- nectivity patterns of the terms that comprise it, in contrast with segmentation guided primarily by fine-grained discourse cues such as register change and cue words.
Computational Linguistics Volume 23, Number 1
Ob
0 O~
LO O0
0 ~ 0
LO
0 l " -
I t )
0
L.O
0 ",~
LO
LO
0
0
m
0
0
Figure 2
,¢-I
,r.t
,r-t ,¢--I
(',1
T-t ,r-t
.wt
,¢-t
P.
P.
,r--t
C4
CO .i-I
¢'1 ,¢-t
,¢-t
v-I
• ,--I ~ 0 ¢g r--I - ~ • I~ •
-,-I ~'~ ~ I~l 0
O ~ 0
,:::1~ O0 u ~ LO LO ~1~ O0 b.- ¢,0 ¢.0 1 ~ , ~ Ob 1,~. O0 b.. O0 ¢ . 0 0 0 ¢,0 ~ t O 0 ~
O O~
t O ~ 0
O 0 0
u 3 t ' -
o
O ¢.O
LO
O
I.O ,q4
CO
O 0 3
O,I
O
v-I
O
O O
[image:10.468.87.403.46.602.2]variation in the way concepts are expressed, and so may require that thesaural rela- tions be used as well, as in (Kozima 1993).
It should be noted that other researchers have experimented with the display of patterns of cohesion cues other than lexical cohesion as tools for analyzing discourse structure. Grimes (1975, Chapter 6) introduces span charts to show the interaction of various thematic devices such as character identification, setting, and tense. Stod- dard (1991) creates cohesion maps by assigning to each word a location on a two- dimensional grid corresponding to the word's position in the text.
To summarize, m a n y discourse analysis tasks require a fine-grained, hierarchical model, and consequently require m a n y kinds of discourse cues for segmentation in practice. TextTiling attempts a coarser-grained analysis and so gets away with using a simpler feature set. Additionally, if we think of subtopic segmentation in terms of detection of shift from one discussion to the next, we can simplify the task to one of detecting where the use of one set of terms ends and another set begins. Figure 2 illustrates that lexical distribution information can be used to discover such subtopic shifts.
The next subsections describe three different strategies for detecting subtopic shift. The first is based on the observations of this subsection, that subtopics can be viewed as "clumps" of vocabulary, and the problem of segmentation is one of detecting these clumps. The following two subsections describe alternative techniques, derived by recasting other researchers' algorithms into a more appropriate framework for the TextTiling task.
4.1 Comparing Adjacent Blocks of Text
In the block comparison algorithm, adjacent pairs of text blocks are compared for overall lexical similarity. The TextTiling algorithm requires that a score, called the
lexical score, be computed for every sentence, or more precisely, for the gap between
every pair of sentences (since this is where paragraph breaks take place).
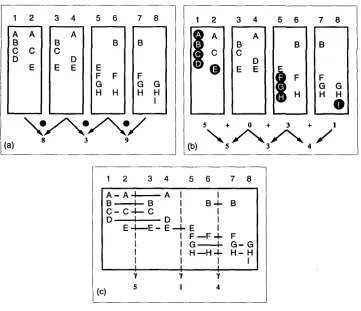
The sketch in Figure 3(a) illustrates the scores computed for the block comparison algorithm. In this figure is shown a sequence of eight hypothetical sentences, their contents represented as columns of letters, where each letter represents a term or word. The sentences are grouped into blocks of size k, where in this illustration k = 2. The more words the blocks have in common, the higher the lexical score at the gap between them. If a low lexical score is preceded by and followed by high lexical scores, this is assumed to indicate a shift in vocabulary corresponding to a subtopic change.
The blocks act as moving windows over the text. Several sentences can be con- tained within a block, but the blocks shift by only one sentence at a time. Thus if there are k sentences within a block, each sentence occurs in k , 2 score computations (except for sentences at the extreme ends of the text).
The current version of the block algorithm computes scores in a very simple man- ner, as the inner product of two vectors, where a vector contains the number of times each lexical item occurs in its corresponding block. The inner product is normalized to make the score fall between 0 and 1, inclusive.
Figure 3(a) shows the computation of the scores at the gaps between sentences 2 and 3, between 4 and 5, and between 6 and 7. The scores shown are simple, unnor- malized inner products of the frequencies of the terms in the blocks. For example the gap between sentences 2 and 3 gets assigned a score of 8 computed as 2 • 1 (for A) +1 • 1 (for B) +2 * 1 (for C) +1 * 1 (for D) +1 * 2 (for E). Results for this approach are reported in Section 6.
Computational Linguistics Volume 23, Number 1
1 2 3 4 5 6 7 8
A A
c o c B
E E
I
, , , o / , , , . / - , , . /
g 3 9
(a)
1 2 3 4 5 6 7 8
c B B B
) H 0
5 + 0 + 3 + 1
\ / N / ' , , ,
/
(b) 5 3 4
1 2 3 4 5 6 7 8
A - A I B
C - C . 4 - - C D
E
A I I
I B I B - I - B
I I
D I I
E - E.--I.- E I I F ~ F - I - F I G I G - G I H ~ H - I - H - H
I I I
I I
s 1 4
(c)
F i g u r e 3
Illustration of three ways to compute the lexical score at gaps between sentences. Numbers indicate a numbered sequence of sentences, columns of letters signify the terms in the given sentence. (a) Blocks - dot product of vectors of word counts in the block on the left and the block on the right. (b) Vocabulary introduction - the number of words that occur for the first time within the interval centered at the sentence gap. (c) Chains - the number of active chains, or terms that repeat within threshold sentences and span the sentence gap.
to c o m p a r i n g sentences 3 a n d 4 against sentences 5 a n d 6, the a l g o r i t h m c o m p a r e s sentences 4 a n d 5 against sentences 6 a n d 7.
[image:12.468.62.423.46.357.2]4.2 Vocabulary Introductions
Another recent analytic technique that makes use of lexical information is described in Youmans (1991), which introduces a variant on t y p e / t o k e n curves, called the Vocabu- lary-Management Profile. Type/token curves are simply plots of the number of unique words against the number of words in a text, starting with the first word and pro- ceeding through the last. Youmans modifies this algorithm to keep track of how m a n y first-time uses of words occur at the midpoint of every 35-word window in a text. Youmans' goal is to study the distribution of vocabulary in discourse rather than to segment it along topical lines, but upon examining m a n y English narratives, essays, and transcripts he notices that sharp upturns after deep valleys in the curve "correlate closely to constituent boundaries and information flow" (p. 788).
Youmans' analysis of the graphs is descriptive in nature, mainly attempting to identify the cause of each peak or valley in terms of a principle of narrative structure, and is done at a very fined-grained level. He discusses one text in detail, describ- ing changes at the single-word level, and focusing on within-paragraph and within- sentence events. Examples of events are changes in characters, occurrences of dialogue, and descriptions of places, each of which ranges in length from one clause to a few sen- tences. He also finds that paragraph boundaries are not always predicted--sometimes the onset of a new paragraph is signaled by the occurrence of a valley in the graph, but often paragraph onset is not signaled until one or two sentences beyond onset. 6
One of Youmans' main foci is an attempt to cast the resulting peaks in terms of co-ordination and subordination relations. However, in the discussion he notes that this does not seem like an appropriate use of the graphs. No systematic evaluation of the algorithm is presented, nor is there any discussion of how one might automatically determine the significance of the peaks and valleys.
Nomoto and Nitta (1994) attempt to use Youmans' algorithm for distinguishing entire articles from one another when they are concatenated into a single file. They find that it "fails to detect any significant pattern in the corpus" (p. 1148). I recast Youmans' algorithm into the TextTiling framework, renaming it the
vocabulary introduction
method. Figure 3(b) illustrates. The text is analyzed, and the positions at which terms are first introduced are recorded (shown in black circles in the figure). A moving window is used again, as in the blocks algorithm, and this window corresponds to Youmans' interval. The number of new terms that occur on either side of the midpoint, or the sentence gap of interest, are added together and plotted against sentence gap number.This approach differs from that of Youmans (1991) and Nomoto and Nitta (1994) in two main ways. First, Nomoto and Nitta (1994) use too large an interval--300 w o r d s - - because this is approximately the average size needed for their implementation of the blocks version of TextTiling. Large paragraph-sized intervals for measuring introduc- tion of new words seem unlikely to be useful since every paragraph of a given length should have approximately the same number of new words, although those at the be- ginning of a subtopic segment will probably have slightly more. Instead, I use interval lengths of size 40, closer to Youmans' suggestion of 35.
Second, the granularity at which Youmans takes measurements is too fine, since he plots the score at every word. Sampling this frequently yields a very spiky plot from which it is quite difficult to draw conclusions at a paragraph-sized granularity. I
Computational Linguistics Volume 23, Number 1
plot the score at every sentence gap, thus eliminating the wide variation that is seen when measuring after each word. Results for this approach are reported in Section 6.
4.3 Lexical Chains
Morris and Hirst's pioneering work on computing discourse structure from lexical relations (Morris and Hirst 1991; Morris 1988) is a precursor to the work reported on here. Influenced by Halliday and Hasan's (1976) theory of lexical coherence, Morris developed an algorithm that finds chains of related terms via a comprehensive the- saurus (Roget's Fourth Edition). 7 For example, the words residential and apartment both index the same thesaural category and can thus be considered to be in a coherence relation with one another. The chains are used to structure texts according to the at- tentional/intentional theory of discourse structure (Grosz and Sidner 1986) discussed above. The extent of the lexical chains is assumed to correspond to the extent of a segment. The algorithm also incorporates the notion of chain returns--repetition of terms after a long hiatus--to complete an intention that spans over a digression. The boundaries of the segments correspond to the sentences that contain the first and last words of the chain.
Since the Morris and Hirst (1991) algorithm attempts to discover attentional/inten- tional structure, its goals are different than those of TextTiling. Specifically, the dis- course structure it attempts to discover is hierarchical and more fine-grained than that discussed here. Morris (1988) provides five short example texts for which she has determined the intentional structure, and states that the lexical chains generated by her algorithm provide a good indication of the segment boundaries that Grosz and Sidner's theory assumes. In Morris (1988) and Morris and Hirst (1991), tables are pre- sented showing the sentences spanned by the lexical chains and by the corresponding segments of the attentional/intentional structure (derived by hand), but no formal evaluation is performed.
This algorithm is not directly applicable for TextTiling for several reasons. First, many words are ambiguous and fall into more than one thesaurus class. This is not stated as a concern in Morris's work, perhaps because the texts were short, and pre- sumably, if a word were ambiguous, the correct thesaurus class would nevertheless be chosen because the chained-to words would share only the correct thesaurus class. However, my experimentation with an implemented version of Morris' algorithm that made use of Roget's 1911 thesaurus (which is admittedly less structured than the thesaurus used by Morris), when run on longer texts, found ambiguous links to be a common occv',:ence and detrimental to the algorithm. A thesaurus-based disambigua- tion algorithm (Yarowsky 1992) m a y help alleviate this problem (this option is revisited in Section 7), but another solution is to move away from thesaurus classes and use simple word co-occurrence instead, since within a given text a word is usually used with only one sense (Gale, Church, and Yarowsky 1992b). The potential downside of this approach is that m a n y useful links may be missed.
Another limitation of the Morris algorithm is that it does not take advantage of, or discuss how to account for, the tendency for multiple simultaneous chains to occur over the same intention (each chain corresponds to one intention). Related to this is the fact that chains tend to overlap one another in long texts, as can be seen in Figure 2.
These two types of difficulties can be circumvented by recasting the Morris al- gorithm to take advantage of the observations at the beginning of this section. Three
changes are made to the algorithm: First, no thesaurus classes are used (only term repetition of morphological variants of the same word); second, multiple chains are allowed to span an intention; and third, chains at all levels of intentions are analyzed simultaneously. Instead of deciding which chain is the applicable one for a given in- tention, it measures h o w many chains at all levels are active at each sentence gap. This approach is illustrated in Figure 3(c). A lexical chain for term t is considered active across a sentence gap if instances of t occur within some distance threshold of one another. In the figure, all three instances of the word A occur within the distance threshold. The third B, however, follows too far after the second B to continue the chain. The score for the gap between 2 and 3 is simply the number of active chains that span this gap. Boundaries are determined as specified in Section 5. This variation of the TextTiling algorithm is explored and evaluated in Hearst (1994b).
4.4 Vector Space Similarity Comparisons
As mentioned in Section 2, Salton and Allan (1993) report work in the automatic de- tection of hypertext links and theme generation from large documents, focusing pri- marily on encyclopedia text. They describe the application of similarity comparisons between articles, sections, and paragraphs within an encyclopedia, both for creating links among related passages, and for better facilitating retrieval of articles in response to user queries. Their approach finds similarities among the paragraphs of large doc- uments using normalized
tfidf
term weighting, scoring text segments according to a normalized inner product of vectors of these weights (this algorithm is called thevector space model [Salton 1989]).
Salton and Allan (1993) do not try to determine the extents of passages within articles or sections. Instead, all paragraphs, sections, and articles are assigned pair- wise similarity scores, and links are drawn between those with the highest scores, independent of their position within the text. This distinction is important because the difficulty in subtopic segmentation lies in detecting the subtle differences between adjacent text blocks. A method that finds blocks with the topmost similarity to one another can succeed at finding the equivalent of the
center
of a subtopic extent, but does not distinguish where one subtopic ends and the next begins.If the algorithm of Salton and Allan (1993) were transformed so that adjacent text units were compared, and a method for determining where the similarity scores are low were used, then it would resemble the blocks algorithm with
tfidf
weighting, but without the use of overlapping text windows. However, a consequence of the fact that the vector space method is better at distinguishing similarities than differ- ences, is that similarity scores alone are probably less effective at finding the transition points between subtopic discussions than sequences of similarity scores, using moving windows of text, in the manner described above.C o m p u t a t i o n a l L i n g u i s t i c s V o l u m e 23, N u m b e r 1
nected sequence of paragraphs is found, that sequence is considered a text segment. This algorithm is not evaluated.
4.5 Other Related Approaches
Kozima (1993) describes an algorithm for the detection of text segments, which are defined as "a sequence of clauses or sentences that display local coherence" (p. 286) in narrative text. Kozima (1993) presents a very elaborate algorithm for computing the lexical cohesiveness of a window of words, using spreading activation in a seman- tic network created from an English dictionary. The cohesion score is plotted against words and smoothed, and boundaries are considered to fall at the lowest-scoring words. This complex computation, as opposed to simple term repetition, may be nec- essary when working with narrative texts, but no comparison of methods is done. The algorithm's results are shown on one text, but are not evaluated formally.
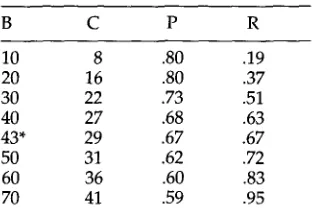
Reynar (1994) describes an algorithm similar to that of Hearst (1993) and Hearst and Plaunt (1993) with a difference in the way in which the size of the blocks of adjacent regions are chosen. A greedy algorithm is used: the algorithm begins with no boundaries, then a boundary b (between two sentences) is chosen which maximizes the lexical score resulting from comparing the block on the left whose extent ranges from b to the closest existing boundary on the left, and similarly for the right. This process is repeated until a prespecified number of boundaries have been chosen. This seems problematic, since the initial comparisons are between very large text segments: the first boundary is chosen by comparing the entire text to the right and left of the initial position. The algorithm is evaluated only in terms of how well it distinguishes entire articles from one another when concatenated into one file. The precision/recall tradeoffs varied widely: on 660 Wall Street Journal articles, if the algorithm is allowed to be off by up to three sentences, it achieves precision of .80 with recall of .30, and precision of .30 with recall of .92.
5. The TextTiling Algorithm
The TextTiling algorithm for discovering subtopic structure using term repetition has three main parts:
1.
2.
3.
Tokenization
Lexical Score Determination
Boundary Identification
Each is discussed in turn below. The methods for lexical score determination were outlined in Section 4, but more detail is presented here.
5.1 Tokenization
Tokenization refers to the division of the input text into individual lexical units, and is sensitive to the format of the input text. For example, if the document has markup information, the header and other auxiliary information is skipped until the body of the text is located. Tokens that appear in' the body of the text are converted to all lower-case characters and checked against a stop list of closed-classed and other high- frequency words, s If the token is a stop word then it is not passed on to the next
step. Otherwise, the token is reduced to its root by a morphological analysis function based on that of Kartunen, Koskenniemi, and Kaplan (1987), converting regularly and irregularly inflected nouns and verbs to their roots.
The text is subdivided into pseudosentences of a predefined size w (a parameter of the algorithm) rather than using "real" syntactically-determined sentences. This is done to allow for comparison between equal-sized units, since the number of shared terms between two long sentences and between a long and a short sentence would probably yield incomparable scores (and sentences are too short to expect normalization to really accommodate for the differences). For the purposes of the rest of the discussion these groupings of tokens will be referred to as
token-sequences.
The morphologically analyzed token is stored in a table along with a record of the token-sequence number it occurred in, and the number of times it appeared in the token-sequence. A record is also kept of the locations of the paragraph breaks within the text. Stop words contribute to the computation of the size of the token-sequence, but not to the computation of the similarity between blocks of text.5.2 Determining Scores
As mentioned above, two methods for determining the score to be assigned at each token-sequence gap are explored here. The first, block comparison, compares adjacent blocks of text to see how similar they are according to how m a n y words the adjacent blocks have in common. The second, the vocabulary introduction method, assigns a score to a token-sequence gap based on how many new words were seen in the interval in which it is the midpoint.
5.2.1 Blocks. In the block comparison algorithm, adjacent pairs of blocks of token- sequences are compared for overall lexical similarity. The
block size,
labeled k, is the number of token-sequences that are grouped together into a block to be compared against an adjacent group of token-sequences. This value is meant to approximate the average paragraph length. Actual paragraphs are not used because their lengths can be highly irregular, leading to unbalanced comparisons, but perhaps with a clever normalizing scheme, "real" paragraphs could be used (analogous to the substitution of token-sequences for real sentences).Similarity values are computed for every token-sequence gap number; that is, a score is assigned to token-sequence gap i corresponding to how similar the token- sequences from token-sequence i - k to i are to the token-sequences from i + 1 to i + k + 1. Note that this moving window approach means that each token-sequence appears in k • 2 similarity computations.
The lexical score for the similarity between blocks is calculated by a nor- malized inner product: given two text blocks bl and b2, each with k token-se- quences, where bl = {token-sequencei_k,..., token-sequencei} and b2 ~- {token-sequencei+l, . . . . token-sequencei+k + l },
score(i) = Y~t Wt,bl Wt,b2
V/G w2 G w2
t,bl t,b2where t ranges over all the terms that have been registered during the tokenization step (thus excluding stop words), and Wt,b is the weight assigned to term t in block b. As mentioned in Section 4, in this version of the algorithm, the weights on the terms are simply their frequency within the block, This formula yields a score between 0 and 1, inclusive.
Computational Linguistics Volume 23, Number 1
nate falls between token-sequences i and i + 1. Rather than plotting a token-sequence number on the x-axis, the token-sequence gap number i is plotted instead.
5.2.2 Vocabulary Introduction.
The lexical score assigned in the vocabulary introduc- tion version of scoring is the ratio of new words in an interval divided by the length of that interval. Tokenization is as described above, eliminating stop words and per- forming morphological analysis. A score is then assigned to a token-sequence gap as follows: the number of never-yet-seen words in the token-sequence to the left of the gap is added to the number of never-yet-seen words in the token-sequence to the right, and this number is divided by the total number of tokens in the two token-sequences, or w • 2. Since in these experiments w is set to 20, this yields an interval length of 40, which is close to the parameter 35 suggested as most useful in (Youmans 1991). As in the block version of the algorithm, the score is plotted at the token-sequence gap, and scores can range from 0 to 1, inclusive.The lexical score is computed as follows. For each token-sequence gap i, create a text interval b of length w • 2 (where w is the length of the token-sequences) centered around i, and let b be subdivided into two equal-length parts, bl and b2, where bl = { tokensi_w . . . . , tokensi } and b2 : { tokensi+ l, . . . , tokensi+w+ l }. Then,
score(i) = N u m N e w T e r m s ( b l ) + N u m N e w T e r m s ( b 2 ) w , 2
where N u m N e w T e r m s ( b ) returns the number of terms in interval b seen for the first time in the text.
5.3 Boundary Identification
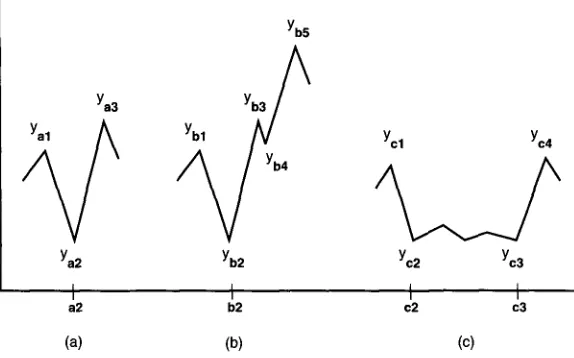
Boundary identification is done identically for all lexical scoring methods, and assigns a depth score, the depth of the valley (if one occurs), to each token-sequence gap. The depth score corresponds to how strongly the cues for a subtopic changed on both sides of a given token-sequence gap and is based on the distance from the peaks on both sides of the valley to that valley. Figure 4 illustrates. In Figure 4(a), the depth score at gap a2 is (Yax - Y a 2 ) q- (Ya3 --Ya2)" Relatively "deeper" valleys receive higher scores than shallower ones. More formally, for a given token-sequence gap i, the program records the lexical score of the token-sequence gap I to the left of i until the score for I - 1 is smaller than the score for l (meaning the top of the peak was found at 1). Similarly, for token sequences to the right of i, the program monitors the score of token-sequence r until the score for r + 1 is less than that of r. Finally, score(r) - score(i) is added to score(l) - score(i), and the result is the depth score at i.
A potential problem with this scoring method is illustrated in Figure 4(b). Here we see a small valley at gap b4 that can be said to "interrupt" the score for b2. As one safeguard, the algorithm uses smoothing (described below) to help eliminate small perturbations of the kind seen at
b4.
Additionally, because the distance between Yb3 and Yb4 is small in these kinds of cases, this gap is less likely to be marked as a boundary than gaps likeb2,
which have large peak distances both to the left and the right. This example illustrates the need to take into account the length of both sides of the valley, since a valley that has high peaks on both sides indicates that not only has the vocabulary on the left decreased in score, but the vocabulary on the right has increasing score, thus signaling a strong subtopic change.Yb5
Ya3
Ybl YN~
Ya2
Yb2
Yc2
Yc3
I I t I
a2 b2 c2 c3
[image:19.468.82.369.54.233.2](a)
(b)
(c)
Figure 4
A sketch illustrating the computation of depth scores in three different situations. The x-axis indicates token sequence gap number and the y-axis indicates lexical score.
assumed by TextTiling. When the plateau occurs over a longer stretch, usually it is rea- sonable to choose both bordering gaps as boundaries. However, when such a plateau occurs over a very short stretch of text, the algorithm is forced to make a somewhat arbitrary choice. Choices like these are cases in which the algorithm should proba- bly make use of additional information, such as more localized lexical distribution information, or perhaps more conventional discourse cues.
Note that the depth scores are based only on relative score information, ignoring absolute values. The justification for this is twofold. First, it helps make decisions in the cases in which a gap's lexical score falls into the middle of the lexical score range, but is flanked by tall peaks on either side, and this situation happens commonly enough to be important. Second, using relative rather than absolute scores helps avoid problems associated with situations like that of Figure 4(c), in which all gaps between c2 and c3 would be considered boundaries if only absolute scores were taken into account.
The depth scores are sorted and used to determine segment boundaries. The larger the score, the more likely the boundary occurs at that location, modulo adjustments as necessary to place the boundaries at orthographically marked paragraphs (if avail- able). A proviso check is made to prevent assignment of very close adjacent segment boundaries. Currently, at least three intervening token-sequences are required between boundaries. This helps control for the fact that many texts have spurious header in- formation and single-sentence paragraphs.
Computational Linguistics Volume 23, Number 1
5.4 Smoothing the Plot
As mentioned above, the plot is smoothed to remove small dips, using average smooth- ing with a width of size s, as follows:
for each token-sequence gap g and a small even number s find the scores of the
s/2
gaps to the left of gfind the scores of the
s/2
gaps to the right of g find the score at gtake the average of these scores and assign it to g repeat this procedure n times
The choice of smoothing function is somewhat arbitrary; other low-pass filters could be used instead.
5.5 Determining the Number of Boundaries
The algorithm must determine how many segments to assign to a document, since every paragraph is a potential segment boundary. Any attempt to make an absolute cutoff, even one normalized for the length of the document, is problematic since there should be some relationship between the structure and style of the text and the number of segments assigned to it. As discussed above, a cutoff based on a particular valley depth is similarly problematic.
Instead, I suggest making the cutoff a function of the characteristics of the depth scores for a given document, using the average ~ and standard deviation ~ of their scores (thus assuming that the scores are normally distributed). One version of this function entails drawing a boundary only if the depth score exceeds ~ - cr (the liberal measure, LC). This function can be varied to achieve correspondingly varying preci- sion/recall trade-offs. A higher precision but lower recall can be found by setting the limit to be depth scores exceeding ~ - or/2 (the conservative measure, HC) instead of
3 - o-.
6. Evaluation
There are several ways to evaluate a segmentation algorithm, including comparing its segmentation against that of human judges, comparing its segmentation against author-specified orthographic information, and comparing its segmentation against other automated segmentation strategies in terms of how they effect the outcome of some computational task. This section presents comparisons of the results of the algo- rithm against human judgments and against article boundaries. It is possible to com- pare against author-specified markups, but unfortunately, as discussed above, authors usually do not specify the kind of subtopic information desired. As mentioned above, Hearst (1995) and Hearst and Plaunt (1993) show how to use TextTiles in information retrieval tasks, although this work does not show whether or not the results of these algorithms produce better performance than the results of some other segmentation strategy would.
6.1 Reader Judgments
and Nakatani (1996) have reported promising results for obtaining higher interjudge agreement using their collection protocols.
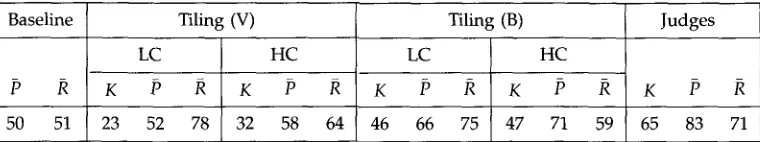
For the evaluation of the TextTiling algorithms, judgments were obtained from seven readers for each of 12 magazine articles that satisfied the length criteria (between 1,800 and 2,500 words) 9 and that contained little structural demarcation. The judges were asked simply to mark the paragraph boundaries at which the topic changed; they were not given more explicit instructions about the granularity of the segmentation. 1° Figure 5 shows the boundaries marked by seven judges on the
Stargazers
text. This format helps illustrate the general trends in the judges' assessments, and also helps show where and how often they disagree. For instance, all but one judge marked a boundary between paragraphs 2 and 3. The dissenting judge did mark a boundary after 3, as did two of the concurring judges. The next three major boundaries occur after paragraphs 5, 9, 12, and 13. There is some contention in the later paragraphs; three readers marked both 16 and 18, two marked 18 alone, and two marked 17 alone. The outline in the Introduction gives an idea of what each segment is about.Passonneau and Litman (1993) discuss at length considerations about evaluat- ing segmentation algorithms according to reader judgment information. As Figure 5 shows, agreement among judges is imperfect, but trends can be discerned. In the data of Passonneau and Litman (1993), if four or more out of seven judges mark a boundary, the segmentation is found to be significant using a variation of the Q-test (Cochran 1950). However, in later work (Litman and Passonneau 1995), three out of seven judges marking a boundary was considered sufficient to classify, that point as a "major" boundary.
Carletta (1996) and Ros6 (1995) point out the importance of taking into account the expected chance agreement among judges when computing whether or not judges agree significantly. They suggest using the kappa coefficient (K) for this purpose. Ac- cording to Carletta (1996), K measures pairwise agreement among a set of coders making category judgments, correcting for expected chance agreement as follows:
K - P(A) -P(E)
1 -P(E)
where
P(A)
is the proportion of times that the coders agree andP(E)
is the proportion of times that they would be expected to agree by chance. The coefficient can be com- puted by making pairwise comparisons against an expert or by comparing to a group decision. Carletta (1996) also states that in the behavioral sciences, K > .8 signals good replicability, and .67 < K < .8 allows tentative conclusions to be drawn. The kappa coefficients found in Isard and Carletta (1995) ranged from .43 to .68 for four coders placing transaction boundaries, and those found in (Ros~ 1995) ranged from .65 to .90 for four coders segmenting sentences. Carletta cautions, however, that "... coding discourse and dialogue phenomena, and especially coding segment boundaries, may9 O n e longer text of 2,932 w o r d s w a s u s e d since reader j u d g m e n t s h a d b e e n o b t a i n e d for it f r o m a n earlier e x p e r i m e n t . J u d g e s w e r e technical researchers. Two texts h a d three or f o u r s h o r t h e a d e r s , w h i c h were r e m o v e d for consistency. O n e text that w a s u s e d in H e a r s t (1994b) is n o t u s e d here b e c a u s e inconsistencies were f o u n d in t h e p a r a g r a p h break locations.
Computational Linguistics Volume 23, Number 1
be inherently more difficult than many previous types of content analysis (for instance, dividing newspaper articles based on subject matter)" and so implies that the levels of agreement needed to indicate good reliability for TextTiling may be justified in being lower.
For m y test texts, the judges placed boundaries on average 39.1% of the time, and nonboundaries 60.9%. Thus the expected chance agreement
P(E)
is .524 (sinceP(Boundary)
= .391 andP(Nonboundary) ~-
.609, (.3912 + .6092) = .524). To compute K,each judge's decision was compared to the group decision, where a paragraph gap was considered a "true" boundary if at least three out of seven judges placed a boundary mark there, as in Litman and Passonneau (1995). 11 The remaining gaps are considered nonboundaries. The average K for these texts was .647. This score is at the low end of the stated acceptability range but is comparable with those of other interreliability results (with fewer judges) found in discourse segmentation experiments.
6.2 Parameter Settings
An unfortunate aspect of the algorithm in its current form is that it requires the set- ting of several interdependent parameters, the most important of which are the size of the text unit that is compared, and the number of words in a token-sequence (which controls the number of times a term appears in a window as well as the number of data points that are sampled). The method, width, and number of rounds of smoothing must also be chosen. Usually only modest amounts of smoothing can be allowed, since more dramatic smoothing tends to obscure the point at which the subtopic transition takes place. Finally, the method for determining how many boundaries to assign must be specified. The three are interrelated: for example, using a larger text window re- quires less smoothing and fewer boundaries will be found, yielding a coarser-grained segmentation.
Initial testing was done on the texts evaluated with several different sets of pa- rameter settings and a default configuration that seems to cover many different text types was chosen. The defaults set w = 20, k = 10, n = 1, s = 2, for token-sequence size, block size, number of rounds of smoothing, and smoothing width, respectively. The evaluation presented here shows the results for different setting types to give a feeling for the space of results. Because the evaluation collection is very small, these results can be seen only as a suggestion; different settings may work better in different situations.
6.3 Results: Qualitative Analysis
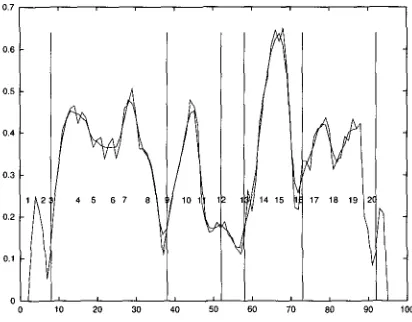
Figure 6 shows a plot of the results of applying the block comparison algorithm to the
Stargazer
text with k set to 10. When the lowermost portion of a valley is not located ata paragraph gap, the judgment is moved to the nearest paragraph gap. 12 For the most part, the regions of strong similarity correspond to the regions of strong agreement among the readers. (The results for this text are among the stronger ones and appear in the last line of Table 2.) Note however, that the similarity information around para- graph 12 is weak. This paragraph briefly summarizes the contents of the previous three paragraphs; much of the terminology that occurred in all of them reappears in
11 Paragraphs of three or fewer sentences were c o m b i n e d w i t h their n e i g h b o r if that neighbor w a s d e e m e d to follow at a " m a j o r " boundary, as in p a r a g r a p h s 2 a n d 3 of the Stargazers text. 12 More specifically, if the closest p a r a g r a p h location (first left, t h e n right) has n o t been m a r k e d as a