Original article
Tofacitinib or adalimumab versus
placebo: patient-reported outcomes
from OPAL Broaden—a phase III study
of active psoriatic arthritis in patients
with an inadequate response to
conventional synthetic
disease-modifying antirheumatic drugs
Vibeke Strand,1 Kurt de Vlam,2 Jose A Covarrubias-Cobos,3 Philip J Mease,4
Dafna D Gladman,5 Daniela Graham,6 Cunshan Wang,6 Joseph C Cappelleri,6
Thijs Hendrikx,7 Ming-Ann Hsu6
To cite: Strand V, de Vlam K, covarrubias-cobos Ja, et al. tofacitinib or adalimumab versus placebo: patient-reported outcomes from OPal Broaden—a phase iii study of active psoriatic arthritis in patients with an inadequate response to conventional synthetic disease-modifying antirheumatic drugs. RMD Open 2019;5:e000806. doi:10.1136/ rmdopen-2018-000806
►Prepublication history for this paper is available online. to view these files, please visit the journal online (http:// dx. doi. org/ 10. 1136/ rmdopen- 2018- 000806).
received 23 august 2018 revised 18 October 2018 accepted 18 October 2018
For numbered affiliations see end of article.
Correspondence to
Dr Vibeke Strand; vstrand@ stanford. edu © author(s) (or their employer(s)) 2019. re-use permitted under cc BY-nc. no commercial re-use. See rights and permissions. Published by BMJ.
AbstrAct
Objectives tofacitinib is an oral Janus kinase inhibitor for
treatment of psoriatic arthritis (Psa). We evaluated patient-reported outcomes (PrOs) in patients with Psa refractory to ≥1 conventional synthetic disease-modifying antirheumatic drug (csDMarD-ir) and tumour necrosis factor inhibitor-naïve in a 12-month, phase iii randomised controlled trial (OPal Broaden [nct01877668]).
Methods Patients (n=422) received tofacitinib 5 mg or
10 mg twice daily, adalimumab 40 mg subcutaneously every 2 weeks or placebo advancing to tofacitinib 5 mg or 10 mg twice daily at month 3. least squares mean changes from baseline and percentages of patients reporting improvements ≥minimum clinically important differences (MciD); and scores ≥normative values in: Patient global assessment of disease activity (Ptga), Pain, Patient global Joint and Skin assessment (PgJS), Short Form-36 Health Survey version 2 (SF-36v2), Functional assessment of chronic illness therapy-Fatigue (Facit-Fatigue), euroQol 5-Dimensions-3-level questionnaire (eQ-5D-3l) and ankylosing Spondylitis Quality of life (aSQol) were determined. nominal p values were cited without multiple comparison adjustments.
Results at month 3, Ptga, Pain, PgJS, Facit-Fatigue,
eQ-5D-3l, aSQol and SF-36v2 Physical component Summary (PcS), physical functioning (PF), bodily pain (BP) and vitality domain scores exceeded placebo with both tofacitinib doses (p≤0.05); SF-36v2 social functioning with 5 mg twice daily (p≤0.05). Percentages reporting improvements ≥MciD in Ptga, Pain, PgJS, Facit-Fatigue, aSQol and SF-36v2 PcS, PF, BP and general health scores exceeded placebo with both tofacitinib doses (p≤0.05) and were similar with adalimumab.
Conclusion csDMarD-ir patients with active Psa reported
statistically and clinically meaningful improvements in PrOs with tofacitinib compared with placebo at Month 3.
InTROduCTIOn
Psoriatic arthritis (PsA) has multiple manifes-tations including inflammation of peripheral joints, tendons, ligaments, skin and the axial skeleton.1 PsA is associated with considerable
disease burden including fatigue, impaired
Key messages
What is already known about this subject?
► tofacitinib at 5 mg and 10 mg twice daily is effective
for the treatment of patients with psoriatic arthritis (Psa) and improves quality of life and function in addition to improving the signs and symptoms of the disease.
What does this study add?
► in this post hoc analysis of patients with Psa and an
inadequate response to conventional synthetic dis-ease-modifying antirheumatic drugs (csDMarD-ir), patient-reported outcomes (PrOs) improved with tofacitinib, compared with placebo, at month 3; many improvements were greater than the min-imum clinically important differences, with low numbers needed to treat, particularly in those PrOs most impacted by Psa, as well as values that met or exceeded normative scores.
► these improvements were reported within 2–4 weeks
and were maintained to month 12.
How might this impact on clinical practice?
► these results demonstrate that tofacitinib provides
significant and clinically meaningful improvements across a range of PrOs in csDMarD-ir patients with Psa, further supporting its use in clinical practice.
on May 7, 2020 by guest. Protected by copyright.
http://rmdopen.bmj.com/
productivity.2–5
Patient-reported outcomes (PROs) measure PsA-spe-cific skin and joint disease activity by Patient Global Assessment of disease activity (PtGA); pain, fatigue and physical function by the Health Assessment Question-naire Disability Index (HAQ-DI); and HRQoL by generic Short Form-36 Health Survey (SF-36), EuroQol 5-Dimen-sions-3-level questionnaire (EQ-5D-3L) and Dermatology Life Quality Index (DLQI).6–10 The importance of PROs
assessing treatment responses is reflected in the updated 2016 PsA core domain set, developed by the Group for Research and Assessment of Psoriasis and Psoriatic Arthritis-Outcome Measures in Rheumatology (GRAP-PA-OMERACT) working group, which has defined a core set of outcome domains to be measured in randomised controlled trials (RCTs) and longitudinal observational studies.11
Tofacitinib is an oral Janus kinase (JAK) inhibitor for the treatment of PsA. The efficacy and safety of tofacitinib 5 mg and 10 mg twice daily have been demonstrated in two phase III RCTs of 6–12 months’ duration in patients with inadequate responses to conventional synthetic disease-modifying antirheumatic drugs (csDMARD-IR) or tumour necrosis factor inhibitors (TNFi-IR) with active PsA (OPAL Broaden: NCT01877668; OPAL Beyond: NCT0188243912 13) and an ongoing long-term extension
(LTE) study (OPAL Balance: NCT01976364).
The objective of these analyses was to evaluate the effect of tofacitinib on PROs in csDMARD-IR patients with PsA enrolled in OPAL Broaden to assess if reported improve-ments were considered meaningful14–16 by evaluating
the percentages of patients reporting improvements
≥minimum clinically important differences (MCIDs) and scores ≥normative values at month 3 in each treatment group.
MeTHOds study design
OPAL Broaden was a phase III RCT conducted in 126 centres worldwide between January 2014 and December 2015.12 Briefly, eligible patients were: ≥18 years; with a
diagnosis of PsA for ≥6 months; fulfilled the ClASsification criteria for Psoriatic ARthritis17; with active plaque psoriasis
at screening; and active arthritis (≥3 swollen and ≥3 tender joints) at screening and baseline. Key inclusion and exclu-sion criteria were published previously.12
Eligible patients were randomised 2:2:2:1:1 to tofacitinib 5 mg twice daily, tofacitinib 10 mg twice daily, adalimumab 40 mg subcutaneous injection once every 2 weeks, placebo advancing to tofacitinib 5 mg twice daily at month 3 or placebo advancing to tofacitinib 10 mg twice daily at month 3. Patients received a stable background dose of a single csDMARD (methotrexate: 83.6%; sulfasalazine: 9.2%; leflunomide: 5.7%; hydroxychloroquine: 0.2%; other: 1.2%) and were followed up to month 12.
based on previously published changes; improvements ≥10 mm (decrease from baseline) were considered MCID for all visual analogue scale (VAS) scores. PtGA-VAS and Pain-VAS (range 0–100 mm)6 18 were evaluated at baseline, week 2
and months 1, 2, 3, 4, 6, 9 and 12. The following PROs were evaluated at baseline and months 1, 3, 6, 9 and 12: Patient Global Joint and Skin Assessment (PGJS) arthritis and psoriasis score and also separate joint and skin scores due to the potential divergence in the self-assessment of joint and skin disease activities, each evaluated by VAS6;
SF-36 version 2 (SF-36v2) Physical Component Summary (PCS) and Mental Component Summary (MCS) scores (MCIDs: PCS and MCS: improvements ≥2.5 points) and eight domain scores (norm-based scale; higher scores indi-cating better HRQoL; physical functioning [PF], role phys-ical [RP], bodily pain [BP], general health [GH], vitality [VT], social functioning [SF], role emotional, mental health [MH]; MCID for all domain scores: improvements
≥5.0 points)9 19 20; Functional Assessment of Chronic Illness
Therapy-Fatigue (FACIT-Fatigue) Total score (range 0–52; higher scores indicating less fatigue; MCID: improvements
≥4.0 points)21; EQ-5D-3L dimension scores (Mobility,
Self-care, Usual activities, Pain/discomfort, Anxiety/depres-sion [range 1–3; higher score indicates poorer HRQoL]) and EQ-VAS10 22; and Ankylosing Spondylitis Quality of
Life (ASQoL; range 0–18; higher scores indicate poorer HRQoL [eg motivation, daily activities, mood independ-ence, social interactions; higher scores indicate poorer HRQoL]; MCID: improvements ≥1.8 points).23
PtGA, Pain, SF-36v2, EQ-5D-3L, FACIT-Fatigue and ASQoL were secondary outcome measures, and SF-36v2 PF domain and FACIT-Fatigue were key secondary effi-cacy endpoints at month 3. In addition, HAQ-DI (range 0–3; higher scores indicate greater functional impair-ment; MCID: improvements ≥0.35 points) mean change from baseline, DLQI and Itch Severity Item (ISI) were measured. HAQ-DI responses have been reported previ-ously,12 and DLQI and ISI results that will form the basis
of a future publication are not reported here.
statistical analysis
For continuous endpoints, least squares mean changes from baseline were compared between active treatments (tofacitinib 5 mg and 10 mg twice daily and adalimumab 40 mg subcutaneous injection once every 2 weeks) and the combined placebo group, using a repeated meas-ures model with the fixed effects of treatment, visit, treat-ment-by-visit interaction, geographic location and base-line values, without imputation for missing values. An unstructured covariance model was used. The two placebo sequences were combined into a single placebo group up to month 3 (the end of the placebo-controlled period). P values were calculated from these repeated measures anal-yses. For results after month 3, a second repeated measures model was used including visits up to the end of study for all treatment sequences. For binary endpoints, p values
on May 7, 2020 by guest. Protected by copyright.
were calculated for comparing percentages between treat-ment groups, based on the normal approximation for the difference in binomial percentages. The same method was used to analyse the percentage of patients reporting scores ≥normative values. Missing values were not imputed, except for the percentage of patients reporting improve-ments ≥0.35 (MCID) in HAQ-DI, where non-responder imputation was prespecified for this efficacy measure. Nominal p values for the differences between active treat-ment versus placebo were reported without adjusttreat-ment for multiplicity. For all endpoints, significance was set at p≤0.05 throughout.
For illustrative purposes and to facilitate viewing improve-ments in HRQoL simultaneously across eight domains,24
spydergrams were generated using SF-36v2 domain raw scores (range 0–100), where published age–gender norms were matched to the study population for a benchmark comparison. Based on MCID response rates, the number needed to treat (NNT) was also calculated, defined as the inverse of the difference between PRO response rates in active treatment (tofacitinib 5 mg or 10 mg twice daily or adalimumab) and placebo groups at month 3.25 A separate
analysis included the percentages of patients reporting scores
≥normative values, with ‘normative’ referring to responses in individuals in the US general population without chronic disease. The percentages of patients reporting scores
≥normative values were calculated for SF-36v2 PCS, MCS and norm-based domain scores, FACIT-Fatigue and HAQ-DI (normative values: SF-36v2 PCS, MCS and domain scores
≥50; FACIT-Fatigue Total score ≥40.1; and HAQ-DI ≤0.2526).
Pearson correlation coefficients (|r|) were also assessed at month 3 with particular interest in the following PROs: HAQ-DI and SF-36v2 PF domain; Pain and SF-36v2 BP domain and EQ-5D-3L pain/discomfort dimension. Correlations between FACIT-Fatigue Total score and SF-36v2 VT domain have been evaluated and will be published in a future publication. Statistical significance for testing the null hypothesis of Pearson correlations equal to zero was assessed based on Student’s t distribu-tion (N-2 degree of freedom, where N is the total number of patients in the analysis). The analysis included patients with observations at a visit of interest in the Full Analysis Set.
ResulTs
Patient demographics and disease characteristics
In total, 422 patients were randomised and received
≥1 dose of the study drug; 373 patients completed the study. Baseline patient demographics, reported previ-ously, were broadly similar across treatment groups12;
the majority were Caucasian (96.9%), female (53.3%), with a mean age of 47.9 (SD 12.1) years and mean disease duration 6.1 (SD 6.5) years.
PROs
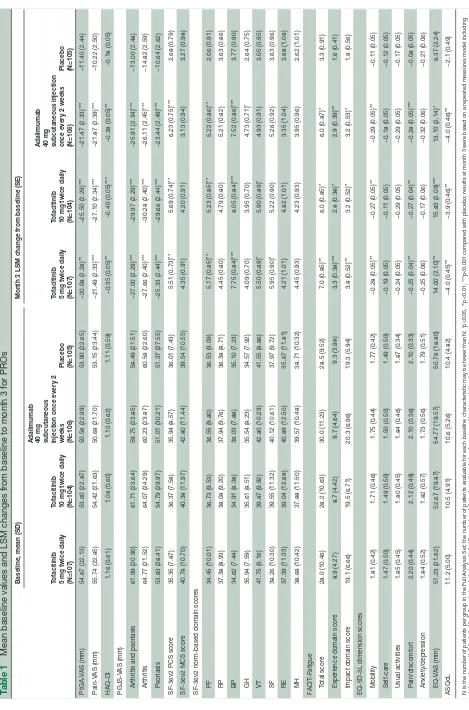
Baseline PROs were similar across treatment groups (table 1). Significant improvements from baseline
were reported at month 3 with all active treatments in PtGA, Pain, HAQ-DI, PGJS, SF-36v2 PCS, PF, BP and VT domains (tofacitinib 5 mg and 10 mg twice daily only), FACIT-Fatigue (Total score and two domain scores), EQ-5D-3L (mobility and pain/discomfort dimension scores), EQ-VAS and ASQoL, compared with placebo (all p≤0.05; table 1).
PtGA, Pain and PGJs
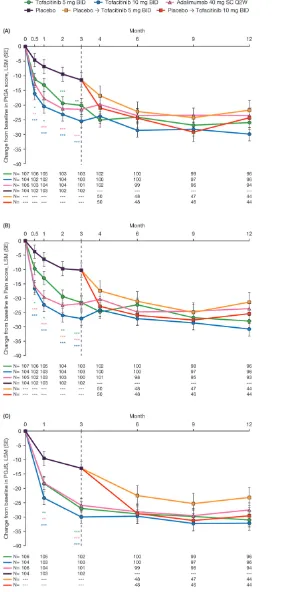
As early as week 2 (the first post-baseline assessment), greater improvements from baseline in PtGA and Pain were reported by patients receiving tofacitinib 5 mg and 10 mg twice daily, compared with placebo, and maintained to month 3 (all p≤0.05 for both compari-sons; figure 1A,B). Greater improvements from base-line were reported in PGJS as early as month 1 (the first post-baseline assessment) with both tofacitinib doses, compared with placebo, and were maintained to month 3 (all p<0.01 for both comparisons; figure 1C). Patients receiving adalimumab also reported significant improve-ments in PtGA, Pain and PGJS to month 3 (all p<0.01;
figure 1). Responses in PROs in those receiving active treatments were generally maintained to month 12; patients receiving placebo who advanced to tofacitinib at month 3 reported similar improvements in PtGA, Pain and PGJS after switching to tofacitinib (figure 1).
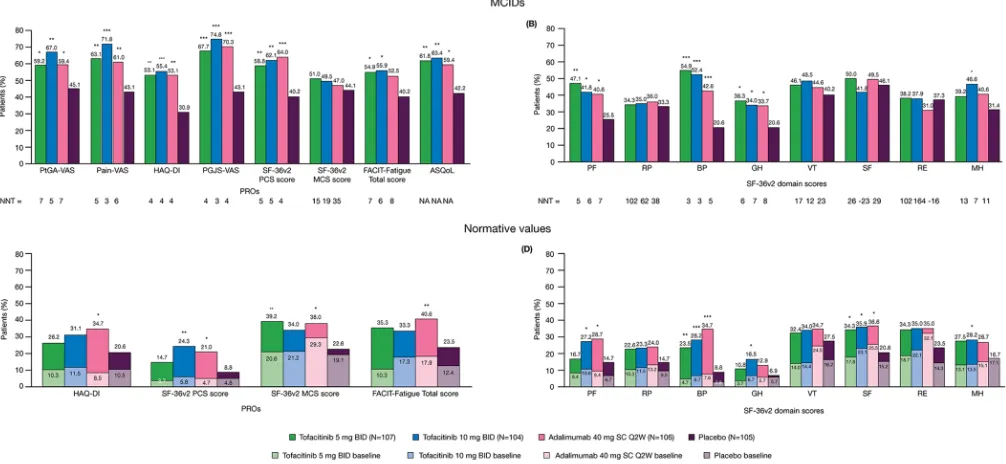
The percentages of patients reporting clinically mean-ingful improvements (≥MCID) at month 3 exceeded placebo with all active treatments, compared with placebo, for PtGA, Pain and PGJS (all p≤0.05). NNT values were similar across active treatments (figure 2A).
sF-36v2 PCs, MCs and domain scores
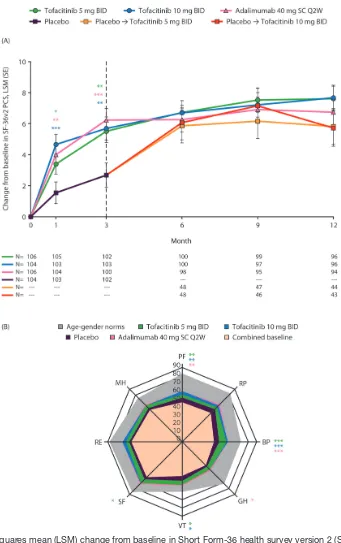
Patients receiving all active treatments reported improved SF-36v2 PCS scores compared with placebo at month 1, maintained to month 3 (all p≤0.05; figure 3A). No improve-ments in SF-36v2 MCS were reported at month 3 versus placebo (table 1). Patients receiving placebo who advanced to tofacitinib 5 mg or 10 mg twice daily at month 3 reported similar improvements in SF-36v2 PCS scores post-month 3 (figure 3A).
Significant improvements in SF-36v2 PF, BP and VT domain scores following treatment with both tofacitinib doses, compared with placebo, were reported at month 3 (all p≤0.05; table 1). Improvements in SF domain scores were reported following tofacitinib 5 mg twice daily at month 3, versus placebo (p≤0.05; table 1).
Compared with placebo, patients receiving adalim-umab reported significant improvements in SF-36v2 PF, BP and GH domains (all p≤0.05) at month 3 (table 1). Responses reported by patients receiving tofacitinib or adalimumab were generally maintained to month 12.
Spydergrams of SF-36v2 domains (raw 0–100 scale) illustrate that reported improvements from baseline to month 3 in SF-36v2 domain scores were greater with both doses of tofacitinib and adalimumab (OPAL Broaden) than placebo (figure 3B).
on May 7, 2020 by guest. Protected by copyright.
http://rmdopen.bmj.com/
Table 1
Mean baseline values and LSM changes fr
om baseline to month 3 for PROs
Baseline, mean (SD)
Month 3 LSM change fr
om baseline (SE)
Tofacitinib 5 mg twice daily (N=107) Tofacitinib 10 mg twice daily (N=104) Adalimumab 40 mg subcutaneous injection once every 2 weeks (N=106) Placebo (N=105) Tofacitinib 5 mg twice daily (N=107) Tofacitinib 10 mg twice daily (N=104) Adalimumab 40 mg subcutaneous injection once every 2 weeks (N=106) Placebo (N=105) PtGA-V AS (mm) 54.67 (22.13) 53.60 (22.87) 50.56 (22.99) 53.90 (22.65) −20.08 (2.28)** −25.50 (2.29)*** −21.47 (2.33)*** −11.40 (2.44) Pain-V AS (mm) 55.74 (22.85) 54.42 (21.63) 50.68 (21.70) 53.15 (23.44) −21.49 (2.33)*** −27.10 (2.34)*** −21.87 (2.39)*** −10.22 (2.50) HAQ-DI 1.16 (0.61) 1.08 (0.60) 1.10 (0.62) 1.11 (0.59) −0.35 (0.05)** −0.40 (0.05)*** −0.38 (0.05)** −0.18 (0.05) PGJS-V AS (mm)
Arthritis and psoriasis
61.99 (20.90) 61.71 (23.64) 59.75 (23.85) 58.49 (21.51) −27.00 (2.29)*** −29.97 (2.29)*** −25.91 (2.34)*** −13.00 (2.48) Arthritis 64.77 (21.52) 64.07 (24.29) 60.23 (23.87) 60.58 (22.60) −27.66 (2.40)*** −30.28 (2.40)*** −26.11 (2.45)*** −14.82 (2.59) Psoriasis 53.83 (28.41) 54.79 (29.97) 51.01 (30.21) 51.37 (27.55) −25.33 (2.44)*** −29.66 (2.44)*** −23.44 (2.49)*** −10.64 (2.62)
SF-36v2 PCS scor
e 35.35 (7.87) 36.37 (7.58) 35.94 (8.57) 36.01 (7.43) 5.51 (0.73)** 5.69 (0.74)** 6.23 (0.75)*** 2.68 (0.79)
SF-36v2 MCS scor
e 40.78 (10.70) 40.38 (11.97) 42.80 (11.44) 39.54 (10.55) 4.35 (0.91) 4.20 (0.91) 3.13 (0.94) 3.27 (0.98)
SF-36v2 norm-based domain scor
es PF 34.45 (10.01) 36.73 (9.53) 36.55 (9.80) 36.53 (9.09) 5.17 (0.85)** 5.23 (0.85)** 5.22 (0.86)** 2.06 (0.91) RP 37.38 (8.93) 38.08 (9.20) 37.94 (9.76) 36.38 (8.71) 4.45 (0.80) 4.79 (0.80) 5.21 (0.82) 3.63 (0.86) BP 34.62 (7.44) 34.91 (8.38) 36.03 (7.88) 35.10 (7.23) 7.75 (0.84)*** 8.05 (0.84)*** 7.52 (0.86)*** 3.77 (0.90) GH 35.94 (7.59) 35.61 (8.51) 35.54 (8.23) 34.57 (7.92) 4.09 (0.70) 3.95 (0.70) 4.73 (0.71)* 2.64 (0.75) VT 41.75 (9.16) 39.87 (9.92) 42.80 (10.29) 41.55 (8.86) 5.50 (0.89)* 5.90 (0.89)* 4.93 (0.91) 3.05 (0.95) SF 38.26 (10.30) 39.55 (11.32) 40.12 (10.61) 37.97 (9.72) 5.95 (0.90)* 5.22 (0.90) 5.26 (0.92) 3.63 (0.96) RE 37.39 (11.33) 39.04 (12.68) 40.89 (12.50) 35.67 (11.81) 4.21 (1.01) 4.82 (1.01) 3.35 (1.04) 3.68 (1.08) MH 38.68 (10.42) 37.88 (11.50) 39.57 (10.48) 38.71 (10.32) 4.45 (0.93) 4.23 (0.93) 3.95 (0.96) 2.62 (1.01) FACIT -Fatigue Total scor e 28.0 (10.46) 28.2 (10.63) 30.0 (11.23) 28.5 (9.52) 7.0 (0.85)** 6.0 (0.85)* 6.0 (0.87)* 3.3 (0.91)
Experience domain scor
e 8.9 (4.27) 8.7 (4.42) 9.7 (4.64) 9.3 (3.98) 3.3 (0.38)*** 2.8 (0.38)* 2.9 (0.39)** 1.6 (0.41)
Impact domain scor
e 19.1 (6.66) 19.5 (6.71) 20.3 (6.96) 19.3 (5.94) 3.8 (0.52)** 3.2 (0.52)* 3.2 (0.53)* 1.8 (0.56)
EQ-5D-3L dimension scor
es Mobility 1.81 (0.42) 1.71 (0.46) 1.75 (0.44) 1.77 (0.42) −0.28 (0.05)** −0.27 (0.05)** −0.29 (0.05)** −0.11 (0.05) Self-car e 1.47 (0.50) 1.49 (0.50) 1.50 (0.50) 1.49 (0.50) −0.19 (0.05) −0.11 (0.05) −0.18 (0.05) −0.12 (0.05) Usual activities 1.85 (0.45) 1.80 (0.45) 1.84 (0.46) 1.87 (0.34) −0.24 (0.05) −0.29 (0.05) −0.29 (0.05) −0.17 (0.05) Pain/discomfort 2.20 (0.44) 2.12 (0.49) 2.10 (0.36) 2.10 (0.33) −0.25 (0.04)** −0.27 (0.04)** −0.28 (0.05)*** −0.08 (0.05) Anxiety/depr ession 1.84 (0.52) 1.82 (0.57) 1.73 (0.56) 1.79 (0.51) −0.25 (0.06) −0.17 (0.06) −0.32 (0.06) −0.21 (0.06) EQ-V AS (mm) 51.23 (21.62) 52.67 (19.87) 54.77 (19.57) 50.76 (18.80) 14.00 (2.10)** 15.83 (2.09)*** 13.10 (2.14)* 6.37 (2.24) ASQoL 11.2 (5.00) 10.5 (4.91) 10.6 (5.26) 10.4 (4.82) −4.0 (0.45)** −3.9 (0.46)** −4.0 (0.46)** −2.1 (0.49)
N is the number of patients per gr
oup in the Full Analysis Set; the number of patients evaluable for each baseline characteristic may be fewer than N; *p≤0.05, *
*p<0.01, ***p<0.001 compar
ed with placebo; r
esults at month 3 wer
e based on a r
epeated measur
es model including
data up to month 3 for tofacitinib 5 mg twice daily
, tofacitinib 10 mg twice daily and combined placebo gr
oup without imputation for missing values.
ASQoL, Ankylosing Spondylitis Quality of Life; BP
, bodily pain; EQ-5D-3L, Eur
oQol 5-Dimensions 3-level questionnair
e; EQ-V
AS, Eur
oQol Health State visual analogue scale; F
ACIT
-Fatigue, Functional Assessment of Chr
onic Illness Therapy-Fatigue; GH, general health;
HAQ-DI, Health Assessment Questionnair
e Disability Index; LSM, least squar
es mean;MCS, Mental Component Summary; MH, mental health; PCS, Physical Component Summary; PF
, physical functioning; PGJS, Patient Global Joint and Skin Assessment; PROs, patient-r
eported
outcomes; PtGA, Patient Global Assessment of disease activity; RE, r
ole emotional; RP
, r
ole physical; SF
, social functioning; SF-36v2, Short Form-36 Health Survey version 2; V
AS, visual analogue scale; VT
, vitality
.
on May 7, 2020 by guest. Protected by copyright.
Figure 1 Least squares mean (LSM) changes from baseline: (A) Patient Global Assessment of disease activity visual analogue scale (PtGA-VAS) (mm); (B) Pain-VAS (mm); (C) Patient Global Joint and Skin Assessment (PGJS)-VAS (mm) arthritis and psoriasis. *p≤0.05, **p<0.01, ***p<0.001 compared with placebo; results up to month 3 were based on a repeated-measures model including data up to month 3 for tofacitinib 5 mg twice daily, tofacitinib 10 mg twice daily, adalimumab
40 mg subcutaneous injection once every 2 weeks and combined placebo group. Results after month 3 were based on a second repeated-measures model including data up to end of study for the five treatment sequences (tofacitinib 5 mg twice daily, tofacitinib 10 mg twice daily, adalimumab 40 mg subcutaneous injection once every 2 weeks, placebo → tofacitinib 5 mg twice daily and placebo → tofacitinib 10 mg twice daily), reporting results after month 3 only. Missing values were not imputed. Patient N is number of subjects evaluable at each visit. BID, twice daily; SC Q2W, subcutaneous injection once every 2 weeks.
on May 7, 2020 by guest. Protected by copyright.
http://rmdopen.bmj.com/
Figure 2 Percentages of patients reporting improvements from baseline ≥minimum clinically important difference (MCID) and number needed to treat (NNT) in (A) patient-reported outcomes (PROs); (B) Short Form-36 health survey version 2 (SF-36v2) domain scores at month 3 and percentages of patients reporting scores ≥normative values in (C) PROs; (D) SF-36v2 domain scores, at baseline and month 3. *p≤0.05, **p<0.01, ***p<0.001 compared with placebo; p values were based on the normal approximation for the difference in binomial percentages without imputation for missing values (except Health Assessment Questionnaire Disability Index [HAQ-DI] MCID response, which used non-responder imputation); N is the number of patients per group in the Full Analysis Set; the number of patients evaluable for each PRO endpoint may be fewer than N; MCID cut-offs: Patient Global Assessment of disease activity visual analogue scale (PtGA-VAS) decrease from baseline ≥10 mm; Pain-VAS decrease from baseline ≥10 mm; Patient Global Joint and Skin Assessment (PGJS)-Pain-VAS decrease from baseline ≥10 mm; SF-36v2: Physical Component Summary (PCS) and Mental Component Summary (MCS) increase from baseline ≥2.5, SF-36v2 domain scores increase from baseline ≥5.0; Functional Assessment of Chronic Illness Therapy-Fatigue (FACIT-Fatigue) increase from baseline ≥4.0; Ankylosing Spondylitis Quality of Life (ASQoL) decrease from baseline ≥1.8; HAQ-DI decrease from baseline ≥0.35; MCIDs are defined here in terms of mean change from baseline to month 3 in a treatment group; NNT calculated by the inverse of the percentage of patients receiving active treatments reporting improvements ≥MCIDs minus the percentage of patients in the placebo group reporting improvements ≥MCIDs; the percentage of patients reporting scores ≥normative values: HAQ-DI ≤0.25, FACIT-Fatigue Total score ≥40.1, SF-36v2 each of the component summary and domain scores ≥50. BID, twice daily; BP, bodily pain; GH, general health; MH, mental health; NA, not available; PF, physical functioning; RE, role emotional; RP, role physical; SC Q2W, subcutaneous injection once every 2 weeks; SF, social functioning; VT, vitality.
The percentages of patients reporting improvements
≥MCID at month 3 with all active treatments exceeded placebo in PCS, PF, BP and GH domains (all p≤0.05). In addition, improvements ≥MCID in MH domain scores were reported with tofacitinib 10 mg twice daily (p≤0.05). NNTs were similar across active treatments (figure 2A,B).
The percentages of patients reporting scores ≥ norma-tive values were numerically higher with both tofaci-tinib doses versus placebo in SF-36v2 PCS, MCS and all domain scores (figure 2C,D). Significantly more patients receiving tofacitinib 5 mg twice daily reported scores ≥normative values in MCS, BP and SF domains compared with placebo (all p≤0.05). Significantly more patients receiving tofacitinib 10 mg twice daily reported scores ≥normative values in PCS, PF, BP, GH, SF and MH domains than placebo (all p≤0.05). Similar results were reported by patients receiving adalimumab.
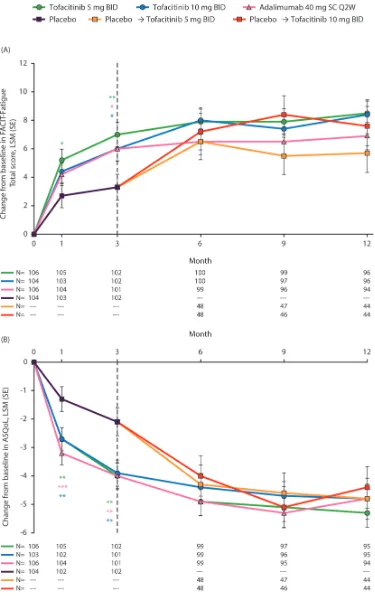
FACIT-Fatigue Total score and AsQol
Greater improvements from baseline in FACIT-Fatigue Total score were reported at month 1 following tofacitinib
5 mg twice daily versus placebo. At month 3, greater improvements from baseline in FACIT-Fatigue Total score were reported by patients receiving both tofacitinib doses, compared with placebo (all p≤0.05; figure 4A). Improve-ments in ASQoL exceeded placebo at month 1 with both doses of tofacitinib, sustained to month 3 (all p<0.01;
figure 4B). Patients receiving adalimumab also reported significant improvements in FACIT-Fatigue and ASQoL at month 3, compared with placebo (p≤0.05; figure 4A). Improvements in FACIT-Fatigue and ASQoL with all active treatments were generally maintained to month 12. Patients receiving placebo who advanced to tofacitinib 5 mg or 10 mg twice daily at month 3 reported improve-ments in FACIT-Fatigue and ASQoL post-month3.
The percentage of patients reporting improvements
≥MCID in FACIT-Fatigue at month 3 were greater with both tofacitinib doses (p≤0.05) but not with adalim-umab versus placebo; NNTs were similar across active treatments (figure 2A). A greater percentage of patients reported improvements in ASQoL ≥MCID at month
on May 7, 2020 by guest. Protected by copyright.
Figure 3 (A) Least squares mean (LSM) change from baseline in Short Form-36 health survey version 2 (SF-36v2) Physical Component Summary (PCS) score; and (B) spydergram of domain scores from baseline to month 3 and versus age-matched and gender-matched norms. Panel A: *p≤0.05, **p<0.01, ***p<0.001 compared with placebo; results up to month 3 were based on a repeated measures model including data (norm-based) up to month 3 for tofacitinib 5 mg twice daily, tofacitinib 10 mg twice daily, adalimumab 40 mg subcutaneous injection once every 2 weeks and combined placebo group. Results after month 3 were based on a second repeated measures model including data up to end of study for the five treatment sequences (tofacitinib 5 mg twice daily, tofacitinib 10 mg twice daily, adalimumab 40 mg subcutaneous injection once every 2 weeks, placebo → tofacitinib 5 mg twice daily and placebo → tofacitinib 10 mg twice daily), reporting results after month 3 only. Missing values were not imputed. Dashed line indicates end of placebo-controlled period. N represents the number of subjects evaluable at each visit. Panel B: *p≤0.05, **p<0.01, ***p<0.001 compared with placebo; spydergrams were generated using domain raw scores (range 0–100); US age–gender norms were matched to the protocol population; spydergrams are for illustrative purposes only; p values were generated using a repeated measures model for comparisons with placebo based on LSM changes from baseline in domain norm-based scores at month 3 (table 1). Missing values were not imputed. BID, twice daily; BP, bodily pain; GH, general health; MH, mental health; PF, physical functioning; RE, role emotional; RP, role physical; SC Q2W, subcutaneous injection once every 2 weeks; SF, social functioning; VT, vitality.
on May 7, 2020 by guest. Protected by copyright.
http://rmdopen.bmj.com/
Figure 4 Least squares mean (LSM) changes from baseline in (A) Functional Assessment of Chronic Illness Therapy-Fatigue (FACIT-Fatigue) Total score and (B) Ankylosing Spondylitis Quality of Life (ASQoL). *p≤0.05, **p<0.01, ***p<0.001 compared with placebo; results up to month 3 were based on a repeated measures model including data up to month 3 for tofacitinib
5 mg twice daily, tofacitinib 10 mg twice daily, adalimumab 40 mg subcutaneous injection once every 2 weeks and combined placebo group. Results after month 3 were based on a second repeated measures model including data up to end of study for the five treatment sequences (tofacitinib 5 mg twice daily, tofacitinib 10 mg twice daily, adalimumab 40 mg subcutaneous injection once every 2 weeks, placebo → tofacitinib 5 mg twice daily and placebo → tofacitinib 10 mg twice daily), reporting results after month 3 only. Missing values were not imputed. N is the number of subjects evaluable at each visit. BID, twice daily; SC Q2W, subcutaneous injection once every 2 weeks.
on May 7, 2020 by guest. Protected by copyright.
Table 2 Correlation analyses of PRO endpoints at month 3
HAQ-DI SF-36v2† PF SF-36v2† BP Pain-VAS EQ-5D-3L P/D
Tofacitinib 5 mg twice daily (N=101)
HAQ-DI 1 −0.67 −0.61 0.55 0.33
SF-36v2† PF – 1 0.64 −0.56 −0.38
SF-36v2† BP – – 1 −0.70 −0.50
Pain-VAS – – – 1 0.42
EQ-5D-3L P/D – – – – 1
Tofacitinib 10 mg twice daily (N=103)
HAQ-DI 1 −0.85 −0.68 0.58 0.46
SF-36v2† PF – 1 0.68 −0.52 −0.43
SF-36v2† BP – – 1 −0.65 −0.60
Pain-VAS – – – 1 0.42
EQ-5D-3L P/D – – – – 1
Adalimumab 40 mg subcutaneous injection once every 2 weeks (N=100)
HAQ-DI 1 −0.83 −0.71 0.67 0.53
SF-36v2† PF – 1 0.74 −0.63 −0.61
SF-36v2† BP – – 1 −0.74 −0.70
Pain-VAS – – – 1 0.58
EQ-5D-3L P/D – – – – 1
Placebo (N=102)
HAQ-DI 1 −0.76 −0.66 0.58 0.36
SF-36v2† PF – 1 0.72 −0.57 −0.44
SF-36v2† BP – – 1 −0.58 −0.39
Pain-VAS – – – 1 0.34
EQ-5D-3L P/D – – – – 1
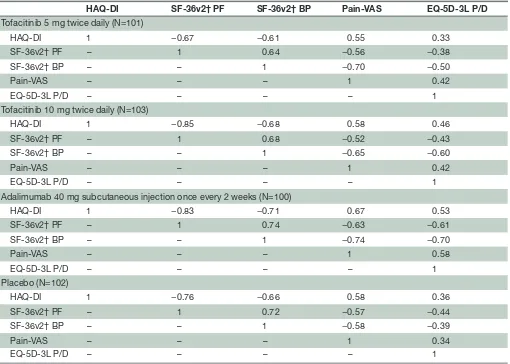
All correlations were **p<0.01, based on Student’s t distribution (N-2 degree of freedom) to test the null hypothesis of no correlation; the analysis included patients with observations at a visit of interest in the Full Analysis Set; N is the number of patients included in calculating the sample correlation.
†SF-36v2 scores are norm-based.
BID, twice daily; BP, bodily pain; EQ-5D-3L, EuroQol 5-Dimensions 3-level questionnaire; HAQ-DI, Health Assessment Questionnaire Disability Index; P/D, pain/discomfort; PF, physical functioning; PRO, patient-reported outcome; SF-36v2, Short Form-36 Health Survey version 2; VAS, visual analogue scale.
3 with all active treatments versus placebo (all p≤0.05;
figure 2A).
The percentages of patients reporting scores ≥ norma-tive values were numerically higher with both tofacitinib doses compared with placebo for FACIT-Fatigue but not significant for either tofacitinib dose. In contrast, signifi-cantly more patients receiving adalimumab, compared with placebo, reported scores ≥normative values in FACIT-Fatigue (p<0.01; figure 2C).
Correlation analysis
Correlations of pre-selected PRO endpoints (based on subject matter knowledge and clinical rationale) are shown in table 2. HAQ-DI at month 3 was moderately correlated (|r| >0.30–≤0.70) with Pain and EQ-5D-3L pain/discomfort dimension for all treatment groups. HAQ-DI was also moderately or highly (|r| >0.60) nega-tively correlated with SF-36v2 PF and BP domains (all treatment groups). At month 3, Pain and the SF-36v2 BP
domain were moderately or highly negatively correlated for all treatment groups. Correlations between SF-36v2 PF and BP domains were moderate for both tofacitinib doses and placebo, and high for adalimumab.
These results are similar to previously reported correla-tions between PROs in PsA and rheumatoid arthritis (RA).27–31
dIsCussIOn
In this study, patients with PsA who were refractory to csDMARDs reported improved PROs following treat-ment with tofacitinib 5 mg and 10 mg twice daily versus placebo at month 3, which were generally maintained to month 12. At month 3, clinically meaningful NNTs ≤10 were reported for PtGA, Pain, PGJS, SF-36v2 PCS and PF, BP and GH domain scores, FACIT-Fatigue Total score and HAQ-DI. NNTs provide an estimate of treatment effec-tiveness by determining the number of patients needed
on May 7, 2020 by guest. Protected by copyright.
http://rmdopen.bmj.com/
similar with tofacitinib 5 mg and 10 mg twice daily and also with adalimumab, demonstrating that both tofac-itinib doses were similar to the active control. In addi-tion, correlations between preselected PRO endpoints were similar to previously reported correlations between PROs in PsA.28–31 All the PRO endpoints included in the
correlation analysis were moderately or highly corre-lated, implying that these improvements are important and consistent with successful treatment. Furthermore, simultaneous assessment of SF-36v2 domain scores using spydergrams demonstrated that multiple domains were improved compared with baseline; however, domain scores were lower than age–gender norms matched to the protocol population.
Many RCTs have assessed PROs in csDMARD-IR patients with PsA. In previous phase II and phase III RCTs of apremilast, significant improvements in clinical outcomes and HRQoL were observed.28 33 An RCT of
goli-mumab in csDMARD-IR patients with PsA reported signif-icant improvements in HAQ-DI, HRQoL and productivity compared with placebo at month 6 that were sustained through to month 24. These improvements correlated with clinical improvement.34 Furthermore, in the Rheumatoid
Arthritis PreventIon of structural Damage (RAPID)-PsA RCT, patients with active PsA treated with certolizumab pegol reported clinically meaningful differences in HAQ-DI, SF-36v2, fatigue (measured using the Fatigue Assessment Scale), Pain and DLQI at month 6, compared with placebo, but no correlation with clinical efficacy was observed.35 In addition, in the phase III FUTURE 1 RCT,
patients with PsA receiving secukinumab reported signifi-cant improvements in PtGA, Pain and FACIT-Fatigue after 24 weeks of treatment.36 However, unlike OPAL Broaden,
these studies did not include an active control, and an important finding of this analysis was that improvements in PROs reported by patients treated with tofacitinib 5 mg or 10 mg twice daily were similar to those reported by patients receiving adalimumab 40 mg subcutaneous injection once every 2 weeks.
Fatigue is commonly reported by patients with PsA and was recently added to the PsA core domain set.21 37 38 In
this analysis, NNTs for FACIT-Fatigue Total scores were lower than those for SF-36v2 VT domain and, impor-tantly, similar to NNTs based on reported improvements in PtGA, PGJS and Pain at month 3.
Patients with PsA report impairment of PF, BP and VT. However, in comparison with patients with RA, patients with PsA are less likely to report impairments in RP and VT but are more likely to report difficulties in social, mental and emotional functioning, possibly due to the skin lesions that affect patients with PsA.20 39 40 Similar
percentages of patients reported SF-36v2 scores ≥ norma-tive values with tofacitinib and adalimumab at month 3. Compared with placebo, the percentages of patients reporting scores ≥normative values with either tofaci-tinib dose were significant for SF-36v2 PCS, MCS and PF,
function, fatigue and HRQoL scores comparable with those without arthritis or other chronic conditions than those receiving placebo.
Some differences in PROs were reported by patients receiving tofacitinib, compared with those receiving adalimumab. However, these active treatments have different modes of action (JAK inhibition and TNF inhi-bition, respectively),41 42 with distinct effects on down-stream intracellular signalling pathways that are likely to be complex and multifactorial.43 44 Therefore, it is diffi-cult to isolate the specific processes or pathways affected by JAK inhibition and TNF inhibition that give rise to differences in PROs in patients receiving tofacitinib and adalimumab, respectively.
This is the first study in csDMARD-IR patients with PsA to examine score changes in relation to MCIDs and normative values following treatment with tofacitinib. In another study, also reported in this issue, similar responses were reported by TNFi-IR patients with PsA receiving tofacitinib treatment over 6 months.45
A unique feature of this study is the evaluation of compo-nents of the FACIT-Fatigue instrument that provide infor-mation on the impact of tofacitinib on patients’ specific fatigue experience (perception and severity) and the impact on daily function. A limitation is that compar-isons with placebo were limited to the 3-month place-bo-controlled portion of the study. Also, this trial was not designed and was not powered to evaluate the non-inferi-ority or superinon-inferi-ority of tofacitinib as compared with adali-mumab; therefore, comparisons should be interpreted cautiously. Furthermore, the majority of patients were receiving concomitant csDMARDs, and a similar standard of care may not be accessible in all countries, which may impact on the reproducibility of these results. In addi-tion, use of ASQoL has not been specifically validated in axial PsA and may not be ideal for assessing peripheral PsA. Further PRO data for tofacitinib will be collected in the LTE study.
In conclusion, csDMARD-IR patients with PsA receiving tofacitinib 5 mg or 10 mg twice daily reported clinically meaningful improvements in PROs compared with placebo at month 3, which were maintained to month 12 and ≥normative values in up to 39% of patients receiving tofacitinib. Patients receiving tofacitinib reported similar improvements to those receiving the active control adali-mumab at the time points assessed. The results of this study provide scientific evidence to support decisions regarding clinical therapy and further support the use of JAK inhibition as a novel mechanism for treatment of PsA.
Author affiliations
1Division of immunology/rheumatology, Stanford University, Palo alto, california,
USa
2Department of rheumatology, University Hospitals leuven, leuven, Belgium 3Unidad reumatologica las americas S.c.P., Mérida, Yucatán, Mexico
4Swedish Medical center and University of Washington, Seattle, Washington, USa
on May 7, 2020 by guest. Protected by copyright.
5University of toronto, toronto Western Hospital, toronto, Ontario, canada 6Pfizer inc, groton, connecticut, USa
7Pfizer inc, collegeville, Pennsylvania, USa
Acknowledgements Some of the results reported in this study were previously presented at aaD-w 2017 (Strand V, et al. am acad Dermatol 2017;76:abstract aB109) and at acr 2017 (Strand V, et al. arthritis rheumatol 2017;69:abstract 596). the authors would like to thank the patients, investigators and study teams involved in the OPal Broaden study. this study was funded by Pfizer inc. Medical writing support, under the direction of the authors, was provided by anthony g Mccluskey, PhD, of cMc connect, a division of complete Medical communications ltd, glasgow, UK, and was funded by Pfizer inc, new York, nY, USa, in accordance with good Publication Practice (gPP3) guidelines (Ann Intern Med 2015;163:461-4).
Contributors all authors were involved in the analysis and interpretation of data and critically revising the manuscript for important intellectual content. all authors agree to be accountable for all aspects of the work and read and approved the final manuscript to be published.
Funding this study was funded by Pfizer inc.
Competing interests VS has received consulting fees from abbVie, amgen, astraZeneca, Bayer, Boehringer ingelheim, Bristol-Myers Squibb, celltrion, genentech/roche, gSK, Janssen, lilly, Merck, novartis, Pfizer inc, regeneron, Samsung, Sandoz, Sanofi and UcB. KdV is a consultant and advisory board member for Pfizer inc. Jac-c is an investigator for Pfizer inc. PJM has received research grants from abbVie, amgen, Bristol-Myers Squibb, celgene, Janssen, lilly, novartis, Pfizer inc, Sun and UcB; has acted as a consultant for abbVie, amgen, Bristol-Myers Squibb, celgene, corrona, Janssen, lilly, Merck, novartis, Pfizer inc, Sun, UcB and Zynerba; and has participated in speakers’ bureaus for abbVie, amgen, Bristol-Myers Squibb, celgene, genentech, Janssen, novartis, Pfizer inc and UcB. DDg has received research grants from abbVie, amgen, Bristol-Myers Squibb, celgene, Janssen, lilly, novartis, Pfizer inc and UcB and has acted as a consultant for abbVie, amgen, Bristol-Myers Squibb, celgene, Janssen, lilly, novartis, Pfizer inc and UcB. M-aH, Dg, cW and Jcc are shareholders and employees of Pfizer inc. tH is a shareholder, and was an employee, of Pfizer inc during the time of this analysis.
Patient consent not required.
ethics approval this trial was conducted in accordance with the good clinical Practice guidelines of the international conference on Harmonisation and with the principles of the Declaration of Helsinki. the trial protocol and all documentation were approved by the institutional review board or independent ethics committee at each investigational site.
Provenance and peer review not commissioned; externally peer reviewed.
data sharing statement Upon request, and subject to certain criteria, conditions and exceptions (see https://www. pfizer. com/ science/ clinical- trials/ trial- data- and- results for more information), Pfizer will provide access to individual deidentified participant data from Pfizer-sponsored global interventional clinical studies conducted for medicines, vaccines and medical devices (1) for indications that have been approved in the USa and/or eU, or (2) in programmes that have been terminated (ie, development for all indications has been discontinued). Pfizer will also consider requests for the protocol, data dictionary and statistical analysis plan. Data may be requested from Pfizer trials 24 months after study completion. the deidentified participant data will be made available to researchers whose proposals meet the research criteria and other conditions, and for which an exception does not apply, via a secure portal. to gain access, data requestors must enter into a data access agreement with Pfizer.
Open access this is an open access article distributed in accordance with the creative commons attribution non commercial (cc BY-nc 4.0) license, which permits others to distribute, remix, adapt, build upon this work non-commercially, and license their derivative works on different terms, provided the original work is properly cited, appropriate credit is given, any changes made indicated, and the use is non-commercial. See: http:// creativecommons. org/ licenses/ by- nc/ 4. 0/
RefeRences
1. Ritchlin CT, Colbert RA, Gladman DD. Psoriatic arthritis. N Engl J Med 2017;376:957–70.
2. Boehncke WH, Menter A. Burden of disease: psoriasis and psoriatic arthritis. Am J Clin Dermatol 2013;14:377–88.
3. Kavanaugh A, Helliwell P, Ritchlin CT. Psoriatic arthritis and burden of disease: patient perspectives from the population-based Multinational Assessment of Psoriasis and Psoriatic arthritis (MAPP) survey. Rheumatol Ther 2016;3:91–102.
4. Bergman M, Lundholm A. Mitigation of disease- and treatment-related risks in patients with psoriatic arthritis. Arthritis Res Ther
2017;19:63.
5. Singh JA, Strand V. Spondyloarthritis is associated with poor function and physical health-related quality of life. J Rheumatol
2009;36:1012–20.
6. Cauli A, Gladman DD, Mathieu A, et al. Patient global assessment in psoriatic arthritis: a multicenter GRAPPA and OMERACT study.
J Rheumatol 2011;38:898–903.
7. Fries JF, Spitz PW, Young DY. The dimensions of health outcomes: the health assessment questionnaire, disability and pain scales.
J Rheumatol 1982;9:789–93.
8. Finlay AY, Khan GK. Dermatology Life Quality Index (DLQI)--a simple practical measure for routine clinical use. Clin Exp Dermatol
1994;19:210–6.
9. Ware JE, Kosinski M, Bjorner JB, et al. User's Manual for the Sf-36v2 Health Survey. 2nd edn. Lincoln, RI: Quality Metric Incorporated, 2007.
10. EuroQol Group. EuroQol--a new facility for the measurement of health-related quality of life. Health Policy 1990;16:199–208. 11. Ogdie A, de Wit M, Callis Duffin K, et al. Defining outcome measures
for psoriatic arthritis: a report from the GRAPPA-OMERACT working group. J Rheumatol 2017;44:697–700.
12. Mease P, Hall S, FitzGerald O, et al. Tofacitinib or adalimumab versus placebo for psoriatic arthritis. N Engl J Med 2017;377:1537–50. 13. Gladman D, Rigby W, Azevedo VF, et al. Tofacitinib for psoriatic
arthritis in patients with an inadequate response to TNF inhibitors.
N Engl J Med 2017;377:1525–36.
14. Mease PJ, Antoni CE, Gladman DD, et al. Psoriatic arthritis assessment tools in clinical trials. Ann Rheum Dis 2005;64(Suppl 2):ii49–ii54. 15. Beaton DE, Bombardier C, Katz JN, et al. Looking for important
change/differences in studies of responsiveness. OMERACT MCID Working Group. Outcome measures in rheumatology. Minimal clinically important difference. J Rheumatol 2001;28:400–5. 16. Beaton DE, Boers M, Wells GA. Many faces of the minimal clinically
important difference (MCID): a literature review and directions for future research. Curr Opin Rheumatol 2002;14:109–14.
17. Taylor W, Gladman D, Helliwell P, et al. Classification criteria for psoriatic arthritis: development of new criteria from a large international study. Arthritis Rheum 2006;54:2665–73.
18. Felson DT, Anderson JJ, Boers M, et al. The American College of Rheumatology preliminary core set of disease activity measures for rheumatoid arthritis clinical trials. The Committee on Outcome Measures in Rheumatoid Arthritis Clinical Trials. Arthritis Rheum
1993;36:729–40.
19. Strand V, Boers M, Idzerda L, et al. It's good to feel better but it's better to feel good and even better to feel good as soon as possible for as long as possible. Response criteria and the importance of change at OMERACT 10. J Rheumatol
2011;38:1720–7.
20. Strand V, Sharp V, Koenig AS, et al. Comparison of health-related quality of life in rheumatoid arthritis, psoriatic arthritis and psoriasis and effects of etanercept treatment. Ann Rheum Dis
2012;71:1143–50.
21. Chandran V, Bhella S, Schentag C, et al. Functional assessment of chronic illness therapy-fatigue scale is valid in patients with psoriatic arthritis. Ann Rheum Dis 2007;66:936–9.
22. Rabin R, Gudex C, Selai C, et al. From translation to version management: a history and review of methods for the cultural adaptation of the EuroQol five-dimensional questionnaire. Value
Health 2014;17:70–6.
23. Doward LC, Spoorenberg A, Cook SA, et al. Development of the ASQoL: a quality of life instrument specific to ankylosing spondylitis.
Ann Rheum Dis 2003;62:20–6.
24. Strand V, Crawford B, Singh J, et al. Use of "spydergrams" to present and interpret SF-36 health-related quality of life data across rheumatic diseases. Ann Rheum Dis 2009;68:1800–4.
25. Strand V, Lee EB, Fleischmann R, et al. Tofacitinib versus methotrexate in rheumatoid arthritis: patient-reported outcomes from the randomised phase III ORAL Start trial. RMD Open
2016;2:e000308.
26. Krishnan E, Sokka T, Häkkinen A, et al. Normative values for the Health Assessment Questionnaire disability index: benchmarking disability in the general population. Arthritis Rheum 2004;50:953–60. 27. Strand V, Smolen JS, van Vollenhoven RF, et al. Certolizumab
pegol plus methotrexate provides broad relief from the burden of rheumatoid arthritis: analysis of patient-reported outcomes from the RAPID 2 trial. Ann Rheum Dis 2011;70:996–1002.
28. Strand V, Schett G, Hu C, et al. Patient-reported Health-related Quality of Life with apremilast for psoriatic arthritis: a phase II, randomized, controlled study. J Rheumatol 2013;40:1158–65.
on May 7, 2020 by guest. Protected by copyright.
http://rmdopen.bmj.com/
status (HAQ) and utility (EQ-5D) measures in psoriatic arthritis: results from a cross-sectional survey. Scand J Rheumatol
2010;39:303–9.
30. McInnes IB, Mease PJ, Schett G, et al. Secukinumab provides rapid and sustained pain relief in psoriatic arthritis over 2 years: results from the FUTURE 2 study. Arthritis Res Ther 2018;20:113.
31. Mease P, Strand V, Gladman D. Functional impairment measurement in psoriatic arthritis: importance and challenges. Semin Arthritis
Rheum 2018.
32. Biswas A. Number needed to treat. J Pract Cardiovasc Sci
2017;3:106–8.
33. Kavanaugh A, Mease PJ, Gomez-Reino JJ, et al. Treatment of psoriatic arthritis in a phase 3 randomised, placebo-controlled trial with apremilast, an oral phosphodiesterase 4 inhibitor. Ann Rheum Dis 2014;73:1020–6.
34. Kavanaugh A, McInnes IB, Krueger GG, et al. Patient-reported outcomes and the association with clinical response in patients with active psoriatic arthritis treated with golimumab: findings through 2 years of a phase III, multicenter, randomized, double-blind, placebo-controlled trial. Arthritis Care Res 2013;65:1666–73.
35. Gladman D, Fleischmann R, Coteur G, et al. Effect of certolizumab pegol on multiple facets of psoriatic arthritis as reported by patients: 24-week patient-reported outcome results of a phase III, multicenter study. Arthritis Care Res 2014;66:1085–92.
36. Strand V, Mease P, Gossec L, et al. Secukinumab improves patient-reported outcomes in subjects with active psoriatic arthritis: results from a randomised phase III trial (FUTURE 1). Ann Rheum Dis
2017;76:203–7.
38. Orbai AM, de Wit M, Mease P, et al. International patient and physician consensus on a psoriatic arthritis core outcome set for clinical trials. Ann Rheum Dis 2017;76:673–80.
39. Husted JA, Gladman DD, Farewell VT, et al. Health-related quality of life of patients with psoriatic arthritis: a comparison with patients with rheumatoid arthritis. Arthritis Rheum 2001;45:151–8.
40. Salaffi F, Carotti M, Gasparini S, et al. The health-related quality of life in rheumatoid arthritis, ankylosing spondylitis, and psoriatic arthritis: a comparison with a selected sample of healthy people.
Health Qual Life Outcomes 2009;7:25.
41. Li X, Jesson M, Lee J, et al. Characterization of a potent inhibitor of JAK kinases, CP-690,550, and inhibition of specific JAK/STAT pathways at efficacious exposures in a rodent model of arthritis. Chantilly, Virginia: 15th International Inflammation Research Association Conference, 2008.
42. Ma X, Xu S. TNF inhibitor therapy for rheumatoid arthritis. Biomed Rep 2013;1:177–84.
43. Aggarwal BB. Signalling pathways of the TNF superfamily: a double-edged sword. Nat Rev Immunol 2003;3:745–56.
44. Meyer DM, Jesson MI, Li X, et al. Anti-inflammatory activity and neutrophil reductions mediated by the JAK1/JAK3 inhibitor, CP-690,550, in rat adjuvant-induced arthritis. J Inflamm (Lond)
2010;7:41.
45. Strand V, de Vlam K, Covarrubias-Cobos JA, et al. Effect of tofacitinib on patient-reported outcomes in patients with active psoriatic arthritis and an inadequate response to tumor necrosis factor inhibitors in the phase III, randomized, controlled trial: OPAL Beyond. RMD Open 2018;4:e000808.
on May 7, 2020 by guest. Protected by copyright.