Abstract—Sandwich panels attracted designer's interest due
to its light weight, excellent corrosion characteristics and rapid installation capabilities. Sandwich panels have been implemented in many industrial applications such as aerospace, marine, architectural and transportation industry. Sandwich panels consist of two face sheets and core. The core is usually made of material softer than the face sheets. Most of the previous work deals with sandwich panel in the elastic range. However the current investigation unveils the effect of the core material stiffness on sandwich panel beyond the yield limit of core material. The modulus of elasticity ratio of the core (Foam) to face (sheet metal) is investigated by applying univariate search optimization technique. The load has been increased in steps in quasi–static manner till face sheets reach the yield point. The panel is modeled using a finite element analysis package. Simply supported boundary conditions are applied on all sides of the panel. The model has been validated against numerical and experimental cases that are available in the literature. In addition, experimental investigation has been carried out to validate the finite element model and to verify some selected cases. The finite element model shows very good agreement with the previous work and the experimental investigation. It is proved in this study that the load carrying capacity of the panel increases as the core material goes beyond the yield point. Load transmitted to the face sheets gets higher as the core stiffness gets softer. The stiffer the core material is, the closer the sandwich panel behavior gets to isotopic plate, i.e., face sheets are going to yield before core material.
Index Terms— Finite Element Analysis, Stress Optimization,
Sandwich Panel.
I. INTRODUCTION
Research efforts are continuously looking for new, better and efficient construction materials. The main goal of these researches is to improve the structural efficiency, performance and durability. New materials typically bring new challenges to designer who utilizes these new materials. In the past decades various sandwich panels have been implemented in aerospace, marine, architectural and transportation industry. Light-weight, excellent corrosion characteristics and rapid installation capabilities has created tremendous opportunities for these sandwich panels in industry. Sandwich panel normally consists of a low-density core material sandwiched between two high modulus face
1
Sultan Qaboos University, Mechanical Engineering Department, PO BOX 33, Al-Khod, Muscat 123, Oman, Fax: +968-2414-1316, Phone: +968-2414-2675, or, +968-2414-2655, [email protected], on leave from The University of Jordan, Mechanical Engineering Department, Amman 11942, Jordan.
2
Royal Jordanian Air force, Electro-Mechanical Department, Amman, Jordan, E-mail: [email protected]
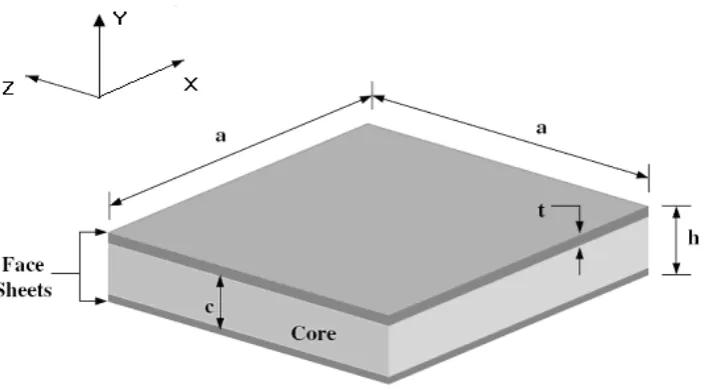
skins to produce a lightweight panel with exceptional stiffness as shown in Fig. 1. The face skins act like the flanges of an I-beam to provide resistance to the separating face skins and carrying the shear forces. The faces are typically bonded to the core to achieve the composite action and to transfer the forces between the components.
Work on the theoretical description of sandwich structure behavior began after World War Two. Reference [1] is the first book published about sandwich structures, followed by [2] and more recently [3]. Reference [4] developed a method to design for minimum weight, and reported the failure mode map of sandwich construction, without considering the post yield state of the sandwich structure.
Reference [5] reported that the load carried by sandwich structures continue to increase after core yielding. Knowing that the core could not carry additional load after yield, this increasing load carrying capacity of post yield sandwich structure initiates the postulation that the additional shear load was transferred to the face sheets. To account for the above-mentioned phenomenon, [6] developed a higher order theory by including a bilinear core material module. This theory yields a fairly accurate prediction on the deflection of a foam cored sandwich structure in four point bending [5]. In addition, this theory does not take into account the core compression under localized load, or any geometric non-linearity. The classical sandwich beam theory also assumes that in-plane displacements of the core through its depth are linear. In other words, it was assumed that the core thickness remains constant and cross-sections perpendicular to the neutral axis remain plane after deformation. This assumption is generally true for traditional core material such as metallic honeycomb. However, this assumption is not suitable for soft, foam-based cores, especially when the sandwich structure is subjected to a concentrated load [7]. With a much lower rigidity compared to metallic honeycomb, foam-based cored sandwich structures are susceptible to localized failure. Insufficient support to the face sheets due to core compression near the application points of concentrated loads can lead to failures such as face sheet/ core delamination, face sheet buckling, and face sheet yielding. This localized non-linearity is reported by many researchers such as [7]-[10]. The shear distribution at localized failure points has not been well defined. Reference [11] investigated the effect of localized strengthening inserts on the overall stiffness of a sandwich structure. This localized strengthening increases the rigidity of the sandwich structure, but the addition of high stiffness inserts complicates the manufacturing process of sandwich structure.
To design an efficient sandwich structure, it is vital to understand the behavior of each layer in the structure.
Effect of Core Material Stiffness on Sandwich
Panel Behavior Beyond the Yield Limit
Classical sandwich theory [1]-[3], higher order theory by [5] and high order theory developed by [12] could predict the sandwich panel behavior fairly accurate in the linear range. However, these theories could not give an accurate prediction of the sandwich structure behavior after core yielding. Large deflection of sandwich structures due to core yielding could vary the direction of the applied load on the structure.
Finite element (FE) analysis is utilized to investigate the response of sandwich panel under distributed load. Geometric nonlinearity and material nonlinearity are considered in this investigation to unveil the behavior of sandwich panel beyond core yielding. The effect of core stiffness is investigated. Four core materials are utilized to cover the stiffness range from 37.5 MPa to 402.6 MPa. Univariate search optimization technique is adopted in studying these parameters [13].
II. PHYSICAL MODEL
The sandwich panel consists of two face sheets made of metal. The thickness of each face sheet is t. Soft core of c thickness is sandwiched between those face sheets. The core material is made of foam which is soft compared to the face sheets. The panel is square in shape. The side length is designated by a, whereas the overall thickness is designated by h. Fig. 1 illustrates the sandwich panel geometry. The values of a, t and c are 608mm, 1.0mm and 50mm respectively.
This research takes into account the geometric non-linearity as well as the material nonnon-linearity. The following assumptions are made to simplify the model without losing the physics of the problem
Face sheets and core are perfectly bonded: no de-lamination occur between layers.
Face sheets remain elastic all the time: Due to the significantly higher yield strength and modulus of elasticity of the face sheets compared to the core, face sheets are assumed to remain elastic throughout the loading. The analysis stops when the face sheets start to yield.
Geometric non-linearity has a significant effect: Geometric non-linearity is considered to have significant effect on the load distribution on each layer of the sandwich structure.
The panel is simply supported from all sides.
Out of plane load is applied and varied in quasi-static manner.
Due to the symmetry only quarter of the sandwich panel is modeled. The loading area is square in shape; its side length is 100mm for full panel dimension. However for quarter model of the panel, the side length is 50mm. Fig. 2 illustrates this configuration. The load is applied to the sandwich top face sheet as a distributed load which is increased gradually (step by step) till face sheet stress reaches the yield limit of the face sheet material. A distributed load is applied on the top surface of the sandwich panel. The area on which the distributed load is applied is shown in Fig. 3 located at the middle of the top face sheet plate. The loading area at the middle top face of sandwich
panel is square area.
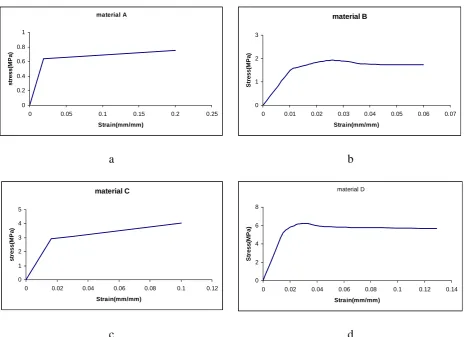
Four different materials are investigated. The influence of core material stiffness on the performance of the sandwich plate is studied. Their modulus of elasticity is varying from 37.5 MPa through 138.6 MPa, 180 MPa, and 402.6 MPa. The table below presents the materials used in the current investigation. The first row presents the mechanical properties of the face sheet material whereas the rest are the core materials. Fig. 3 presents the corresponding stress strain curves of the core materials A through D shown in Table 1. These materials are selected because of their wide usage in the industry.
III. FINITEELEMENTMODEL
The FE package used in the development of the FE models is I-DEAS (Master Series 10, 1999). The relatively robust and user-friendly solid modeling and FE meshing interface are the main advantages of this solid modeling/ finite element software.
The non-linear analysis capabilities of I-DEAS are utilized in carrying the FE analyses of the model which includes geometric non-linearity and material nonlinearity. Load is applied to the model in quasi-static manner by utilizing the load increment module of I-DEAS. Load increments are applied slowly during the analysis (i.e. simulates exactly the real life). The type of analysis done for this research effort is “static, non-linear analysis”.
The symmetric nature of the problem allows only quarter of the whole panel to be modeled and meshed. The boundary conditions applied are shown on Fig. 4. The two planes of symmetry of the panel have symmetry boundary conditions. A simply supported boundary condition is applied to the other two sides of the quarter panel. A distributed load is applied on the top surface of the sandwich panel. The area on which the distributed load is applied is shown in Fig. 2.
The FE software is set in such a way to solve the model at each load step. This allows each case to be done in a single run of the finite element model. As a result of this, the model would take less memory space because one single solid model and FE model can be used for all load steps of each case.
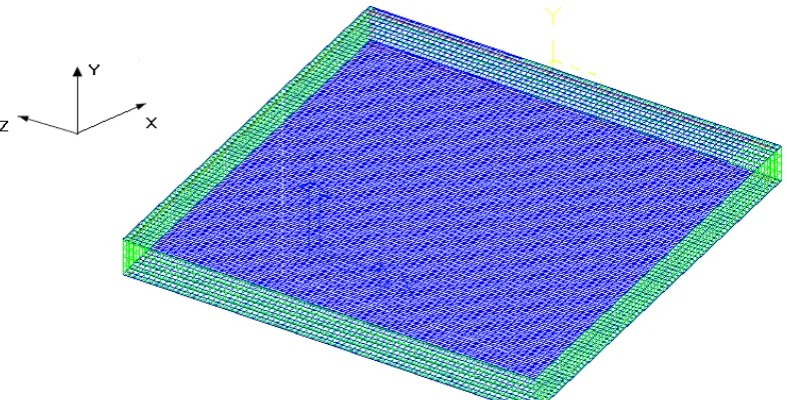
The numerical model utilizes the map meshing facility in I-DEAS. By controlling the number of nodes along each edge of the solid model, this function provides full control of the mesh size. The mesh is refined till the changes in the result are less than 0.5%. Constant mesh density is applied using the mapped meshing function. This is important because constant mesh density ensures that data collected from any region of the plate are of the same degree of resolution. Three-dimensional (solid) brick elements are used in this analysis. Second order (parabolic) brick elements are chosen over the first order (linear) brick elements in order to better interpolate the data between nodes. Fig. 5 shows the FE model mesh of the sandwich panel.
the changes of the yield criterion as a result of plastic straining. Only the core elements are assigned a yield function due to the assumption that only core yielding occurs throughout the loading process. The face sheets are
[image:3.595.123.477.126.321.2]assumed to remain elastic at all the time; hence no yield function is assigned to the face sheet elements. However the yield point of the face sheet material is fed to the software to be used as indicator for stopping the analysis.
[image:3.595.150.447.401.665.2]Fig. 1: Illustration sandwich plate geometry.
Table 1: Compression of sandwich panel material properties Ma terial Proper ty s o ur ce Youn g's m o d u lus (MP a ) Poiss o n's r a ti o Shear m o dulu s (M pa ) Shear stre ngth (M pa ) 0. 2% o ffse t yi el d st reng th (M pa) Str a
in at yield
popup
(mm/mm)
Face sheet : Aluminum 3003-H14 [14] 69,000 0.33 25,000 120 145 Not available
Core A : AirexR63.50 [15] 37.5 0.335 14.05 0.45 0.637 0.019
Core B: H100 [16] 138.6 0.35 47.574 1.2 1.5 0.0108225
Core C: Herex C70.200 [15] 180 0.37 65.69 1.6 2.554 0.0162
Core D: H250 [16] 402.6 0.35 117.2 4.5 5 0.014
a b
c d
Fig. 3: Stress strain curve for a) material A: AirexR63.50 [15], b) material B: H100 [16], c) material C: Herex C70.200 [15], d) material D: H250[16] material A 0 0.2 0.4 0.6 0.8 1
0 0.05 0.1 0.15 0.2 0.25
Strain(mm/mm) st ress( M P a) material B 0 1 2 3
0 0.01 0.02 0.03 0.04 0.05 0.06 0.07
Strain(mm/mm) S tr ess( M P a) material C 0 1 2 3 4 5
0 0.02 0.04 0.06 0.08 0.1 0.12
Strain(mm/mm) str e s s (M P a) material D 0 2 4 6 8
0 0.02 0.04 0.06 0.08 0.1 0.12 0.14
Fig. 4: Sandwich panel boundary condition and loading
Fig. 5 Meshed quarter sandwich plate
IV. MODELVERIFICATION
Well known cases have been solved using the FEM. The relative difference in the results is less than 1%. To be more confident of the FE model and its results, experimental verification is carried out. The sandwich panel used in the experimental investigation is made of polyurethane foam and steel sheets. The mechanical properties are obtained experimentally for both the core and the sheets according to ASTM Designation: C 365 – 00 and ASTM Designation: D 638 – 00 respectively [17]-[18].
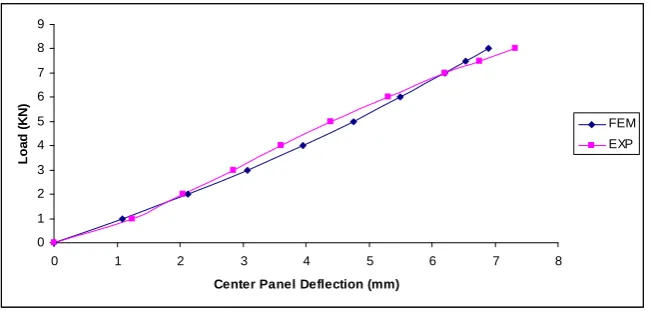
The relation between the applied load and the deflection of the specimen center point are presented in Fig. 6 for both the experimental and FE model. It may be seen that the results are in very good agreement. The maximum relative
error does not exceed 7%. The experimental tests are repeated more than two times and the average values are plotted in Fig. 6.
V. RESULTS AND DISCUSSION
[image:5.595.96.490.327.527.2]Fig. 6: Comparison of load versus center deflection for core thickness = 49 mm, Sheet Thickness = 0.5 mm, applied load area = 200 mmX200 mm.
As the core starts to yield, its maximum-stress increment-rate starts to decrease (see Fig. 9) while the maximum-stress incremental-rate of the bottom - face – sheet starts to increase. This means that the load is being transferred to the face sheet-metal. This is the main advantage of increasing the load beyond the yield limit of the core material.
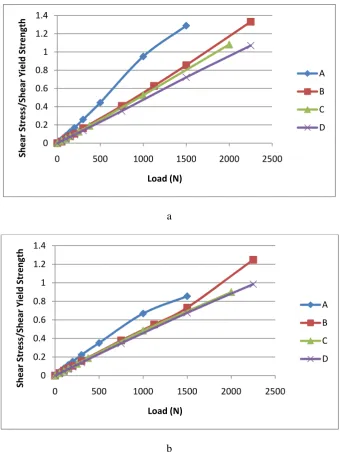
Fig. 8 and 9 demonstrate the effect of material stiffness. Since the modulus of elasticity is EA < EB < EC < ED, it can be seen that the softer material is, the more load is transferred from core material to the sheet metal as the core starts to yield. It is obvious that the load carrying capacity of the panel increases as its core material stiffness increases. It may be seen that in Fig. 8 the core material is still within the elastic range for C and D; however in Fig. 9 in the bottom face sheet starts to yield (entering the plastic range).
It is demonstrated in Fig.’s 8 and 9 that as the stiffness of core material increases the load carrying capacity of panel increases. The increment of shear stress with respect to strain decreases as the load increases. In yield range, the post yield deformation rate of the core material is higher than that of the elastic range for the same load increment (see Fig. 10). This deformation works as a mechanism of transferring the excess load to the face sheets.
For example, panel A in Fig.’s 8 and 9 its core reaches yield point at 800kPa load and it is stress stays constant while the bottom sheet stress keeps increasing.
As illustrated in Fig. 7, the metal material (face sheet) starts to yield (entering the plastic range) close to the support (where the boundary conditions are applied). This is physically true, because the distributed load over the loading area becomes reaction force concentrated on the strip area on which the boundary conditions (simply supported boundary condition) are applied, i.e., distributed load is
converted to concentrated load. So the area where the boundary conditions are applied reaches the yield stress range before any other part of the panel. The graphs show that sheet material D has reached the yield point before the core material. This can be referred to the high stiffness of its core material, i.e., the panel gets closer in its behavior to isotropic plate.
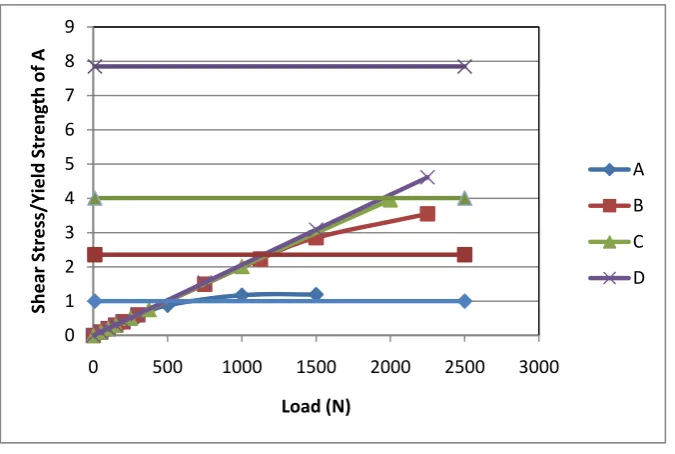
To have a better reading of the results, the ratio of the stress to the shear yield strength of material A is plotted against the load for all core materials. Also straight horizontal lines are plotted to show the yield limit of each material. Each yield line has mark similar to the correspondent material. It is obvious that all curves within the elastic range are coincident. It can be seen that the load carrying capacity has increased for materials C and D on the expense of low loading for the core material. The worst situation is for material D where the stress is almost half way to the yield limit. The material C is not much better than D because both the sheet metal and the core reach the yield limit at the same load. Materials A and B have gone beyond the yield limit and provide increase in the load carrying capacity. The percent increase in the load carrying capacity against the core modulus of elasticity is plotted in Fig. 12. Increasing the stiffness beyond 180Mpa for core material is of no benefit in gaining higher load carrying capacity as a result of increasing the load beyond the core yield limit. It may be seen that the optimum stiffness for this case of study is close to 125Mpa.
The results of this work are generated according to the univariate search optimization technique [13]. Based on this numerical optimization technique, the data has been produced by utilizing the parametric optimization module of ‘I-DEAS’ software.
0 1 2 3 4 5 6 7 8 9
0 1 2 3 4 5 6 7 8
Center Panel Deflection (mm)
Loa
d (
K
N
)
FEM
Fig. 7: Demonstration of the core plastic deformations contour for one of panels.
Fig. 8: Maximum core shear stress to yield strength of each material versus load. 0
0.2 0.4 0.6 0.8 1 1.2 1.4 1.6
0 500 1000 1500 2000 2500
Shear
Stress/Shear
Yield
Strength
Load (N)
A
B
C
[image:7.595.128.469.378.582.2]a
[image:8.595.111.453.46.504.2]b
Fig. 9: Illustration of Maximum shear stress to shear yield strength of sheet metal versus load for (a) Lower Sheet, (b) Upper Sheet
Fig. 10: Schematic drawing of the shear stress for both face sheets and the core within plastic range.
0 0.2 0.4 0.6 0.8 1 1.2 1.4
0 500 1000 1500 2000 2500
Shear
Stress/Shear
Yield
Strength
Load (N)
A
B
C
D
0 0.2 0.4 0.6 0.8 1 1.2 1.4
0 500 1000 1500 2000 2500
Shear
Stress/Shear
Yield
Strength
Load (N)
A
B
C
[image:8.595.154.442.570.686.2]Fig. 11: Illustration of the core materials shear stress to the yield strength of A versus the load including theyield limit of each material.
Fig. 12: Illustration of the percent increase of load carrying capacity against the stiffness of core material.
VI. CONCLUSIONS
Investigation of sandwich panel behavior beyond core material yield is carried out. The investigation is accomplished in sight of the core material nonlinearity and the geometric nonlinearity of the whole panel.
FE model is generated using ‘I-DEAS’ software. This model is validated against analytical cases available in the literature. To assure model accuracy experimental investigation for selected cases is also carried out and compared with FE model. The model shows very good agreement with the previous work as well as the experimental one.
The effects of core material stiffness necessary in designing sandwich panels are unveiled. It is also proved that the load carrying capacity of sandwich panel can be improved by loading the panel beyond the core yield limit.
This load is going to be transmitted to the face sheet as long as the core material is relatively soft.
Increasing the stiffness of the core material to a certain extent leads to face sheet yielding before the core material. It is proved that increasing core stiffness increases the load carrying capacity of the sandwich panel.
ACKNOWLEDGMENT
The Authors would like to express their gratitude to MAANI Prefab, Amman, Jordan, for their support.
REFERENCES
[1] F. J. Plantema, Sandwich Construction, John Wiley and Sons, New York, 1966.
[2] H. G. Allen, Analysis and Design of Structural Sandwich Panels, Pergamon Press, Oxford, 1969.
[3] D. Zenkert, An Introduction to Sandwich Construction, (EMAS), The Chameleon Press Ltd., London, 1995.
0 1 2 3 4 5 6 7 8 9
0 500 1000 1500 2000 2500 3000
Shear
Stress/Yield
Strength
of
A
Load (N)
A
B
C
D
0 10 20 30 40 50
0 50 100 150 200
%
Relative
Incr
ea
se
of
load
[image:9.595.130.467.323.513.2][4] T.C. Triantafillou, and L. J. Gibson, “Minimum Weight of Foam Core Sandwich panels for a Given Strength”, Material Science and Engineering, vol. 95, 1987, pp. 55–62.
[5] L. L. Mercado, D. L. Sikarskie and I. Miskioglu, “Higher order theory for sandwich beams with yielded core”, Proceedings of ICSS-5 Conference, Zurich; September 2000, pp. 141–53.
[6] L. L. Mercado and D.L. Sikarskie, “On Response of a Sandwich Panel with a Bilinear Core”, Mechanics of Composite Materials and Structures, vol. 6, 1999, pp.57–67.
[7] O. T. Thomsen, “Theoretical and Experimental Investigation of Local Bending Effects in Sandwich Plates”, Composite Structures, vol. 30 no. 1, 1995.
[8] O. T. Thomsen, ““Localized Bending Effects in Sandwich Panel,. Photoelastic Investigation versus High Order Sandwich Theory Results”, Composite Structures, vol. 37, no. 1, 1997, pp. 97-108. [9] G. Caprino, A. Langelan, “Study of 3 pt. Bending Specimen for Shear
Characterization of Sandwich Cores”, Journal of Composite Materials, vol. 34, no. 9, 2000, pp. 791-814.
[10] E. E. Gdoutos, I. M., Daniel, K. A. Wang, and J. L. Abot, “Non-linear Behavior of Composite Sandwich Beams in Three-point Bending”,
Experimental Mechanics, vol. 41, no. 2, June 2001, pp. 182–189. [11] Miers, S.A., “Analysis and Design of Edge Inserts in Sandwich
Beams”, Master of Science Thesis, Michigan Technological University, 2001.
[12] Y. Frostig, M. Baruch, O. Vilnai and I. Sheinman, “Higher-Order Theory for Sandwich Beam Behavior with Transversely Flexible Core”, Journal of Engineering Mechanics, vol. 118 no. 5, 1992. [13] Steven C. Chapra and Raymond P. Canale, Numerical Methods for
Engineers, McGraw-Hill. 2006.
[14] H.E. Boyer and T.L. Gall “Metals Handbook”, American Society for Metals, (Eds.), 1991.
[15] T. Rao, Study of Core Compression Using Digital Image Correlation (DIC), Master of Science Thesis, Michigan Technological University, 2002.
[16] W. Kuang-An, “Failure Analysis of Sandwich Beams”, Doctor of Philosophy Dissertation, Northwestern University, 2001
[17] “C 393-94 Standard Test Method for Flexural Properties of Sandwich Constructions”, Annual Book of ASTM Standards, vol. 15, no. 3, 1995.