Abstract— This paper discusses the potential of Particle Swarm Optimisation (PSO) for inducing Bayesian Networks (BNs). Specifically, we detail two methods which adopt the search and score approach to BN learning. The two algorithms are similar in that they both use PSO as the search algorithm, and the K2 metric to score the resulting network. The difference lies in the way networks are constructed. The CONstruct And Repair (CONAR) algorithm generates structures, validates, and repairs if required, and the REstricted STructure (REST) algorithm, only permits valid structures to be developed. Initial experiments indicate that these approaches produce promising results when compared to other BN learning strategies.
Index Terms—Particle Swarm Optimisation, Bayesian Network Construction.
I. INTRODUCTION
Many algorithms have been developed which induce the structure of Bayesian Networks (BNs). In general, learning the structure from a dataset is regarded as a NP-hard problem [1]. Reference [2] shows through complexity analysis the extent of difficulty with the task. The underlying challenge in deriving an efficient network relates to the large cardinality of the search space. Some algorithms attempt to reduce cardinality by assuming knowledge about the ordering of nodes in a network [3, 4]. However, in a domain where such expertise is unavailable, or the number of domain variables is large, defining the ordering may not be possible.
An alternative approach to the use of exhaustive searches is to employ heuristic search techniques. Work in this area can be divided into two main approaches: those that attempt to measure the dependencies of the underlying model, and algorithms that search for a structure that best represents the data. Our research extends the work performed in the second of these two areas.
We examine the use of Particle Swarm Optimisation (PSO) to derive an optimal Bayesian network. Although other evolutionary approaches have been examined for BN
Manuscript received March 22, 2007. This work was supported in part by the Engineering and Physical Sciences Research Council under Grant GR/S78148.
J. Cowie is with the Department of Computing Science, University of Stirling, FK9 4KA, U.K. (phone: +44 1786 467446; fax: +44 1786 464551; email: [email protected]).
L. Oteniya is with the Department of Computing Science, University of Stirling, FK9 4KA, U.K. (email: [email protected]).
R. Coles is with Kildean Hospital, Stirling, FK8 1RW, U.K. ([email protected]).
structuring, PSO has yet to be applied in this context, thus rendering our research as novel and highly relevant to the BN community.
In Section II we discuss existing methods for deriving BNs, identifying both statistical and heuristic approaches. Our research examining the use of PSO is detailed in Section III and the two algorithms developed are introduced. Section IV discusses the experiments conducted and the results to date are provided in Section V. We conclude in Section VI with a discussion of findings and directions for further research.
II. METHODS FOR CONSTRUCTING BAYESIAN NETWORKS
Many BN learning algorithms have been developed which employ heuristics to derive a network. They can be broadly grouped into two categories: dependency analysis approaches and methods based on search and score strategies. A review of these two approaches is provided below:
A. Algorithms using Dependency Analysis
Automatic learning of a BN from a dataset seeks to generate a directed acyclic graph (DAG) reflecting the dependencies existing between variables [5]. Dependency analysis techniques attempt to produce a list of conditional (in)dependencies using statistical conditional independence (CI) tests. Evaluation of the networks derived is performed by testing conditional independence (CI) between tuples of variables.
The most popular CI based algorithm is the PC algorithm [6]. It begins with the complete undirected graph, then ‘thins’ the graph by removing arcs with zero order CI relations, then thins again with first order conditional independence relations, and so on until an optimal BN is generated.
One of the main disadvantages of this technique is the number of tests required to derive the final network structure. CI based approaches become quickly computationally infeasible due to the number and complexity of the tests performed, thus reducing the efficiency of the algorithm [7-9].
B. Search and Score methods
Search and score approaches seek to discover the probabilistic dependency network which most likely generated a dataset [8]. This is typically achieved by an efficient search engine which is guided by an evaluation function. The approach begins with a graph containing no arcs, then recursively adds, deletes, or reverses the direction of arcs in an attempt to find the structure that maximizes the score. The best
Particle Swarm Optimisation for learning
Bayesian Networks
scoring network represents the graph that is most representative of the data.
1) Search strategies
Search and score methods can be divided into sequential approaches (such as simulated annealing) and population-based approaches (such as genetic algorithms). One disadvantage of sequential approaches is that they are strongly subject to local minima given that they only refine a single candidate solution [10]. Using a population-based approach is a means of overcoming this drawback. It is a population-based approach on which our research is built.
Population-based search and score algorithms for BN learning are generally nature-inspired. Several researchers have applied different nature-inspired techniques to the problem of BN structure learning. Such techniques include ant colony optimization [11], genetic programming [12], and artificial immune systems [13].
One of the most popular nature-inspired approaches used for BN learning is Genetic Algorithms (GAs). There exists a significant body of published literature which documents the use and empirical evaluation of genetic algorithms for deriving a Bayesian network. References [4, 14, 15] detail much of the work in this area.
Outside the field of genetic algorithms and the other approaches listed above, the amount of research conducted in the area of nature-inspired algorithms is relatively sparse. To the best of the authors’ knowledge, there is no published literature or evidence to suggest that the use of Particle Swarm Optimisation (PSO) has been adopted for network derivation. Although the evidence in the literature suggests that GAs produce good results for BN learning, we believe that there is scope for PSO to provide comparable if not better results.
2) Scoring metric
The Cooper and Herskovits’s metric (CH/K2 metric) [8] is a widely used evaluation measure used in learning BNs. The metric calculates the probability of a network structure being representative of a dataset by calculating the joint probability of a BN and a dataset. It is derived by assuming uniform prior distributions on the values of an attribute for each possible instantiation of its parent attributes. K2 is detailed in this paper, as it the metric we adopt in our research.
III. PROPOSED APPROACH
Our particular interest lies with the use of PSO for learning a BN structure. PSO [16] emerged from experiments with algorithms that modeled the flocking behaviour seen in many species of birds [17]. In PSO, particles fly through a search space, hunting for an optimal solution by means of socio-cognitive theory [18], where particles evaluate and compare themselves to others, and imitate the behaviour of those who are regarded as more successful in the search. With each iteration of PSO, particles compare their current position with that of superior neighbours, and calculate a trajectory and associated velocity to determine where they should move to in the next iteration of the algorithm.
PSO is a population based stochastic search heuristic where the population is initialized with random variables, and each
individual in the swarm is assigned a fitness score. With each iteration, a particle’s personal best (pBest) is referenced as well as the swarm’s global best score (gBest). It is these two factors that influence where the particle moves to in the next iteration. The original PSO algorithm was designed for use with real numbers, however this approach has been extended to include a binary representation of the approach. It is this version of PSO that our technique utilizes.
Evidence from the literature suggests that for certain problems, PSO can be seen as a superior technique to GAs. For example, [19] compares the use of GAs and PSO techniques to evolve an optimal chemotherapy schedule for patients suffering from cancer. Their results concluded that PSO was able to find feasible regions for possible solutions faster than GAs. In addition, PSO was successful in finding a better solution to the problem than the GA approach. Other examples include the work of Mouser and Dunn [20], whose research shows PSO outperformed GAs when designing an optimal aircraft design. Furthermore there is published research that shows PSO to have the same effectiveness (finding the true global optimal solution) as GAs, but with significantly better computational efficiency (less function evaluations) [21].
Although the research detailed above shows PSO as comparable or outperforming GAs in significantly different application areas to our own, we hypothesize that PSO will outperform GAs when applied to the problem considered in this research, as the fundamentals of the task are essentially the same as those reported. That is, the technique is used to search a large solution space for a solution which satisfies a given fitness function.
Population-based approaches to BN learning, particularly when the ordering assumption is not upheld (as is the case here), tend to require apparatus to validate solutions in the population. For example, in the GA approach, crossover and mutation are not closed operators, thus there is a chance that these operators may generate structures that do not respect DAG conditions. Accordingly, a ‘repair’ strategy is widely used to convert an illegal solution into a legal solution. In a similar way, the PSO approach can also find solution encodings which violate DAG conditions, thus again, a repair strategy is required.
Our initial approach to using PSO for BN learning began by investigating PSO as a search heuristic for Bayesian network learning and used a repair strategy to guarantee DAG conditions. One of the primary concerns of this approach is that by using a random repair strategy (as our approach does), we run the risk of randomly jumping through search space rather than learning from previous generations as to where the best areas of search space lie.
A second approach was developed which avoids the issue of repair operators by only permitting legal structures to be generated. The possible concern of this strategy is that by never allowing illegal structures to be generated, potentially high scoring structures may be overlooked.
C B A
could be when solutions appear to have converged on the best scoring network, or when a specified number of iterations have been performed.
Sections III.A and III.B to follow detail the two algorithms developed: the CONstruct And Repair (CONAR) algorithm which generates structures, validates, and repairs if required, and the REstricted STructure (REST) algorithm, which only builds valid structures.
Initialize population Initialize pBest Select arbitrary gBest Repeat
For each particle Determine pBest Determine gBest Update velocity Update position → P’
[CONAR only]
If P’ represents illegal structure
Repair
Update position End If
End For
Until termination criterion is met
A. CONAR
The CONAR process is based on the search and score approach, using PSO as its search mechanism and K2 as the scoring metric. K2 is widely accepted metric for evaluating network structures [4, 11]. At each iteration of the PSO algorithm, the K2 metric is used to determine the current ‘best’ network, and the results are used to guide the direction of search in the subsequent iteration.
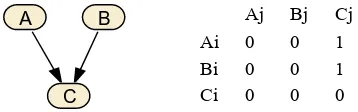
The network structure generated with each iteration of CONAR is represented as a connectivity matrix (C). The connectivity matrix C has n rows and n columns (where n is the number of variables, and i infers the row, and j the column) where
Cij = 1 if i is a parent of j
[image:3.595.44.293.197.383.2]0 otherwise
Figure 1 shows an arbitrary BN structure, consisting of n=3 nodes and 2 arcs and the corresponding connectivity matrix.
Thus, each particle (p) in the swarm is composed of n x n binary dimensions. Furthermore, each dimension of a particle p takes on the value of exactly one element, Cij, in C. Therefore, a particle represents precisely one point in the search space, which in turn represents a candidate BN structure. As the node
ordering assumption is relaxed, a given particle can be represented as the flattened binary encoding of the matrix in the following form:
C11, C12, …, C1n, C21, C22, …, C2n, …, Cn1, Cn2, …, Cnn
1) Illegal structures
The CONAR update operator is not closed with respect to DAG conditions and as such, it is possible for the algorithm to generate invalid structures. This is caused primarily by the choice of solution representation and the stochastic nature of the PSO velocity update algorithm. An example of an illegal structure is shown in Figure 2, where a self-cycle exists for Node A.
CONAR identifies cycles in a 3-stage process where it firstly detects self-cycles, then bi-cycles, and lastly regular-cycles. The method by which these are determined, and the repair strategies adopted are outlined below.
a) Repairing self-cycles
A self-cycle occurs when a node has an arc which points directly to itself. An example of a self-cyclic arc can be seen graphically in Figure 2. In the connectivity matrix, a self-cycle arc is identified by the presence of a ‘1’ in any element along the diagonal; element 1 in the example shown in Figure 2. The repair strategy is simply to replace the value in the offending element of the connectivity matrix with a ‘0’.
b) Repairing bi-cycles
Bi-directional cycles, as shown in Figure 3, occur when two nodes in a generated structure are seen to influence each other. In Figure 3, we see the scenario where Node A influences node B, and in turn, Node B influences Node A. Currently, CONAR removes one of the arcs at random in order to resolve the conflict. As such, there is a 0.5 probability that the optimal arc is lost.
c) Repairing regular cycles
Regular cycles are characterized by three or more directed arcs forming a cycle, as shown in Figure 4. Here, Node A influences node C, Node C influences Node B, and Node B influences Node A. Such cycles are identified using Warshall’s algorithm [22], which calculates whether a path exists from
Aj Bj Cj
Ai 0 0 1 Bi 0 0 1 Ci 0 0 0
Aj Bj Cj
Ai 1 0 1 Bi 0 0 1 Ci 0 0 0
Aj Bj Cj
[image:3.595.314.500.253.318.2]Ai 0 1 1 Bi 1 0 1 Ci 0 0 0 Fig 3: Bi-cycle BN with corresponding connectivity matrix
[image:3.595.322.506.501.574.2]C B A
Fig 2: Self-cycle BN structure with corresponding connectivity Table I: Pseudocode of CONAR and REST algorithms
[image:3.595.71.250.620.676.2]Node X to Node Y (transitive closure). Sub-graphs with regular cycles are currently repaired in the same fashion as the bi-cyclic graphs, where one of the offending arc is removed randomly.
Although the strategies outlined above for repairing illegal structures are simple in their approach, it was felt that these represented a good starting point for evaluating the potential of PSO for BN learning. It is our intention to investigate the use of more complex strategies such as utilizing the decomposability property of the K2 metric to determine arc importance. This is discussed further in Section VI.
B. REST
The REST algorithm is similar to CONAR in that it again is built upon the search and score approach, using PSO as the search method and K2 as the scoring metric. However, unlike CONAR which permits both legal and illegal BN to be generated, REST restricts the structures generated to those that contain no cycles. REST was developed in order to evaluate which of the two strategies for BN learning results in a better scoring network.
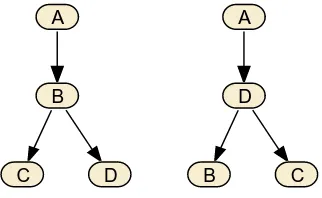
CONAR encodes a BN structure as an n x n connectivity matrix. However, if we restrict use of the matrix to the upper triangular matrix which excludes the diagonal, the binary string of this representation will always represent a legal encoding. This representation is referred to as a triangulated connectivity matrix (TC) and is the representation used by REST. However, just adopting this policy alone is too restrictive, as only a subset of possible legal network structures can be represented. In the example shown in Figure 5, BN1 can be represented, but BN2 cannot.
Node B can be the parent of Node D if we assume that Node B comes before Node D. However, Node D cannot be the parent of Node B, if that same assumption of node ordering is enforced. However, our aim is to derive BNs without the need for prior knowledge of orderings. This is achieved by virtue of the acyclic property inherent in the triangulated connectivity matrix. The TC matrix representation is still adopted but a
mapping strategy is generated for each possible permutation of the nodes. This allows all possible legal structures to be represented using the TC matrix. Thus, using our mapping strategy, the representation of BN2 is represented as the 5th
permutation of ABCD, ADBC. This information would be represented as an 11 bit string where from left to right, bits 1-6 represent the values in the TC matrix, and bits 7 – 11 are the binary representation of the permutation. For BN1 and BN2 we would have the following strings respectively [110110 00001], [100110 00101]. Figure 6 shows the corresponding matrices for BN1 and BN2.
IV. EXPERIMENTS
To evaluate the effectiveness of our PSO approaches, a set of experiments were performed. The experiments were conducted using the WEKA tool [23]. WEKA facilitates the use of different search algorithms and scoring metrics and thus allowed us to compare different approaches in the same development environment.
In these experiments, CONAR and REST were tested using the ASIA model dataset [24] to identify their ability to generate an optimal BN. To evaluate their effectiveness against other methods, we also performed experiments using the K2 algorithm at generating the Asia network.
A. K2 Algorithm
The K2 algorithm [8] is a well-known method for learning BNs. The algorithm uses the K2 metric to evaluate the score of a resulting BN. K2 requires two parameters: a domain variable order and an upper bound for the number of parents variables permitted. K2 searches for the best set of parents a variable has within the previous subset of variables.
As discussed in Section III, CONAR and REST do not use node ordering information to generate a BN. This is seen as one of their advantages. However, it is recognized that to test the three approaches fairly, the ordering requirement of the K2 algorithm should be considered. As such, we tested two versions of K2, referred to as K2_O (the standard K2 algorithm that uses node ordering as an input to the algorithm) and K2_NO (that does not take node ordering into account). As K2 is known to operate best when node ordering is given, a compensation factor is incorporated into the experiments such that the K2_NO method is not disadvantaged. K2_NO is run 10n times (where n is the number of variables), while CONAR, REST and K2_O are only executed 10 times. This approach is recognized by other researchers as a sensible way to compare K2’s effectiveness when no prior node ordering information is given [25].
Aj Bj Cj
Ai 0 0 1 Bi 1 0 0 Ci 0 1 0
Aj Bj Cj Dj
Ai - 1 1 0
Bi - - 1 1 Ci - - - 0 Di - - - -
[image:4.595.52.232.137.193.2]Aj Dj Bj Cj Ai - 1 0 0 Di - - 1 1 Bi - - - 0 Ci - - - - Fig 4: Regular cycle BN with corresponding connectivity
matrix C
B A
Fig 5: Bayesian Networks BN1 and BN2 D
B C
A
B
C D
[image:4.595.316.549.220.291.2]A
[image:4.595.84.245.541.640.2]B. CONAR and REST parameters
CONAR and REST were initialized with 80 particles (10 x n, where n is the number of variables), and executed over 100 – 1000 iterations (in step sizes of 100). Executing the two algorithms over different iterations allows us to evaluate whether a better scoring BN can be generated by letting the algorithms run for a longer period of time.
V. RESULTS
[image:5.595.314.547.179.344.2]The results from executing the CONAR and REST algorithms show no statistical significant difference in the score of the BN generated from 100 iterations and that of the BN generated from 200 iterations. The mean score of the BN generated from 100 runs was -22525.79 (2dp) and -22529.06 for CONAR and REST respectively. Similarly, there was no statistical significance between the mean scores generated from runs 200 – 1000. We can therefore conclude that although a slightly better scoring BN was achieved by increasing the number of iterations, that there is no significant gain from executing the algorithms for more than 100 generations. Table II provides the mean best score, standard deviation, standard error and the 95% confidence intervals for CONAR and REST when the algorithms are generated for 100 runs.
Table II: Statistics for 100 iterations of CONAR and REST
[image:5.595.44.290.409.476.2]The results obtained from executing the K2_O and K2_NO algorithms show that although as compensation for excluding node orderings, K2_NO is run 80 times, it produces the worst scoring BN. K2_O produces a higher scoring network, however its score is not as high as those generated by the networks derived by CONAR and REST. These results are highlighted further in Figure 8, which show there is a high degree of significance in the results produced by CONAR and REST.
Table III: T-test results
Two-sample T-tests where unequal variances are assumed were performed to evaluate the differences between the results. Three tests were performed: TT1(comparing CONAR with REST), TT2(comparing REST with K2_O), TT3 (comparing
K2_O with K2_NO). The results are given in Table III. As can be seen from Table III, the P-values for each test are all very close to zero. There is marginal significance between the scores of BNs generated by CONAR and REST. However, there is high significance between REST and K2_O and K2_O and K2_NO. This validates further the significance of our findings, and clarifies the difference in the results obtained.
The known score of the original Asia network is -22521.95. As shown in Table I, the results indicate that all methods come close to this score but none actually achieve it. However, it should be noted that the maximum scores for each set of iterations performed by CONAR and REST outperform the original score when the algorithms are ran for 200 iterations or more. In addition, the mean score for CONAR executed over 300 iterations is -22521.13, and therefore on average, returns networks that outperform the original.
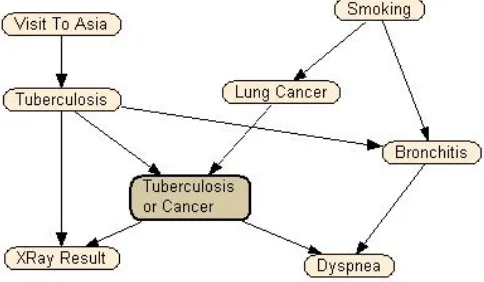
The actual BN derived by the best scoring algorithm CONAR is depicted in Figure 9. As can be seen, it is similar to the known network representing the Asia dataset, but an additional 2 arcs are included (Tuberculosis → Bronchitis and Tuberculosis → XRay Result), giving a Hamming Distance of 4 between the two structures.
CONAR REST K2_O K2_NO
Mean -22525.79 -22529.06 -22534.63 -22543.81 Std.Dev 2.16 4.19 3.83 x 10⁻¹² 19.57 Std.Err. 0.68 1.33 1.12 x 10⁻¹² 2.19
95% CI 1.55 3.00 2.74 x 10⁻¹² 4.36
TT1 TT2 TT3 P-value 0.047 7.023 x 10⁻⁵ 4.071 x 10⁻⁷
T-value. -2.20 12.93 4.20
95% CI for difference
(-6.4957, -0.0527)
(7.2930, 10.3864)
(4.8289, 13.5397)
[image:5.595.306.548.551.692.2]Fig. 9: BN generated by CONAR
[image:5.595.44.284.625.687.2]VI. CONCLUSIONS AND FUTURE RESEARCH
The results detailed in Section V show the potential of harnessing PSO for BN learning. The results show both CONAR and REST find significantly higher scoring network structures than the K2 algorithm (with or without node ordering supplied). The findings also allay our concerns that the randomness of the repair operator used in the CONAR algorithm would result in a random search of search space rather than using information to learn the best areas of search space to move to. This is compounded by the fact that CONAR and REST were found to be comparable, and significantly better than K2 for producing high scoring BNs. Despite the findings, we do intend to evaluate the use of a more controlled approach to arc addition/removal within the REST algorithm. A more structured approach would be to score the result of removing or adding different arcs and only make the change that results in the highest scoring network. Such a strategy is learning using the decomposability property, a property inherent of the K2 metric.
Despite these promising results, we recognize that the findings are restrictive in that only one other algorithm is used in comparing CONAR and REST and only one dataset is used. Current research is focused on evaluating our techniques against the ability of GAs and Estimation of Distribution Algorithms (EDAs) to derive high scoring BN structures. In addition, we hope to evaluate the techniques for other datasets. Current work is focused on testing the approaches using the well known Alarm dataset. We are also in the process of generating a dataset of possible dementia suffers with a view to generating a network to classify if dementia is present and the underlying syndrome associated with it. This builds on our existing work in the area of using BN for diagnosis applications [26, 27].
REFERENCES
[1] D. Chickering, D. Geiger, and D. Heckerman, “Learning Bayesian Networks is NP-Hard,” Technical report MSR-TR-94-17 Microsoft Research, Advanced Technology Division, Microsoft Corporation, 1994. [2] D. Heckerman, D. Geiger, and D. Chickering, “Learning Bayesian
Networks: The Combination of Knowledge and Statistical Data,”
Machine Learning, 20, 3, pp 197 – 243, 1995.
[3] M. Teyssier and D. Koller, "Ordering-Based Search: A Simple and Effective Algorithm for Learning Byesian Networks," Proc. 21st Conf. on
Uncertainty in AI, pp584-590, Edinburgh, Scotland, UK, 2005.
[4] P. Larrañaga, C.M.H Kuijpers, R.H. Murga, and Y. Yurramendi, “Learning Bayesian Network Structures by Searching for the Best Ordering with Genetic Algorithms,” IEEE Transactions Systems, Man and Cybernetics, Part A, 25,4, pp487-493, 1996.
[5] A. Dawid, “Conditional Independence in Statistical Theory,” Journal of Royal Statistics Society, Series B, 41, pp1-31.1979.
[6] P. Spirtes, C. Glymour, and R. Scheines, “An Algorithm for Fast Recovery of Sparse Causal Graph,” Journal of Social Science Computer Review, 9, pp62-72, 1991.
[7] M. Singh and M. Valtorta, “Construction of Bayesian network structures from data: A brief survey and an efficient algorithm,” Int. Journal of Approx Reasoning, 12, 2, pp111-131, 1995.
[8] G.F. Cooper and E. Herskovits, “A Bayesian Method for the Induction of Probabilistic Networks from Data,” Machine Learning, 9, 4, pp309-347, 1992.
[9] T. Verma and J. Pearl, “An algorithm for deciding if a set of observed independencies has a causal explanation,” Proc. 8th Conf. on Uncertainty
in AI, Stanford, California, United States, pp323-330, 1992.
[10] D. Heckerman, “A Tutorial on Learning Bayesian Networks,” Technical Report SMR-TR-95-06, March, 1995.
[11] L.M. de Campos, J.M. Fernádez-Luna, J.A. Gamez, and J.M. Puerta, “Ant colony optimization for learning Bayesian networks,” Int. Journal of Approximate Reasoning, 31, 3, pp291-311, 2002.
[12] M.L. Wong, W. Lam, and K.S. Leung, “Using Evolutionary Programming and Minimum Description Length Principle for Data Mining of Bayesian Networks,” IEEE Transactions on Pattern Analysis and Machine Intelligence, 21, 2, pp174-178, 1999.
[13] P.A.D. Castro and F.J. von Zuben, “An Immune-Inspired Approach to Bayesian Networks,” in Proc. of the 5th Int. Conf. on Hybrid Intelligent
Systems. Washington, DC, USA, pp23-28, 2005.
[14] B. Sierra and P. Larrañaga, “Predicting survival in malignant skin melanoma using Bayesian networks automatically induced by genetic algorithms. An empirical comparison between different approaches,”
Artificial Intelligence in Medicine, 14, 1-2, pp215-230, 1998.
[15] A. Novobilski, F. Fesmire, and J. Kline, “Using a Genetic Algorithm to Identify Predictive Bayesian Models in Medical Informatics,” The Int. Conf. on Information Technology, 2004.
[16] R. Eberhart and J. Kennedy, “A New Optimizer Using Particle Swarm Theory,” in Proc. of the 6th International Symposium on Micro Machine and Human Science, Nagoya, Japan, pp39-43, 1995.
[17] F. Heppner and U. Grenander, “A stochastic nonlinear model for coordinated bird flocks,” in Proc. of the Conf. on The ubiquity of chaos, American Association for the Advancement of Science, Washington, DC, 1990.
[18] J. Kennedy and R. Eberhart, “Swarm Intelligence,” Morgan Kaufmann Publishers Inc., San Francisco, USA, 2001.
[19] A. Petrovski, B. Sudha, and J. McCall, “Optimising Cancer Chemotherapy Using Particle Swarm Optimisatoin and Genetic Algorithms,” in Proc. 8th Int. Conf. on Parallel Problem Solving form
Nature, pp 633-641, 2004.
[20] C.R. Mouser and S.A. Dunn, “Comparing genetic algorithms and particle swarm optimization for an inverse problem exercise,” Journal of Australian and New Zealand Industrial and Applied Mathematics, 46, pp89-101, 2005.
[21] R. Hassan, B. Cohanim, O.L. de Weck, and G. Venter, “A Comparison of Particle Swarm Optimization and the Genetic Algorithm,” in Proc. 1st
AIAA Multidisciplinary Design Optimization Specialist Conference, Austin, Texas, pp1897- 1910, 2005.
[22] S. Warshall, “A Theorem on Boolean Matrices,” Journal of the Association of Computer Machinery, 9, 1, pp11-12, 1962.
[23] University of Waikato, New Zealand.
http://www.cs.waikato.ac.nz/ml/weka/
[24] S. L. Lauritzen and D. J. Spiegelhalter, “Local Computations with Probabilities on Graphical Structures and their Application to Expert Systems," Journal of the Royal Statistics Society, B, 50, 2, pp157-194, 1998.
[25] R. Blanco, “Learning Bayesian Networks from Data with Factorisation and Classification Purposes. Applications in Biomedicine,” Ph.D. Dissertation submitted to the Department of Computer Science and Artificial Intelligence of the University of the Basque Country, March 2005.
[26] J. Cowie, L. Oteniya, and R Coles, “Diagnosis of Dementia and its pathologies using Bayesian Belief Networks,” in Proc. Of 8th Int. Conf. on
Enterprise Information Systems: Artificial Intelligence and Decision Support Systems, INSTICC Press, Paphos, Cyprus, pp291-295, May 2006.