Original Article
The relationship between miR-106a and bone
morphogenesis proteins and its role in bone marrow
mesenchymal stem cell osteogenesis differentiation
Xiaozong Lin1,3, Wei Li2, Jiaqi Bi2, Zhiwei Qu2, Qinggang Meng1,2
1Department of Orthopaedics, Harbin Medical University, Harbin City 150081, Heilongjiang Province, China; 2Department of Medical Science Institute of Harbin, The First Hospital of Harbin City, Harbin Medical University, Harbin, China; 3Department of Orthopaedics, The Second Affiliated Hospital of Harbin Medical University, Harbin City 150081, Heilongjiang Province, China
Received August 17, 2017; Accepted March 28, 2018; Epub April 15, 2018; Published April 30, 2018
Abstract: Osteoblast is the major functional cell for osteogenesisr responsible for bone matrix synthesis, secretion and mineralization. Osteoblast mainly derives from undifferentiated mesenchymal stem cells (MSCs). Osteogenesis differentiation process of MSCs is critical for human bone formation, differentiation and regeneration. This study aimed to investigate the relationship between miR-106a and bone morphogenesis, as well as its role in bone mar-row MSCs osteogenesis differentiation. Percoll approach was used to separate MSCs from human bone marmar-row for osteogenesis differentiation induction. qRT-PCR was used to test miR-106a expression. Bioinformatics analysis was performed to predict target genes of miR-106a, followed by luciferase reporter gene assay. The effects of miR-106a on MSCs osteogenesis were analyzed. Western blot was used to analyze expression of osteogenesis differentiation related proteins including RUNX2, OCN and ALP. Cells separated by Percoll method expressed CD44 and CD25 as demonstrated by flow cytometry. MSCs showed features of osteoblast after osteogenesis differentiation induction, as miR-106a expression level was significantly suppressed (p<0.05). Bioinformatics prediction and luciferase re-porter gene assay confirmed that miR-106a could suppress BMP2 gene expression. Cell transfection for inhibiting miR-106a expression facilitated MSCs osteogenesis differentiation, and significantly elevated RUNX2, OCN and ALP expression level (p<0.05 compared to control group). In conclusion, During osteogenesis differentiation of MSCs, miR-106a is down-regulated to enhance expression level of its target gene BMP2, eventually facilitating MSCs os-teogenesis differentiation.
Keywords: Mesenchymal stem cells, MiR-106a, BMP2, osteogenesis differentiation
Introduction
Osteoblast and osteoclast play important roles in maintaining normal human bone density and quality. Osteoblast is the major functional cell for osteogenesis, and is responsible for bone matrix synthesis, secretion and mineralization [1]. Osteoblast is differentiated from mesen-chymal stem cells (MSCs) [2]. MSCs is an important member of stem cell family and derives from mesoderm and ectoderm at early developmental stage. As a pluripotent stem cell, MSCs have pluripotent differentiation potency, and can differentiate into multiple tis-sues including adipocytes, bone, cartilage, muscle, tendon, ligament, nerve, liver, heart muscle and endothelium [3, 4]. In addition,
effects of differentiated factors. For example, RUNX2 can induce MSCs to differentiate into osteoblast [5, 6]. The study of MSCs osteogen-esis process is of critical importance for the knowledge of bone development, bone cell dif-ferentiation and bone injury repair.
miR-entiation [10, 11]. Recent studies showed that various miRNA including miR-106a is closely correlated with MSCs osteogenesis differentia-tion [12]. This study investigated the reladifferentia-tion- relation-ship between miR-106a and bone morphogen-esis related proteins, and its role in MSCs osteogenesis differentiation.
Materials and methods
MSCs separation
MSCs were cultured in low glucose DMEM medium (Hyclone, US). Bone marrow was obtained from healthy volunteer donors from our hospital. Bone marrow was diluted 5-fold in DMEM medium, followed by removal of super-natant and lipid layer after centrifugation. Low layer cell was mixed with DMEM medium con-taining 5% fetal bovine serum (FBS) for re-sus-pending cells. MSCs were separated by Percoll method. In brief, Percoll reagent (Sigma, US) was paved on the tube bottom. Cell suspen-sions were then slowly added at 1:1 ratio. The tube was centrifuged at 400 g for 20 min. The middle layer was carefully collected and rinsed twice in PBS. Cells were counted under micro-scope, and inoculated in MSCs culture medium (low glucose DMEM medium containing 15% FBS (Hyclone, US), 100 u/L ampicillin (Hyclone, US), 100 mg/L streptomycin (Hyclone, US) and 250 mg/L amphotericin (Hyclone, US) in a 37°C incubator with 5% CO2.
Flow cytometry analysis
Cells were cultured as abovementioned. Cul- ture medium was removed and rinsed twice in PBS. Cells were then digested with trypsin and EDTA. Non-specific binding sites were blocked by BSA. Mouse anti-human CD29, CD34, CD44 and CD45 antibody were added for incubation, followed by FITC labelled secondary antibody. Cells were centrifuged and collected. After re-suspension, flow cytometry was performed to analyze cell phenotype.
Induction of MSCs osteogenesis differentiation
MSCs were cultured to third generation, and inoculated into 6-well plate, which was inserted with sterile coverslips for further incubation. Experimental group utilized high glucose DM- EM medium, with replenishment of 10% FBS, 10 mM β-glycerolphosphatide, 10 mM dexa-methasone, and 0.2 mM vitamin C. In control group, high glucose DMEM complete medium was used for changing fresh medium at day 3. After 14 day culture, coverslips were removed for further analysis.
qRT-PCR
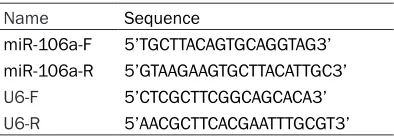
Those cells with differentiation induction were extracted for total RNA using RNAprep pure Tissue Kit (QIAGEN, Germany). Using total RNA extracted from control group as the control, qRT-PCR was performed to measure miR-106a expression. Firstly, primers were designed based on miR-106a sequence (GeneBank ac- cess # NR_029523) for RT-PCR amplification. Primer sequences were shown in Table 1. qRT-PCR amplification was performed using mirVa-nat qRT-PCR miRNA test kit (Ambion, US). Reverse transcription was firstly performed in a system containing 10 μL RNA, 5 μL RT Buffer, 1 μL RNase Mix, 2 μL cDNA and 10 μL qPCR Mix, plus 2 μL forward/reverse primers, and 4 μL ddH2O. Reaction conditions were 95°C 3 min, followed by 40 cycles each containing 95°C 15 s and 60°C 30 s. Using U6-RNA sequence as internal reference, results were analyzed by 2-ΔΔCt method.
MiR-106a functional prediction
Bioinformatics software TargetScan Release 5.1 (www.targetscan.org) was used to predict miR-106a function. Luciferase reporter gene assay confirmed possible targets. Based on 3’UTR sequence of BMP2 mRNA (Genebank access number: NM_006474), primers were designed as 5’-AAAAA GCACG TATCG GCGAG GATGA TCTCT ATC-3’ and 5’-AGAAA GCTGG AC CAA CACAG GTGTG ACCAA GAA-3’. PCR amplifi-cation was performed to obtain 3’UTR sequ- ence of BMP2 mRNA, and was inserted into downstream region of firefly luciferase gene coding region in pmirGLO plasmid to construct pmirGLO-BMP2 vector. HEK293 cells were transfected with pmirGLO-BMP2 or pmirGLO plasmid. Those cells with successful transfec-Table 1. Nucleic acid sequence for cell
trans-fection
Name Sequence
miR-106a-F 5’TGCTTACAGTGCAGGTAG3’ miR-106a-R 5’GTAAGAAGTGCTTACATTGC3’
U6-F 5’CTCGCTTCGGCAGCACA3’
[image:2.612.91.288.95.164.2]tion were transfected with miR-106a mimic to elevate miR-106a activity. Cell transfection was performed using liposome INTERFERinTM transfection reagent kit (Polyplus transfection, France). HEK293 cell line was purchased from Cell Bank, Chinese Academy of Science. Cr- yopreserved cells were resuscitated and cul-tured till log-growth phase, and were digested in trypsin, counted, diluted in fresh culture medium, and inoculated into 96-well plate. After 24 h incubation, transfection was per-formed following manual instruction of test kit. With successful transfection, cells were cul-tured for 48 h for fluorescent intensity analysis. Dual luciferase reporter gene analysis system (Promega, US) was used for analyzing fluores-cent intensity on MicroLumatPlus LB96V spec-trometry (Berthold, Germany) [13].
Cell transfection
To study the effect of miR-106a expression on MSCs, miR-106a mimics and miR-106a inhibi-tor were designed based on miR-106a se- quence, and were transfected into MSCs using methods described in previous sections. Meanwhile, BMP2 expression was manipulated using overexpression vector pcDNA3.1-BMP2 and RNA interference (downregulation of BM- P2) in which, the anti-BMP2 sequence was F: 5’-GACGAGGTCCTGAGCGAG-3’; R: 5’-GACTGCT- CCAGGACTCGC-3’ and the scramble sequence was F: 5’-CATCTTCAGCACCATATAC-3’; R: 5’-GA- GTAGAAGTCGTGGTATA-3’. After BMP2
expres-NX2, rabbit anti-human OCN, rabbit anti-human ALP, rabbit human osteocalcin, and anti-human β-actin antibody at 1:1000 dilution) at 4°C overnight. With TBST rinsing, HERP labelled mouse rabbit IgG secondary anti-body (1:200) was added for 1 h room tempera-ture incubation. All primary antibody used in Western Blot were purchased from Sanying Biotech (China). After TBST rinsing, freshly pre-pared DAB was added for 10 min staining. Western-Blot images were analyzed for gray integrity value for calculating relative expres-sion level as previously described [14].
Statistical analysis
All data were presented as mean ± standard deviation (SD). SPSS20.0 was used for statis- tical analysis. Comparison among multiple groups was performed using one way analysis of variance (ANOVA). Student t-test was used for comparing difference between two groups. A statistical significance was defined when p<0.05.
Experimental results
MSCs separation
[image:3.612.91.374.72.212.2]Percoll method was used to separate MSCs from bone marrow. Those cells were cultured in high glucose DMEM medium, followed by flow cytometry analysis of the phenotype of MSCs. As shown in Figure 1, all MSCs showed positive expression of CD44 and CD25.
Figure 1. Flow cytometry for measuring separated MSCs. Cultured cells were collected and non-specific binding sites were blocked by BSA followed by addition of mouse anti-human CD29, CD34, CD44 and CD45 antibody and subsequent addition of FITC labelled secondary antibody. Cells were centri-fuged and collected. After re-suspension, flow cytometry was performed to analyze cell phenotype.
sion was manipulated, they were induced into cells with transfected with miR-106a in- hibitor (BMP2 downregulation) or mimic (BMP2 upregula- tion).
Western blot assay
MSCs induction for osteogenesis differentia-tion and miR-106a expression
Separated MSCs were cultured in vitro till third generation for induction of osteogenesis differentiation. Cell morphology was observed under a microscope. Compared to control gr- oup, experimental group cells displayed fea-tures of osteoblast, as shown by spindle or pyramidal shape with cell-to-cell connection. Nucleus locates on one side of cell with clearly visible nucleolus (Figure 2).
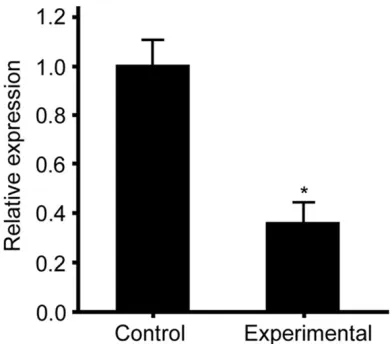
Separated cells were cultured and extracted for total RNA. qRT-PCR was used to measure miR-106a expression. We found that, com-pared to control group, miR-106a expression
erase reporter gene expression system for con-firmation. As shown in Figure 4B, experimental group cells with miR-106a mimic transfection had significantly lower fluorescent intensity, whilst transfection of miR-106a inhibitor signifi-cantly elevated cell fluorescent intensity. These results showed that 3’UTR of BMP2 was the functional target of miR-106a.
BMP2 expression
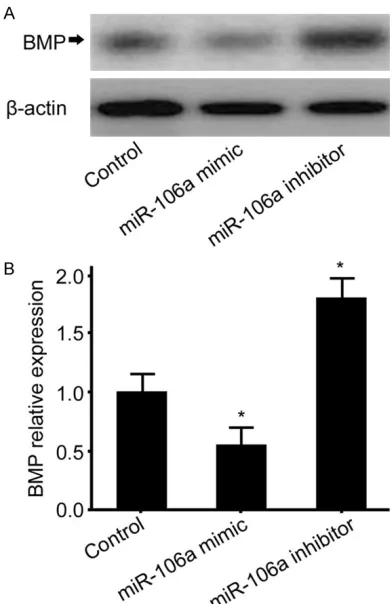
Western Blot was performed to measure BMP2 protein expression in those MSCs with suc-cessful transfection. Gel imaging analysis sys-tem was used to calculate BMP2 expression between control and experimental group. As shown in Figure 5, transfection of miR-106a mimic significantly decreased BMP2 expres-sion in MSCs (p<0.05), whilst transfection of miR-106a inhibitor remarkably elevated BMP2 expression (p<0.05), indicating successful mo-
dulation of BMP2 protein expression by cell
transfection.
Effects of miR-106a and BMP2 expression on osteogenesis differentiation
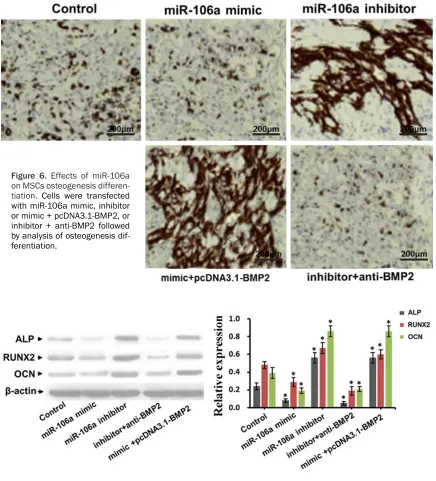
MSCs with successful transfection were con-tinuously cultured. After 7 d, microscope was used to observe cell morphology changes. As shown in Figure 6, we found that by inhibiting miR-106a expression in MSCs with cell trans-fection, MSCs showed features of osteogenesis differentiation.
[image:4.612.88.376.72.198.2]To evaluate whether miR-106a exerts its effect on osteogenesis differentiation through BMP2, we manipulated the expression of BMP2 using
Figure 2. Osteogenesis differentiation of MSCs. MSCs were cultured to third generation, and inoculated into 6-well plate. Experimental group utilized high glucose DMEM medium. In control group, high glucose DMEM complete medium was used for changing fresh medium at day 3. After 14 day culture, coverslips were removed for analysis of osteogenesis differentiation.
Figure 3. MiR-106a expression in MSCs. *, p<0.05 compared to control group. Total RNA was isolated from MSCs followed by measuring miR-106a expres-sion by qRT-PCR.
was significantly decreased in induced osteogenesis MSCs (p<0.05, Figure 3).
Relationship between miR-106a and BMP2 gene expres-sion
[image:4.612.91.287.279.451.2]lucif-overexpression vector or RNA interference. As
induced osteogenesis differentiation even when miR-106a expression was upregulated by transfection of mimic. Consistently, inhibition of BMP2 expression by RNA interference abol-ished the effect of miR-106a inhibition on osteogenesis differentiation. Taken together, these data demonstrated that miR-106a exerts its function depending BMP2 expression.
Western Blot for osteogenesis differentiation related protein expression
[image:5.612.94.251.90.216.2]Those MSCs with successful transfection were cultured for 7 days, and were tested for RUNX2, OCN and ALP protein expression. Using β-actin as the control, gel imaging analysis system was used to calculate relative expression level of two inflammation related proteins. As shown in Figure 7, compared to control group, transfec-tion of miR-106a inhibitor in MSCs had elevat-ed RUNX2, OCN and ALP levels to different extents (p<0.05). Whilst transfection of miR-106a mimic into MSCs suppressed RUNX2, OCN and ALP expression levels (p<0.05). In addition, cells with transfection of miR-106a mimic + pcDNA3.1-BMP2 displayed significant-ly higher expression of RUNX2, OCN and ALP, whereas, cells with transfection of miR-106a inhibitor + anti-BMP2 showed reduced expres-sion of RUNX2, OCN and ALP.
Discussion
MSCs are important member of stem cell fami-ly and are one group of pluripotent stem cells that can differentiate into various cells includ-ing bone, muscle and neural tissues [13]. Os- teogenesis differentiation is critical for main-taining normal human bone density and quality [14]. The study of MSCs osteogenesis differen-tiation process and regulatory mechanism are important for the knowledge of bone develop-ment, bone cell differentiation and bone injury repair [15]. This study firstly separated MSCs from healthy adult bone marrows. By passage culture and osteogenesis differentiation induc-tion, we found that miR-106a expression was significantly down-regulated in MSCs, suggest-ing that miR-106a might participate in osteo-genesis differentiation process of MSCs. By analyzing and prediction, miR-106a might use BMP2 gene as the target to exert its effect via suppressing gene expression.
MicroRNA is a type of small molecular non-cod-ing RNA with conserved evolution. It can bind to
Figure 4. Relationship between miR-106a and BMP2 gene. A. Sequence homology between miR-106a and 3’UTR of BMP2. B. Effects of miR-miR-106a on BMP2 gene expression. *, p<0.05 compared to con-trol group; #, p<0.05 compared to pmir-GLO plasmid in the same group.
[image:5.612.90.286.305.607.2]the 3’UTR of target gene to modulate gene expression at RNA level, eventually participat-ing in the modulation of various cell behaviors and body metabolic process [7]. Previous study showed that miR-21 could also participate in cancer cell proliferation and metabolism via affecting PTEN gene expression [16]. Moreover, miR-124 can also use PTBP1 mRNA as the tar-get to regulate its expression level, and PTBP1 can mediate alternative splicing pattern of
[image:6.612.89.525.70.551.2]various mRNA precursors in neural cells, even-tually modulating neural cell differentiation [10]. These studies showed important roles of miRNA in cell differentiation modulation. Bone morphogenesis protein BMP2 was initial-ly discovered as a protein for ectopic induction of bone and cartilage formation [17]. This pro-tein participates in embryonic body develop-ment, organogenesis and tissue homeostatic
Figure 6. Effects of miR-106a on MSCs osteogenesis differen-tiation. Cells were transfected with miR-106a mimic, inhibitor or mimic + pcDNA3.1-BMP2, or inhibitor + anti-BMP2 followed by analysis of osteogenesis dif-ferentiation.
regulation, as well as postnatal cartilage and bone tissue formation. Meanwhile, other stud-ies found the participation of BMPs in patho-logical process of certain diseases [18, 19]. Laura et al analyzed differential gene expres-sion in glioma and found important roles of BMP in malignant tumor growth and mainte-nance [20].
The study of osteogenesis differentiation pro-cess and regulatory mechanism is critical for the knowledge of bone development, bone cell differentiation and damage repair. Results of this study is of critical importance for further illustration of osteogenesis differentiation and bone tissue maintenance. Meanwhile, this study provided evidences for using molecular biology approach to facilitate repair of bone injury and to recover motility [21].
Conclusion
During osteogenesis differentiation process of MSCs, miR-106a expression level was down-regulated to elevate target gene BMP2 expres-sion level, and eventually facilitating MSCs osteogenesis differentiation.
Acknowledgements
This study was funded by grants from the Science and Technology Talents Program of Harbin (2014RFXGJ041, 2014RFQGJ094); Har- bin first hospital post doctoral fellowship pro-gram (HRBSDYYYBSH-1); Post Doctoral Fund (160780); Harbin high level talent fund (HR- BGCCRCJJ-6, 2013SYYRCYJ01-1) and China Postdoctoral Science Foundation, Heilongjiang Natural Science Foundation (QC2016102, H2016002).
Disclosure of conflict of interest
None.
Address correspondence to: Dr. Qinggang Meng, Department of Orthopaedics, Harbin Medical Uni- versity, No.57, Baojian Road, Nangang District, Harbin City 150081, Heilongjiang Province, China. Tel: +86-0451-84694409; Fax: +86-0451-8469- 4409; E-mail: [email protected]
References
[1] Matsuo K and Irie N. Osteoclast-osteoblast communication. Arch Biochem Biophys 2008; 473: 201-9.
[2] Zhou S, Greenberger JS, Epperly MW, Goff JP, Adler C, Leboff MS and Glowacki J. Age-related intrinsic changes in human bone-marrow-de-rived mesenchymal stem cells and their differ-entiation to osteoblasts. Aging Cell 2008; 7: 335-43.
[3] Ding DC, Shyu WC and Lin SZ. Mesenchymal stem cells. Cell Transplant 2011; 20: 5-14. [4] Bianco P, Robey PG and Simmons PJ.
Mesen-chymal stem cells: revisiting history, concepts, and assays. Cell Stem Cell 2008; 2: 313-9. [5] Greenbaum A, Hsu YM, Day RB, Schuettpelz
LG, Christopher MJ, Borgerding JN, Nagasawa T and Link DC. CXCL12 in early mesenchymal progenitors is required for haematopoietic stem-cell maintenance. Nature 2013; 495: 227-30.
[6] Huang J, Zhao L, Xing L and Chen D. MicroR-NA-204 regulates Runx2 protein expression and mesenchymal progenitor cell differentia-tion. Stem Cells 2010; 28: 357-64.
[7] Ha M and Kim VN. Regulation of microRNA bio-genesis. Nat Rev Mol Cell Biol 2014; 15: 509-24.
[8] Zhi F, Dong H, Jia X, Guo W, Lu H, Yang Y, Ju H, Zhang X and Hu Y. Functionalized graphene ox-ide mediated adriamycin delivery and miR-21 gene silencing to overcome tumor multidrug resistance in vitro. PLoS One 2013; 8: e60034. [9] Krishnan H, Retzbach EP, Ramirez MI, Liu T, Li
H, Miller WT and Goldberg GS. PKA and CDK5 can phosphorylate specific serines on the tracellular domain of podoplanin (PDPN) to in-hibit cell motility. Exp Cell Res 2015; 335: 115-22.
[10] Neo WH, Yap K, Lee SH, Looi LS, Khandelia P, Neo SX, Makeyev EV and Su IH. MicroRNA miR-124 controls the choice between neuronal and astrocyte differentiation by fine-tuning Ezh2 expression. J Biol Chem 2014; 289: 20788-801.
[11] Li M, Plecita L, McKeon B, Flockton A, Frid MG, Jezek P and Stenmark KR. miR-124 regulates the metabolic state of vascular adventitial fi-broblasts in pulmonary hypertension through the RNA splicing factor PTBP1, in C21. MEC- HANISMS THAT LINK AGING WITH LUNG DIS-EASE: THE CUTTING EDGE. p. A3986-A3986. [12] Guo L, Zhao RC and Wu Y. The role of
microR-NAs in self-renewal and differentiation of mes-enchymal stem cells. Exp Hematol 2011; 39: 608-16.
[13] van Poll D, Parekkadan B, Cho CH, Berthiaume F, Nahmias Y, Tilles AW and Yarmush ML. Mes-enchymal stem cell-derived molecules directly modulate hepatocellular death and regenera-tion in vitro and in vivo. Hepatology 2008; 47: 1634-43.
Direct and indirect effects of microstructured titanium substrates on the induction of me- senchymal stem cell differentiation towards the osteoblast lineage. Biomaterials 2010; 31: 2728-35.
[15] Uccelli A, Moretta L and Pistoia V. Mesenchy-mal stem cells in health and disease. Nat Rev Immunol 2008; 8: 726-36.
[16] Zhang JG, Wang JJ, Zhao F, Liu Q, Jiang K and Yang GH. MicroRNA-21 (miR-21) represses tu-mor suppressor PTEN and promotes growth and invasion in non-small cell lung cancer (NSCLC). Clin Chim Acta 2010; 411: 846-52. [17] Rosen V. BMP2 signaling in bone development
and repair. Cytokine Growth Factor Rev 2009; 20: 475-80.
[18] Javed A, Bae JS, Afzal F, Gutierrez S, Pratap J, Zaidi SK, Lou Y, van Wijnen AJ, Stein JL, Stein GS and Lian JB. Structural coupling of smad and Runx2 for execution of the BMP2 osteo-genic signal. J Biol Chem 2008; 283: 8412-22. [19] Tomlinson IP, Carvajal-Carmona LG, Dobbins
SE, Tenesa A, Jones AM, Howarth K, Palles C, Broderick P, Jaeger EE, Farrington S, Lewis A, Prendergast JG, Pittman AM, Theodoratou E, Olver B, Walker M, Penegar S, Barclay E, Whif-fin N, Martin L, Ballereau S, Lloyd A, Gorman M, Lubbe S, Howie B, Marchini J, Ruiz-Ponte C, Fernandez-Rozadilla C, Castells A, Carracedo A, Castellvi-Bel S, Duggan D, Conti D, Cazier JB, Campbell H, Sieber O, Lipton L, Gibbs P, Martin NG, Montgomery GW, Young J, Baird PN, Gall-inger S, Newcomb P, Hopper J, Jenkins MA, Aaltonen LA, Kerr DJ, Cheadle J, Pharoah P, Casey G, Houlston RS and Dunlop MG. Multi-ple common susceptibility variants near BMP pathway loci GREM1, BMP4, and BMP2 ex-plain part of the missing heritability of colorec-tal cancer. PLoS Genet 2011; 7: e1002105.
[20] Hover LD, Abel TW and Owens P. Genomic analysis of the BMP family in glioblastomas. Transl Oncogenomics 2015; 7: 1-9.