How to cite: Abosede, A.O., Opawole, A., Olubola, B., Ojo, G.K. & Kajimo-Shakantu, K. 2019. Performance analysis of small and medium-sized construction firms in Oyo State, Nigeria. Acta Structilia, 26(1), pp. 66-96. © Creative Commons With Attribution (CC-BY) Published by the UFS http://journals.ufs.ac.za/index.php/as
Afolabi Olubunmi
Abosede,
Akintayo Opawole,
Babalola Olubola,
Grace Kehinde Ojo
& Kahilu
Kajimo-Shakantu
Mrs Afolabi Olubunmi Abosede, Department of Quantity Surveying, Obafemi Awolowo University, Ile-Ife, Nigeria, email: <bunnyezzy30@gmail. com> ORCID: https://orcid. org/0000-0002-3545-7006 Dr Akintayo Opawole, Postdoctoral Research Fellow, Department of Quantity Surveying and Construction Management, University of the Free State, Bloemfontein, South Africa. Phone: +2348035125849, email: <tayoappmail@gmail. com> ORCID: https://orcid. org/0000-0001-8326-7824 Prof. Babalola Olubola, Department of Quantity Surveying, Obafemi Awolowo University, Ile-Ife, Nigeria, email: <[email protected]> Dr Grace Kehinde Ojo, Department of Quantity Surveying, Obafemi Awolowo University, Ile-Ife, Nigeria, email: <[email protected]> Prof. Kahilu Kajimo-Shakantu, Department of Quantity Surveying and Construction Management, University of the Free State, Bloemfontein, South Africa. Phone: 051 4012248, email: <kajimo-shakantu@ufs. ac.za> ORCID: https://orcid. org/0000-0002-0368-1791
DOI: http://dx.doi.
org/10.18820/24150487/as26i1.3 ISSN: 1023-0564
e-ISSN: 2415-0487
Acta Structilia 2019 26(1): 66-96
Performance analysis of
small and medium-sized
construction firms in Oyo
State, Nigeria
Peer reviewed and revised March 2019 Published June 2019
*The authors declared no conflict of interest for this title or article
Abstract
96.12% and 31.03% of the projects executed by small and medium-sized firms, respectively, had cost performance index (CPI) at budget level (CPI = 1). Meanwhile, 37.42% of the projects executed by the small firms and 24.13% of those executed by medium- sized firms were completed as planned, that is, they had schedule performance index (SPI = 1). The article provides implications for understanding the influence of the construction firms’ profile in relation to their PI that could assist in the capability development of small and medium-sized construction firms.
Keywords: Construction firms, cost performance, public projects, time
performance, time overrun, cost overrun.
Abstrak
Hierdie artikel ondersoek die tyd en koste prestasie van projekte wat uitgevoer word deur klein en mediumgrootte konstruksiemaatskappye met die oog op die verbetering van die firmas se vermoëns. Die artikel het ’n kwantitatiewe beskrywende analise aangeneem wat gebaseer was op primêre en argiefdata. Agt-en-sestig (68) geldige vraelyste wat van topbestuurders van die firmas verkry is, het primêre kwantitatiewe data vir die assessering verskaf. Sekondêre data is ingesamel op die aanvanklike en finale kontrakbedrae asook aanvanklike en voltooiingstye van 184 openbare projekte wat deur die firmas uitgevoer is. Data wat ingesamel is, is ontleed met behulp van beskrywende analise. Die bevindinge dui op spesialisasie van die klein ondernemings in algemene bouwerke, terwyl die mediumgrootte firmas ook in siviele werke gespesialiseer het. Projekwaardes in die geval van klein konstruksiefirmas het tussen N1 en N50million gewissel, terwyl dié van mediumgrootte konstruksiefirmas tussen N51 en N100million gewissel het. Die prestasie-indeks (PI) van die projekte wat deur die maatskappye uitgevoer is, het ’n algemene onderprestasievlak getoon. Ongeveer 96.12% en 31.03% van die projekte wat uitgevoer is deur die klein en mediumgrootte maatskappye het onderskeidelik die koste-prestasie-indeks (VPI) op begrotingsvlak (VPI=1). Intussen is 37.42% van die projekte uitgevoer deur die klein firmas en 24.13% van dié wat deur mediumgrootte maatskappye uitgevoer is, volgens plan beplan, naamlik dat hulle skedule-prestasie-indeks (SPI=1) gehad het. Die artikel bied implikasies vir die begrip van die invloed van konstruksiefirmas se profiel in verhouding tot hul PI wat kan help met die vermoë-ontwikkeling van klein en mediumgrootte konstruksiefirmas.
Sleutelwoorde: Konstruksiemaatskappye, koste oorskry, koste prestasie,
openbare projekte, tyd prestasie, tyd oorskry
1.
Introduction
completion time, estimated cost, and quality satisfaction (Aliyu, Haruna, Ali & Ibrahim, 2015: 11).
In Nigeria, there are over 17.2 million small and medium enterprises that represent approximately 96% of all the businesses that contribute not less than 75% of the national employment (Ilori, 2017: 25). In the construction sector, small and medium-sized construction firms are often not considered by all categories of clients for projects of higher complexities and profitability, for fear of their abilities to meet these parameters. It is the usual practice that ‘white elephant projects’ are awarded to big/large construction firms that are mostly owned by foreign investors (Mitrofanova, Russkova, Batmanova & Shkarupa, 2015: 274). This scenario has not enabled the potential of small and medium-sized construction firms to be explored in terms of global competitiveness. Besides, there is still a lack of empirical evidence on the possible correlation of construction firm size to project performance that could enable the apportionment of performance criticism of the construction industry to small and medium-sized firms. While the contribution of small and medium-sized construction firms could be far-reaching in economic development through job creation and gross domestic product (GDP) growth, by improving their delivery capacity (Onugu, 2005: 2; Ogunsemi & Jagboro, 2006: 255; Ilori, 2017: 25), empirical studies on the competitiveness review of this category of firms are generally lacking in Nigeria. Moreover, construction management studies (for example, Ahadzie, 2007; Ihua & Siyanbola, 2012; Odediran, Adeyinka, Opatunji & Morakinyo, 2012; Wang, Lee, Yap & Abdul-Rahman, 2018) focusing on critical project performance indicators have not correlated the possible impact of construction firm size to performance. In this regard, the understanding of the profile of small and medium-sized construction firms and how their characteristics define the type of projects they execute, as well as the time and cost performance of the projects would be highly imperative to put the capacities of the firms into focus. The study would ultimately provide an insight into the implications for enhancing the delivery capacity of the firms in terms of better competitiveness.
2.
Literature review
2.1 Classification of construction firms
Contracting organisations are generally classified as small, medium and large firms, on account of a number of criteria that influence the type of works they undertake (Odediran et al., 2012: 259). The criteria that have been adopted in the classification include scope of operation (local, regional, national, and multinational); specialisation (building and engineering); size and category of contracts (small, medium, and large), and the nationality (foreign and indigenous) of the company’s owner(s) (Muazu & Bustani, 2004: 13; ldoro & Akande-Subar, 2008; Ihua & Siyanbola, 2012: 173).
Table 1: Classification of small and medium-scale firms
S/N Size category Employment Assets (N million) (excluding land and buildings)
1 Micro enterprises Less than 10 Less than 5
2 Small enterprises 10-49 5 less than 50
3 Medium enterprises 50-199 50 less than 500
Source: SMEDAN, 2009
The NPMSMEs (2007) proposes that, where there is a conflict in classification between the criteria of employment and assets, the employment-based classification will take precedence and the enterprise will be regarded as micro/small. There is no definite agreement in existing literature on the definition of small and medium-scale firms (Ayyagari et al., 2003: 3). In view of this, the Small and Medium Enterprises Development Agency of Nigeria’s (SMEDAN) (2009) definition of a small firm as an enterprise whose total assets, including working capital but excluding the cost of land, is between N5 million and N50 million with a workforce of between 10 to 49 full-time staff, and an annual turnover of not more than N10 million, may be considered very worthwhile. SMEDAN (2009) defines a medium-scale enterprise as a company with a total asset, including working capital but excluding the cost of land and building, of over N50 million, but less than N500 million. Moreover, the medium-sized firm has a staff strength of between 50 to 199 full-time workers, with an annual turnover of not more than N20 million. In this article, the definitions and classifications of small and medium-sized firms, as set out by SMEDAN (2009), are adopted as the operational definitions.
2.2 Characteristics versus project performance of
construction firms
time are the most popular measures because of their quantitative characteristics and direct economic implications if their thresholds are unnecessarily exceeded (Ogunsemi & Jagboro, 2006: 253). The understanding of the cost and time performances of projects executed by small and medium-sized firms could enable one to draw inferences on how the size of construction firms defines their performance. Unfortunately, there is limited empirical evidence that has isolated the performances of this category of construction firms. Most of the literature identified the characteristics of small and medium-sized construction firms as not suitable to be considered by all categories of clients for projects of higher complexities and profitability, for fear of their abilities to meet the overall success of projects (Wasi, Bridge & Skitmore, 2001; Dlungwana & Rwelamila 2003; Uduak, 2006; Ibrahim, Githae & Stephen, 2014; ILO, 2015; Mitrofanova et al., 2015; Hussain & Abdul Hadi, 2018).
of participation of indigenous contractors as resources constraints, problem of payments for executed work, abuse of mobilisation fund, and government inconsistencies. According to Wasi et al. (2001) and Ahadzie (2007), small and medium-sized firms are often characterised by cash-flow problems, financial skills, and lack of the requisite managerial skills to adequately compete.
Ofori (1991) asserts that the global construction industry experiences all kinds of challenges and problems and that there is a perception that the industry is lagging behind in terms of technological advancement, development of operational processes, and keeping up to date with prevailing business trends. Hagstedt & Thideman (2013: 34-38) identified financial, infrastructural, managerial, technological, human resources and safety problems as challenges experienced by small building contractors in Norway. In the South African context, Thwala & Phaladi (2009: 533) showed that small and medium-sized contractors are characterised by poor technical, managerial and entrepreneurial skills, which generally explain the unsatisfactory performance of the projects they execute. The inability to provide securities, raise insurance, and obtain professional indemnity as well as delay or non-payment by government upon the completion of projects are significant factors limiting their engagement in large or complex construction works (Thwala& Mvubu, 2008: 97). In the Ghanaian construction industry, factors such as lack of access to capital, low profit margin due to competition, and delay in collecting payments have contributed to the failure of small and medium building contractors (Odonkor, 2011: 77).
In the Nigerian context, the characteristics that impact on small and medium-size contractor’s performance include limited access to credit, high cost of doing business (Ihua & Siyanbola, 2012: 182-183), cash-flow problems, fraudulent practice, and the nature of the working or construction environment (Gambo & Said, 2014: 1057). Moreover, the underperformance of the Nigerian small and medium-sized firms has been explained by under-capitalisation, high cost of construction finance (Ugochukwu & Onyekwena, 2014: 12), poor management practice, poor accounting standards, shortage of manpower (Onugu, 2005: 15), lack of capital equipment, and shortage of skilled labour (Mafimidiwo & Iyagba, 2015: 105).
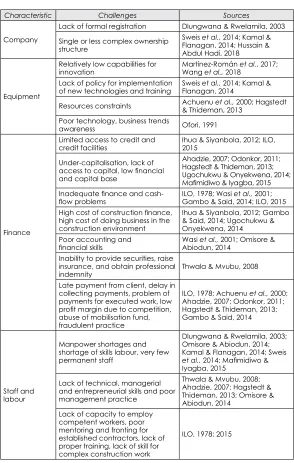
Table 2: Performance characteristics of small and medium-sized construction firms
Characteristic Challenges Sources
Company
Lack of formal registration Dlungwana & Rwelamila, 2003 Single or less complex ownership
structure
Sweis et al., 2014; Kamal & Flanagan, 2014; Hussain & Abdul Hadi, 2018
Equipment
Relatively low capabilities for
innovation Martínez-Román Wang et al., 2018et al.,2017; Lack of policy for implementation
of new technologies and training Sweis Flanagan, 2014et al., 2014; Kamal & Resources constraints Achuenu & Thideman, 2013et al., 2000; Hagstedt Poor technology, business trends
awareness Ofori, 1991
Finance
Limited access to credit and
credit facilities Ihua & Siyanbola, 2012; ILO, 2015 Under-capitalisation, lack of
access to capital, low financial and capital base
Ahadzie, 2007; Odonkor, 2011; Hagstedt & Thideman, 2013; Ugochukwu & Onyekwena, 2014; Mafimidiwo & Iyagba, 2015 Inadequate finance and
cash-flow problems ILO, 1978; Wasi Gambo & Said, 2014; ILO, 2015et al., 2001; High cost of construction finance,
high cost of doing business in the construction environment
Ihua & Siyanbola, 2012; Gambo & Said, 2014; Ugochukwu & Onyekwena, 2014
Poor accounting and
financial skills Wasi Abiodun, 2014 et al., 2001; Omisore & Inability to provide securities, raise
insurance, and obtain professional
indemnity Thwala& Mvubu, 2008
Late payment from client, delay in collecting payments, problem of payments for executed work, low profit margin due to competition, abuse of mobilisation fund, fraudulent practice
ILO, 1978; Achuenu et al., 2000; Ahadzie, 2007; Odonkor, 2011; Hagstedt & Thideman, 2013; Gambo & Said, 2014
Staff and labour
Manpower shortages and shortage of skills labour, very few permanent staff
Dlungwana & Rwelamila, 2003; Omisore & Abiodun, 2014; Kamal & Flanagan, 2014; Sweis et al., 2014; Mafimidiwo & Iyagba, 2015
Lack of technical, managerial and entrepreneurial skills and poor management practice
Thwala& Mvubu, 2008; Ahadzie, 2007; Hagstedt & Thideman, 2013; Omisore & Abiodun, 2014
Lack of capacity to employ competent workers, poor mentoring and fronting for established contractors, lack of proper training, lack of skill for complex construction work
Characteristic Challenges Sources
Operation and specialisation
Operate in the informal sector Dlungwana & Rwelamila, 2003 Substantial maintenance works Sweis et al., 2014
Lack of preference on types of
construction work accepted Kamal & Flanagan, 2014
Clients Delay or non-payment by government after completing
projects Thwala& Mvubu, 2008
Tender and procurement
Open tendering procedure and
lump-sum contract Wasi et al., 2001 Poor pricing, tendering and
contract documentation skills ILO, 2015
3.
Methodology
This study describes the respondents’ opinion on how the characteristics of small and medium-sized firms define the types, as well as the time and cost performance of the projects they execute. A quantitative research design was used, in which the use of structured questionnaire surveys enables researchers to generalise their findings from a sample population (Van Laerhoven, Van der Zaag-Loonen & Derkx, 2004; Bryman & Bell, 2007; Bryman, 2012: 232; Creswell, 2014), usually by gathering numeric data in a systematic format (Quinlan, 2011). It also allows for descriptive analysis where frequencies and percentages systematically describe the characteristics of a population (Bhattacharyya & Johnson, 2014; Kowalczyk, 2015). Together with the results from the questionnaire survey, archival data on time and cost performances of 184 public projects were considered and form the data sets for this study.
3.1 Sampling method and response rate
construction firms. Sixty-eight (68) valid questionnaire responses, representing a response rate of 73.91%, were returned (see Table 3). Fifty (73.0%) of these were obtained from small firms. This was higher than eighteen (26.0%) responses obtained from medium-sized firms. The response rate is considered adequate, as asserted by Idrus & Newman (2002: 15), in that the response rate of 30.0% is appropriate for construction management studies.
3.2 Data collection
A self-administered structured questionnaire survey was distributed among the 92 top managers including business administrators, accountants, architects, quantity surveyors, builders, project managers, and engineers, with at least one respondent selected from each building construction firm located in Oyo State, Nigeria, from June 2016 to October 2016.
The questionnaire was developed based on the constructs of the literature review. It was divided into two parts. Part 1 used fill-in and check-boxes questions to gather the respondents’ profile. These include the respondents’ academic and professional qualifications and years of working experience in the construction industry, in general. Part 2 of the questionnaire consisted of 25 questions relating to the specific objectives of the study. This was further divided into two sections. Using check-boxes and fill-in questions, section 1 consisted of 18 questions on the characteristics of the sampled firms, including the company structure, number of skilled and unskilled labour, average annual turnovers, year of establishment, coverage of operation, sources of project finance, and sources of equipment. In section 2, respondents answered 7 fill-in and check-boxes questions on the profile of the projects executed by the firms. These comprised variables such as project description, location of projects, type of clients, value of contracts, and completion duration, among others. The survey questionnaire was designed as a close-ended type. According to Kothari (2004: 18), close-ended questionnaires are easy to handle, simple to answer, and relatively quick to analyse. The respondents were informed about the purpose of this study and their freedom to be anonymous.
3.3 Analysis and interpretation of the data
The Statistical Package for Social Sciences (SPSS) version 22 (Pallant, 2013 was used to calculate the mean of responses and to analyse them using descriptive statistics such as frequencies and percentages (Bhattacharyya & Johnson, 2014). The frequencies and percentages of responses were generated and reported, in order to analyse and describe the profile of the respondents, the characteristics of their firms as well as the profile of the projects executed by these firms (Naoum, 2007: 103).
In determining the time and cost performance of projects executed by the firms, archival data on past projects were collected on 155 public projects executed by small construction firms and 29 public projects executed by medium-sized construction firms in the study area. Archival data relating to initial and final costs of past projects were collected and from these pairs of data sets, cost overruns were determined and project cost performance calculated, using the cost performance index (CPI) (Jackson & Steven, 2001). CPI is the ratio that measures the financial effectiveness of a project by dividing the budgeted cost and the actual cost, such that CPI > 1 is excellent performance over budget; CPI < 1 is underperformance over budget, and CPI = 1 means desired cost performance over budget (Zhu & Lin, 2004). Archival data relating to completion schedules of past projects were collected and the initial and final durations of the projects were obtained. From this pair of data sets, time overruns were determined (Zhu & Lin, 2004; Park, 2009) and project time performance calculated, using the schedule performance index (SPI) adapted from Kuprenas (2003). Kuprenas (2003) defines SPI as SPI = BCWP/BCWS, where BCWP = budgeted cost of the work performed, and BCWS = budgeted cost of the work scheduled. SPI value of 1 (SPI =1) means the time was as planned (at the time value), SPI value above 1 (SPI > 1) means the project was ahead of schedule, and SPI of less than 1 (SPI < 1) means the project was behind schedule.
4.
Results and discussion
4.1 Profile of the respondents
construction management professionals that could provide adequate information on various types of projects executed by the firms in the study area. The analysis of the respondetns’ working experience showed that 35.3% had 6-10 years’ working experience, 26.5% had 11-15 years’ working experience, and 36.7% had 16-20 years’ working experience. Only 1.5% had less than 5 years’ working experience. Moreover, the average years of experience of the respondents was estimated at 13 years, which represents the working experience of approximately 63.2% of the respondents.
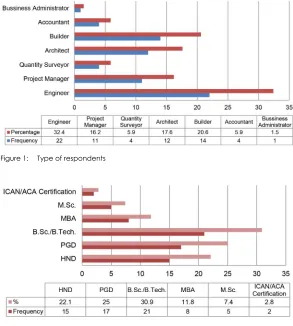
Figure 1: Type of respondents
HND =Higher national diploma; PGD = Postgraduate diploma; B.Sc. = Bachelor of Science; B.Tech. = Bachelor of Technology; M.Sc. = Master of Science; MBA = Master of Business Administration.
[image:12.421.73.364.168.328.2] [image:12.421.71.364.170.496.2]Figure 2 presents the educational qualifications of the respondents. The results show that the respondents with a Master of Science (M.Sc.) degree and a Master of Business Administration (MBA) were represented at 7.4% and 11.8% of the sample, respectively. The highest number of respondents were those with a Bachelor of Science/Technology degree (B.Sc./B.Tech.), representing 30.9%. Moreover, 22.1% obtained a Higher National Diploma (HND) and 25% held a Postgraduate Diploma (PGD).
[image:13.421.58.351.282.526.2]Table 3 presents the analysis of the respondents’ official designations. Respondents who held the post of deputy director and manager were equally represented at 14.7%. Approximately 42.6% of the respondents held the post of director, while 10.3%, 5.9%, 4.4% and 2.9% held the position of general managers, site engineers, project managers and site supervisors, respectively. Moreover, each of the resident architects, technical officers, and principal consultants involved represented 1.5% of the sample. These outstanding profiles of the respondents (Figures 1 and 2; Table 3) were considered in assessing the appropriateness of data for this study.
Table 3: Official designation of the respondents
Designation Small firm Medium firm Total
F % F % F %
Director 20 40 9 50.0 29 42.6
Deputy
director 9 18 1 5.6 10 14.7
Manager 6 12 4 22.2 10 14.7
General
manager 5 10 2 11.1 7 10.3
Site engineer 3 6 1 5.6 4 5.9
Project
manager 3 6 0 0 3 4.4
Site supervisor 1 2 1 5.6 2 2.9
Resident
architect 1 2 0 0 1 1.5
Technical
officer 1 2 0 0 1 1.5
Principal
consultant 1 2 0 0 1 1.5
Total 50 100 18 100 68 100
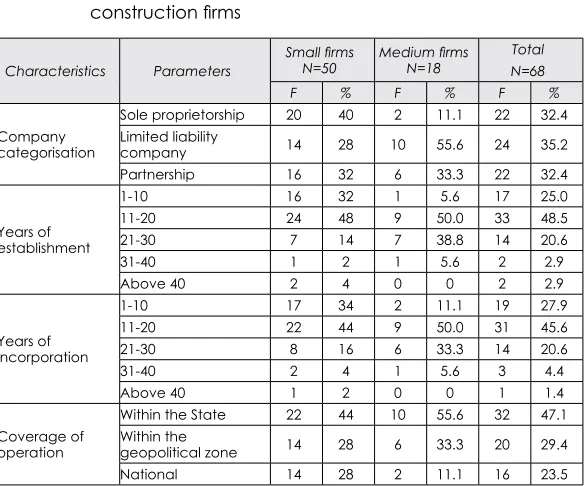
4.2 Characteristics of small and medium-sized construction firms
for small and medium-sized firms, respectively. This result implies that most of the firms have been operating for over a decade, and a satisfactory level of experience in the construction industry could be inferred. The result of the analysis also shows the operations coverage of the firms. Specifically, 44.0% of the small firms operate within the states in which they are located, 28.0% have their operations’ coverage within their geopolitical zone (southwest), and 28.0% operate at national level (covering the six geopolitical zones in Nigeria). Meanwhile, 55.6% of the medium-sized firms operate within the states in which their head offices are located, 33.3% within the southwestern geopolitical zone, and 11.1% within all the states of the Federation in the medium-sized category. The fact that a greater percentage of the small and medium-sized firms operate within their states is true, because it could take time to build trust and confidence in a developing firm. The result of the analysis in Table 4 further shows the sources of project funding by the firms. Bank loans have the highest percentage of 82.0%, followed by equity (10.0%), and clients (8.0%), in the small firms.
Table 4: Characteristics of small and medium-sized construction firms
Characteristics Parameters Small firms N=50 Medium firms N=18
Total N=68
F % F % F %
Company categorisation
Sole proprietorship 20 40 2 11.1 22 32.4
Limited liability
company 14 28 10 55.6 24 35.2
Partnership 16 32 6 33.3 22 32.4
Years of establishment
1-10 16 32 1 5.6 17 25.0
11-20 24 48 9 50.0 33 48.5
21-30 7 14 7 38.8 14 20.6
31-40 1 2 1 5.6 2 2.9
Above 40 2 4 0 0 2 2.9
Years of incorporation
1-10 17 34 2 11.1 19 27.9
11-20 22 44 9 50.0 31 45.6
21-30 8 16 6 33.3 14 20.6
31-40 2 4 1 5.6 3 4.4
Above 40 1 2 0 0 1 1.4
Coverage of operation
Within the State 22 44 10 55.6 32 47.1
Within the
geopolitical zone 14 28 6 33.3 20 29.4
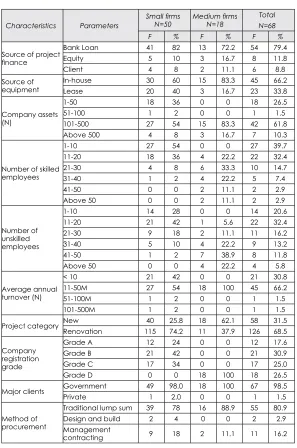
Characteristics Parameters Small firms N=50 Medium firms N=18 N=68Total
F % F % F %
Source of project finance
Bank Loan 41 82 13 72.2 54 79.4
Equity 5 10 3 16.7 8 11.8
Client 4 8 2 11.1 6 8.8
Source of
equipment In-houseLease 3020 6040 153 83.316.7 4523 66.233.8
Company assets (N)
1-50 18 36 0 0 18 26.5
51-100 1 2 0 0 1 1.5
101-500 27 54 15 83.3 42 61.8
Above 500 4 8 3 16.7 7 10.3
Number of skilled employees
1-10 27 54 0 0 27 39.7
11-20 18 36 4 22.2 22 32.4
21-30 4 8 6 33.3 10 14.7
31-40 1 2 4 22.2 5 7.4
41-50 0 0 2 11.1 2 2.9
Above 50 0 0 2 11.1 2 2.9
Number of unskilled employees
1-10 14 28 0 0 14 20.6
11-20 21 42 1 5.6 22 32.4
21-30 9 18 2 11.1 11 16.2
31-40 5 10 4 22.2 9 13.2
41-50 1 2 7 38.9 8 11.8
Above 50 0 0 4 22.2 4 5.8
Average annual turnover (N)
< 10 21 42 0 0 21 30.8
11-50M 27 54 18 100 45 66.2
51-100M 1 2 0 0 1 1.5
101-500M 1 2 0 0 1 1.5
Project category New 40 25.8 18 62.1 58 31.5
Renovation 115 74.2 11 37.9 126 68.5
Company registration grade
Grade A 12 24 0 0 12 17.6
Grade B 21 42 0 0 21 30.9
Grade C 17 34 0 0 17 25.0
Grade D 0 0 18 100 18 26.5
Major clients Government 49 98.0 18 100 67 98.5
Private 1 2.0 0 0 1 1.5
Method of procurement
Traditional lump sum 39 78 16 88.9 55 80.9
Design and build 2 4 0 0 2 2.9
Management
[image:16.421.70.367.67.515.2]contracting 9 18 2 11.1 11 16.2
Characteristics Parameters Small firms N=50 Medium firms N=18 N=68Total
F % F % F %
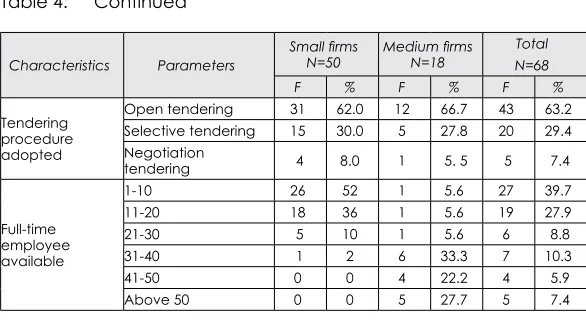
Tendering procedure adopted
Open tendering 31 62.0 12 66.7 43 63.2
Selective tendering 15 30.0 5 27.8 20 29.4
Negotiation
tendering 4 8.0 1 5. 5 5 7.4
Full-time employee available
1-10 26 52 1 5.6 27 39.7
11-20 18 36 1 5.6 19 27.9
21-30 5 10 1 5.6 6 8.8
31-40 1 2 6 33.3 7 10.3
41-50 0 0 4 22.2 4 5.9
Above 50 0 0 5 27.7 5 7.4
F = Frequency = F
In the medium-sized category of firms, 72.2% of the firms funded their projects through bank loans, 16.7% through equity, and 11.1% from clients. The results show that most of the projects executed by both small and medium-sized firms are funded through bank loans. This shows that accessibility to loan facilities is a key factor for enhancing the performance and delivery capacity of these firms. It is, therefore, imperative to address the issue of access to finance with reduced interest rate, in order to enhance the firms’ capacities.
[image:17.421.57.350.60.220.2]have N51-N100 million, 54.0% have N101-N500 million, and 4.0% have above N500 million. Meanwhile, N101-N500 million range has the highest percentage of 83.3%, and 16.7% have above N500 million company worth in the medium-sized category. On average, the company worth of small and medium-sized firms is estimated at N213 million and N334 million, respectively. These findings contradict SMEDAN’s (2009) classification of small and medium-scale firms in terms of total asset/company worth for small-sized firms, but are in conformity with medium-sized firms. SMEDAN’s (2009) classification of small and medium-scale firms, in terms of total asset/company worth for small and medium-sized firms, indicates N50 million and N500 million, respectively.
4.3 Projects executed by small and medium-sized
construction firms
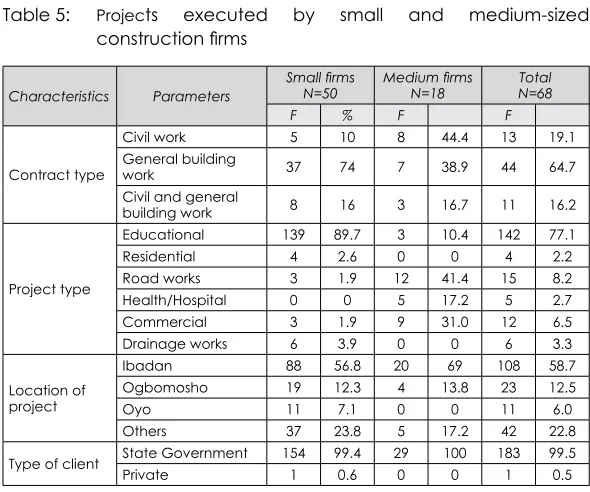
[image:18.421.70.365.296.542.2]In order to understand the profile of the projects executed by the firms, results of variables including contract or project descriptions, location of projects, type of clients, values of contracts, completion duration, and project types are evaluated and shown in Table 5.
Table 5: Projects executed by small and medium-sized construction firms
Characteristics Parameters Small firms N=50 Medium firms N=18 N=68Total
F % F F
Contract type
Civil work 5 10 8 44.4 13 19.1
General building
work 37 74 7 38.9 44 64.7
Civil and general
building work 8 16 3 16.7 11 16.2
Project type
Educational 139 89.7 3 10.4 142 77.1
Residential 4 2.6 0 0 4 2.2
Road works 3 1.9 12 41.4 15 8.2
Health/Hospital 0 0 5 17.2 5 2.7
Commercial 3 1.9 9 31.0 12 6.5
Drainage works 6 3.9 0 0 6 3.3
Location of project
Ibadan 88 56.8 20 69 108 58.7
Ogbomosho 19 12.3 4 13.8 23 12.5
Oyo 11 7.1 0 0 11 6.0
Others 37 23.8 5 17.2 42 22.8
Type of client State Government 154 99.4 29 100 183 99.5
Characteristics Parameters
Small firms
N=50 Medium firms N=18 N=68Total
F % F F
Value of contract (N)
< 1M 5 3.2 0 0 5 2.7
1M-10M 117 75.5 0 0 117 63.6
11M-50M 33 21.3 0 0 33 17.9
51M-100M 0 0 29 100 29 100
Completion duration (weeks)
1-26 31 20.0 1 3.5 32 17.4
26-52 121 20.0 19 65.5 122 17.4
52-144 3 1.90 9 31.0 22 76.1
F = Frequency = F
Educational infrastructure was the highest type of projects executed by the firms, with a percentage of 89.7%, followed by residential projects (2.6%), road works and commercial projects (1.9% each), and drainage works (3.9%) for the small firms. In the medium-sized firms, road works had the highest percentage of 41.4%, followed by commercial projects (31%), health/hospital projects (17.2%), and educational projects (10.4%). These results show that educational projects are the type of projects mostly executed by small firms, while road works, presumably substantial maintenance (Wasi et al., 2001), is the public project mostly executed by medium-sized firms. The results of the analysis also show that 3.2% of the projects involving small firms have contract values below N1 million. Approximately 75.5% of the projects’ contract values ranged between N1 million and N10 million, and 21.3% of the projects had contract values ranging between N11 million and N50 million. Approximately all (100%) of the projects involving medium-sized firms have contract values ranging between N51 million and N100 million. These results show that most of the projects executed by small firms ranged between N1 million and N50 million, while those executed by medium-sized firms ranged between N51 million and N100 million.
or rehabilitation works. On the other hand, 62.1% of the projects executed by medium-sized firms are new projects, while renovation works are 37.9%. These findings support Wasi et al. (2001) who assert that the nature of contracts executed by small and medium-sized construction firms includes maintenance works, refurbishment, and housing construction projects, carried out under lump-sum contract through open tendering procedure.
An assessment of the area of specialisation of the firms shows that they are mainly civil works, general building works, and civil/general building works. The percentage of firms that specialise in civil works, general building works, and civil/general building works are 10.0%, 74.0%, and 16.0%, respectively in the small firm category. Moreover, 44.4% specialised in civil works, 38.9% in general building works, and 16.7% in civil/general building works in the medium-sized firm category. These results show that most of the small and medium-sized firms are engaged in general building works more than in other areas of construction works, presumably because the equipment owned by the firms are related to building works. The results of the analysis also show the number of full-time employees which is estimated at 12 and 38 for the small and medium-sized firms, respectively. These results conform with SMEDAN’s (2009) classification of small and medium-scale firms in terms of staff strength and number of employees. However, firms in the medium-sized category may have to improve on their staff strength, in order to meet job requirements and demands.
also examined. Traditional lump-sum contract has the highest percentage of 78.0%, management contracting 18.0%, and the least was ‘design and build’ procurement system with 4.0% in the small firm category. Moreover, 88.9% of the medium-sized firms are involved in projects procured through traditional lump-sum procurement and the least was management contracting with 11.1%. The result shows that small and medium-sized firms are involved in projects procured through both traditional and non-traditional procurement systems and that their involvement is extremely low in the non-traditional procurement system. The fact that the firms are engaged through the traditional method using lump-sum contracts suggests in part that clients perceive the firms as inexperienced in the management of non-traditional methods. The results also suggest that, if small and medium-sized firms are to remain relevant and attract more patronage and compete globally, they need to improve their skills more on the non-traditional procurement systems, as project complexity and clients’ requirements are geared towards innovative procurement systems (Babatunde, Opawole & Ujaddughe, 2010: 1).
4.4 Cost performance of projects executed by small and
medium-sized firms
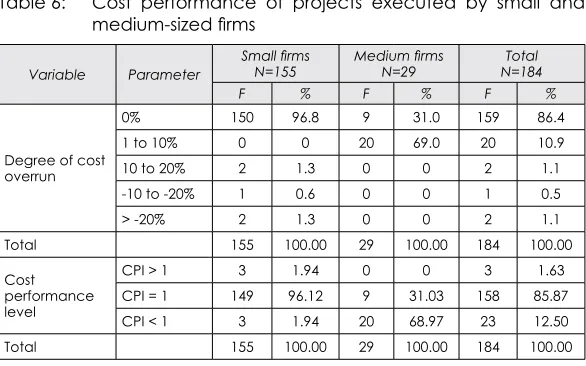
Cost overruns of the projects were determined and calculated as the difference between final contract sum and initial contract sum. Table 6 shows the results of cost overruns and project cost performance as calculated by the CPI.
Table 6: Cost performance of projects executed by small and medium-sized firms
Variable Parameter Small firms N=155 Medium firms N=29 N=184Total
F % F % F %
Degree of cost overrun
0% 150 96.8 9 31.0 159 86.4
1 to 10% 0 0 20 69.0 20 10.9
10 to 20% 2 1.3 0 0 2 1.1
-10 to -20% 1 0.6 0 0 1 0.5
> -20% 2 1.3 0 0 2 1.1
Total 155 100.00 29 100.00 184 100.00
Cost performance level
CPI > 1 3 1.94 0 0 3 1.63
CPI = 1 149 96.12 9 31.03 158 85.87
CPI < 1 3 1.94 20 68.97 23 12.50
[image:21.421.58.351.352.535.2]Approximately 1.94% of the projects executed by small firms have a CPI estimated at CPI > 1. Meanwhile, 96.12% have CPI = 1 and 1.94% have CPI > 1. On average, the CPI of projects executed by small firms is estimated at approximately 1.00 (CPI =1). This implies that the projects executed by small firms achieved the desired cost performance level, as contended by Uduak (2006: 2) and Ibrahim
4.5 Time performance of projects executed by small and
medium-sized construction firms
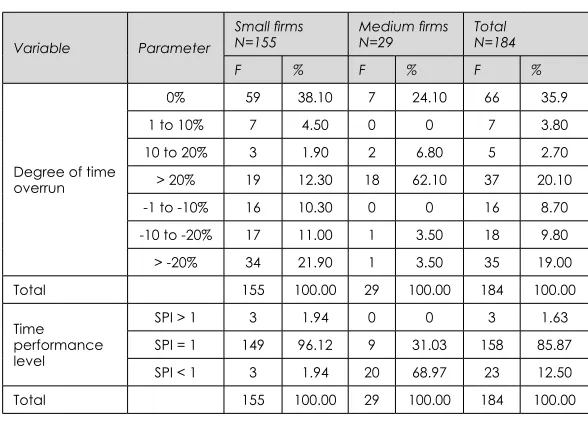
Time overruns of the projects were determined and calculated as the difference between final contract duration and initial contract duration. Table 7 shows the results on time overruns and project time performance as calculated by the SPI.
Table 7: Assessment of time performance of projects executed by small and medium-sized firms
Variable Parameter
Small firms
N=155 Medium firms N=29 Total N=184
F % F % F %
Degree of time overrun
0% 59 38.10 7 24.10 66 35.9
1 to 10% 7 4.50 0 0 7 3.80
10 to 20% 3 1.90 2 6.80 5 2.70
> 20% 19 12.30 18 62.10 37 20.10
-1 to -10% 16 10.30 0 0 16 8.70
-10 to -20% 17 11.00 1 3.50 18 9.80
> -20% 34 21.90 1 3.50 35 19.00
Total 155 100.00 29 100.00 184 100.00
Time performance level
SPI > 1 3 1.94 0 0 3 1.63
SPI = 1 149 96.12 9 31.03 158 85.87
SPI < 1 3 1.94 20 68.97 23 12.50
Total 155 100.00 29 100.00 184 100.00
[image:23.421.56.350.165.376.2]suggests that a good number of the firms are fast developing financial and technical capabilities to undertake projects of a more complex nature. However, less satisfactory time performance in some of the projects could be attributed to delayed payment by the government and financial incapability of the contractors to fund their projects (Odonkor, 2011: 77). The reason for this is that many of them depend solely on funds paid by the clients (through mobilisation fees and interim certificates) and that they could possibly not have access to bank loans or alternative sources to fund the projects.
Table 7 also shows the time performance of projects executed by medium-sized construction firms. Approximately 68.97% of the projects executed by medium-sized firms have SPI > 1, 24.13% have SPI = 1, while only 6.91% of the projects executed have SPI < 1. Although the average time performance estimated at 1.24 (SPI > 1) was satisfactory, the results of the analysis, nonetheless, show that approximately 6.91% of the projects are still at underperformance level.
5.
Conclusion
executed by medium-sized firms were new projects, while renovation works accounted for 37.9%. Moreover, the findings showed that the small and medium-sized firms engaged in general building works rather than in other areas of construction works, presumably because the equipment owned by the firms is related to building works and lack of access to finance. Findings further showed that the clients of the two categories of firms had substantially been public organisations. The results showed that small and medium-sized firms are involved in projects procured through both traditional and non-traditional procurement systems and that their involvement is considerably low in the non-traditional procurement system. This fact suggests their inexperience in the management of projects procured through non-traditional methods. It also indicates that, if the firms are to remain relevant and attract more patronage and compete globally, they need to improve on their skill of procurement systems as project complexity and client’s requirements are geared towards a procurement system beyond the traditional system (Babatunde
References
Achuenu, E., Izam, Y.D. & Bustani, S.A. 2000. Investigating the activities of indigenous contractors in Nigerian construction industry.
Nigeria Journal of Construction Technology and Management, 3(1), pp. 91-103.
Ahadzie, D.K. 2007. A model for predicting the performance of project managers in mass house building projects. Ph.D. Thesis, University of Wolverhampton, UK.
Aliyu, A.A., Haruna, A.A., Ali, A. & Ibrahim M.S. 2015. Influence of building contractors performance on construction process in Nigeria.
Journal of Energy Technologies and Policy, 5(8), pp. 11-22.
Ariyo, D. 2008. Small firms are the backbone of the Nigerian Economy.
Africa Economic Analysis, 1(1), pp. 109-124.
Ayyagari, M.T., Beck, T. & Demirguc-Kunt, A. 2003. Small and medium enterprises across the globe: A new database. World Bank, Development Research Group, Washington DC. https://doi. org/10.1596/1813-9450-3127
Babatunde, S.O., Opawole, A. & Ujaddughe, I.C. 2010. An appraisal of project procurement methods in the Nigerian construction industry. Civil Engineering Dimension, 12(1), pp. 1-7.
Babbie, E.R. & Mouton, E.B.J. 2001. The practice of social research.
Cape Town: Oxford University Press.
Basil, A.N. 2005. Small and medium enterprises (SMEs) in Nigeria: Problems and prospects. Ph.D. thesis, St. Clements University.
Bhattacharyya, G.K. & Johnson, R.A. 2014. Statistics: Principles and methods. 7th edition. Hoboken, NJ: John Wiley & Sons.
Bryman, A. 2012. Social research methods. 4th edition. New York:
Oxford University Press.
Bryman, A. & Bell, E. 2007. Business research methods. New York: Oxford University Press.
Chilipunde, R.L. 2007. Assessment of emerging contractors in Malawi. Unpublished B.Sc. dissertation. Port Elizabeth: Nelson Mandela Metropolitan University.
Dissanayaka, S.M. & Kumaraswamy, M.M. 1999. Comparing contributors to time and cost performance in building projects.
Building and Environment, 34(1), pp. 31-42. https://doi.org/10.1016/ S0360-1323(97)00068-1
Dlungwana, W.S. & Rwelamila, P.D. 2003. Contractor development models for promoting sustainable building: A case for developing management capabilities of contractors. Paper presented at the meeting of CSIR: Pretoria, South Africa, 2003.
Gambo, N. & Said, I. 2014. An assessment of the impact of cost factors influencing performance of small scale local government contractors in Nigeria. International Journal of Engineering Research and Technology, 3(11), pp. 1052-1059.
Hagstedt, K. & Thideman, J. 2013. Growth challenges for small general contractors in the construction industry: A case study of the Norwegian building company. M.Sc. thesis, Department of Technology Management and Economics, Chalmers University of Technology. Hussain, A.M. & Abdul Hadi, R.A. 2018. Corporate governance, small medium enterprises (SMEs) and firms’ performance: Evidence from Construction Business, Construction Industry Development Board (CIDB) Malaysia. International Journal of Business and Management, 13(2), pp. 14-28. https://doi.org/10.5539/ijbm.v13n2p14
Ibrahim, I.I., Githae, W. & Stephen, D. 2014. Indigenous contractors’ involvement and performance in construction procurement systems in Nigeria. Global Journal of Researches in Engineering, 14(1), pp. 18-27.
Idoro, G.I. & Akande-Subar, L.O. 2008. Clients’ assessment of the quality performance of indigenous and expatriate construction contractors in Nigeria. A paper presented at COBRA: Construction & Building Research Conference of the RICS, 4-5 September, Dublin Institute of Technology, Ireland.
ILO (International Labour Organization). 2015. Small and medium-sized enterprises and decent and productive employment creation. Report IV. Geneva, Switzerland: ILO Publications.
Ilori, E.O.I. 2017. A critical analysis of monitoring and evaluation systems for small and medium enterprises, with specific reference to small and medium enterprises development agency of Nigeria. Ph.D. thesis, University of the Western Cape, South Africa.
Jackson, O. & Steven, O. 2001. Management of cost overrun in selected building construction project in Ilorin, Review of Business and Finance, 3(1), pp. 321-332.
Kamal, E.M. & Flanagan, R. 2014. Key characteristics of rural construction SMEs. Journal of Construction in Developing Countries, 19(2), pp. 1-13. https://doi.org/10.5130/ajceb-cs.v2i2.3885
Kayanula, D. & Quartey, P. 2000. The policy environment for promoting small and medium-sized enterprises in Ghana and Malawi. Finance and development research programme. Working paper series, paper no. 15, IDPM, University of Manchester.
Kothari, C.R. 2004. Research methodology: Methods and technique. 2nd revised edition. New Delhi, India: New Age International (P)
Limited Publishers.
Kowalczyk, D. 2015. Descriptive research design, example and types. [online]. Available at: <http://study.com/academy/lesson/ descriptive-research-design-definition-examples-type.html> [Accessed: 3 January 2017].
Kozak, R. 2007. Trends in labor statistics: Small- and medium-sized enterprises in the solid wood sectors of the European Union, 1995 to 2004. Washington, DC: Rights and Resources Initiative (RRI). Kuprenas, J.A. 2003. Project management actions to improve design phase cost performance. Journal of Management in Engineering, 19(1), pp. 25-32. https://doi.org/10.1061/(ASCE)0742-597X(2003)19:1(25) Leedy, P.D. & Ormrod. J.E. 2010. Practical research: Planning and designing. 9th edition. Boston, NY: Pearson.
Martínez-Román, J.A., Tamayo, J.A. & Gamero, J. 2017. Innovativeness and its influence on growth and market extension in construction firms in the Andalusian region. Journal of Engineering and Technology Management, no.43, pp. 19-33. https://doi.org/10.1016/j. jengtecman.2016.11.002
Mitrofanova, I.V., Russkova, E.G., Batmanova, V.V. & Shkarupa, E.A. 2015. Drivers of the regional economic growth and the problem of ‘‘white elephants’’ of the Russian Olympic Megaproject “Sochi 2014’’. Mediterranean Journal of Social Sciences, 6(6), pp. 267-276. https://doi.org/10.5901/mjss.2015.v6n4s2p267
Muazu, D.A. & Bustani, S.A. 2004. A comparative analysis of litigation among foreign and indigenous construction firms in Nigeria. ATBU Journal ofEnvironmental Technology, 3(1), pp. 13-16.
Naoum, S. 2007. Dissertation research and writing for construction students. London: Routledge, Taylor & Francis.
Nigerian National Policy on Micro, Small and Medium Enterprises NPMSMEs) (2007).
Odediran, S.J., Adeyinka, B.F., Opatunji, O.A. & Morakinyo, K.O. 2012. Business structure of indigenous firms in the Nigerian construction industry. International Journal of Business Research andManagement, 13(5), pp. 255-264.
Odonkor, S. 2011. Determinants of business failure: The perspective of SMEs building contractors in the Ghanaian construction industry. Unpublished M.Sc. thesis, Department of Building Technology, College of Architecture and Planning Kwame Nkrumah, University of Science and Technology, Kumasi.
Ofori, G. 1991. Programme for improving the performance of the contracting firms in developing countries. Journal of Environmental Technology, 9(1), pp. 19-38. https://doi.org/10.1080/01446199100000003 Ogunsemi, D.R. & Jagboro, G.O. 2006. Time-cost model for building projects in Nigeria. Construction Management and Economics, 24(3), pp. 253-258. https://doi.org/10.1080/01446190500521041 Olokoyo, S. 1999. Managing your small-scale enterprises successfully: A guide to entrepreneurs, managers and students. 3rd edition. Kaduna:
Ola Jamon Printers & Publishers.
Onugu, B.A.N. 2005. Small and medium-scale enterprises in Nigeria: The problems and prospects. Ph.D. thesis, St. Clements University, Alofi, Niue.
Pallant, J. 2013. SPSS survival manual: A step-by-step guide to data analysis using IBM SPSS. 5th edition. Crows Nest, Australia: Allen
and Unwin.
Park, S.H. 2009. Whole life performance assessment: Critical success factors. Journal of Construction Engineering and Management, 13(5), pp. 1146-1149. https://doi.org/10.1061/(ASCE)CO.1943-7862.0000090 Quinlan, C. 2011. Business research methods. Andover, Hampshire, UK: South-Western Cengage Learning.
Shakantu, W.M., Kajimo-Shakantu, K., Saidi, F. & Mainga, W. 2006. Bridging the informal, formal and indigenous construction knowledge system to resolve the construction skills shortage. Paper delivered at the 4th Postgraduate Conference of the CIDB on Construction
Industry Development, 8-10 October, Stellenbosch, South Africa. SMEDAN (Small and Medium Enterprise Development Agency of Nigeria) 2009. Small business in Nigeria.
Sweis, R., Bisharat, L., Bisharat, S. & Sweis, G. 2014. Factors affecting contractor performance on public construction projects. Life Science Journal, 11(4), pp. 28-39.
Thwala, W.D. & Mvubu, M. 2008. Current challenges and problems facing small and medium-size contractors in Swaziland. African Journal of Business Management, 2(5), pp. 93-98.
Thwala, W.D. & Phaladi, M.J. 2009. An exploratory study of problems facing small contractors in the North West Province of South Africa.
African Journal of Business Management, 3(10), pp. 533-539.
Uduak, I.I. 2006. Assessment of indigenous contractors’ participation in construction project delivery in Nigeria. The Quantity Surveyors, 54(2), pp. 2-9.
Wang, C., Lee, L.Y., Yap, H.B.J. & Abdul-Rahman, H. 2018. Capabilities-based forecasting model for innovation development in small and medium construction firms (SMCFS). Journal of Civil Engineering and Management, 24(3), pp. 167-182. https://doi.org/10.3846/ jcem.2018.1626
Wasi, D., Bridge, A. & Skitmore, R.M. 2001. Factors affecting the performance of small indigenous contractors in Papua New Guinea.
The Australian Journal of Construction Economics and Building, 1(1), pp. 80-90. https://doi.org/10.5130/AJCEB.v1i1.2282
Zhu, K. & Lin, L. 2004. A stage – by – stage factor control frame work for cost estimation of construction projects. In: Hampson, K. (Ed.).
Proceedings of Clients Driving Innovation International Conference