Original Article
Prognostic significance of frailty in
patients undergoing surgery for renal cell
carcinoma and construction of a predictive model
Changjing Zhang1*, Xiaomin Gao2*, Menghe Zhai3, Deguan Yu4, Yue Pan5, Zhixian Yu5
1Pediatric Surgery, The First Affiliated Hospital of Wenzhou Medical University, Wenzhou, China; 2Department of
Urology, The Third Clinical Institute Affiliated to Wenzhou Medical University, The People’s Hospital of Wenzhou, Wenzhou, China; 3Department of Urology, The Second Hospital of Jiaxing, Jiaxing, China; 4Department of
Pharma-cy, The Third Clinical Institue Affiliated to Wenzhou Medical University, Wenzhou, China; 5Department of Urology,
The First Affiliated Hospital of Wenzhou Medical University, Wenzhou, China. *Equal contributors.
Received November 25, 2017; Accepted May 3, 2018; Epub July 15, 2018; Published July 30, 2018
Abstract: Purpose: We evaluated the association between frailty and overall survival (OS) and metastasis-free sur-vival (MFS) in patients with renal cell carcinoma who underwent radical surgery. Methods: We performed a
retro-spective study of patients with histologically confirmed non-metastatic renal cell carcinoma who underwent surgery between January 2004 and July 2014. Frailty was quantified using the Canadian Study of Health and Aging Modified
Frailty Index (mFI). Univariate and multivariate analyses were performed to determine the potential prognostic value of frailty. Nomograms were established to evaluate prognosis for OS and MFS. The predictive accuracy of
nomo-grams was measured by Harrell’s concordance index (c-index). Results: Of the 672 patients identified in this stu-dy, patients were divided into 2 groups (mFI < 2 and mFI ≥ 2) based on X-tile program. Patients with an mFI ≥ 2 had significantly poorer OS (p = 0.0006) and MFS (p = 0.0009) than those with an mFI < 2 in Kaplan-Meier survival
analysis. Multivariate analysis identified higher mFI value as an independent risk predictor of overall survival (HR = 2.43; 95% CI = 1.40-4.23; p = 0.002) and metastasis-free survival (HR = 2.22; 95% CI = 1.34-3.69; p = 0.002). Moreover, the nomograms combined with mFI could accurately predict OS index: 0.831) and MFS (c-index: 0.763). Conclusion: In our study of non-metastatic renal cell carcinoma, a higher mFI value can effectively act as an independent prognostic predictor of postoperative survival. Additionally, the established nomograms can be applied in prognosis of survival for RCC patients after curative nephrectomy.
Keywords: Frailty, renal cell carcinoma, overall survival, metastasis-free survival, nomogram
Introduction
Renal cell carcinoma (RCC) is one of most com-mon urological cancers worldwide, and ac- counts for approximately 90% of all kidney malignancies [1-3]. As a result of the develop-ment of modern radiologic screening tools, including ultrasonography and computed to- mography (CT), there has been an annual world-wide increase of approximately 2% in the inci -dence of RCC over the last 2 decades [2]. RCC is primarily a disease of older patients, with the peak incidence occurring at the age of 60-70 years [2]. Thus with population growth and aging, the burden of RCC on the health care system will continue to rise.
Approximately 30% of RCC patients are diag -nosed with metastases at first diagnosis, and
another 20% of localized RCC patients who undergo curative surgery will develop meta- stases during follow-up [4]. The mortality rate of metastatic RCC is very high, although novel target therapies have been developed [5]. Therefore, determining prognostic predictors to more accurately select RCC patients with poor survival is becoming increasingly clinical- ly important.
indications, including unintentional weight loss, self-reported exhaustion, low physical activity, slowness, and weak grip strength [6]. Subs-equently, widely used assessments were cre-ated based on a cumulative deficit model and were termed the Canadian Study of Health and Aging Frailty Index (CSHA-FI). This index includes 70 deficits, including clinical signs, symptoms, disease states, and disabilities [11]. However, it is difficult to identify and quan -tify 70 items for each patient. As a result, a modified frailty index (mFI) was created by mapping the CSHA-FI items to 11 variables th-at were contained in the American College of Surgeons National Surgical Quality Improve- ment Program (NSQIP) database [12, 13]. Findings have shown that mFI accurately pre-dicts long-term survival after femoral neck frac -ture or glioblastoma resection [14, 15].
The impact of mFI on RCC patients who have undergone curative surgery has yet to be ev-
aluated. Therefore, the objective of the cur- rent study was to investigate the mFI as a pre-operative predictor of overall survival (OS) and metastasis-free survival (MFS) following sur-gery, and was first study trying to establish the prognostic nomograms with improved predic-tive capacity for patients with RCC based on mFI and the clinicopathological factors.
Materials and methods
Patients’ selection
After approval from the Institution Ethical Re- view Board, we retrospectively reviewed the records of consecutive patients with histologi-cally confirmed non-metastatic RCC from January 2004 to July 2014 at the First Affiliat-ed Hospital of Wenzhou MAffiliat-edical University, China. The exclusion criteria were patients who: (I) were younger than 18 years old, (II) had any history of other cancers, (III) underwent pallia-Table 1. Risk factors used to calculate the modified frailty index and incidence in the cohort
Risk factor Score No. in cohort
Functional health status before surgery: partially or totally dependent 1 24 (3.6%)
Diabetes mellitus type II 1 159 (23.7%)
Chronic obstructive pulmonary disease 1 57 (8.5%)
Congestive heart failure 1 3 (0.4%)
History of myocardial infarction within 6 months 1 4 (0.6%)
Prior cardiac surgery, percutaneous coronary intervention, or angina within past month 1 21 (3.1%)
Hypertension 1 294 (43.8%)
Impaired sensorium 1 3 (0.4%)
History of transient ischemic attack 1 2 (0.3%) History of cerebrovascular accident 1 18 (2.7%)
[image:2.612.90.523.84.245.2]Peripheral vascular disease requiring surgery or active claudication present 1 3 (0.4%)
[image:2.612.93.522.265.412.2]tive surgery instead of curative radical or par-tial nephrectomy, (IV) underwent kidney trans -plantation before surgery or had only 1 kidney, (V) had bilateral RCC. All surgeries were per-formed by 7 surgeons and assessed by 2 pro-fessors in our department. The quality of sur-geries was considered to be satisfactory. Preoperative investigations
Referring to our prospectively maintained com-puter database, the following data were re- trieved retrospectively: patient demographic features, past and personal histories, clinico-pathological characteristics, and treatment methods. The tumors were pathologically st- aged and histologically subtyped based on the Union for International Cancer Control sev-enth TNM classification, the American Joint Co-mmittee on Cancer guidelines, and the Hei-delberg recommendations [16, 17]. Tumor
grading was assessed according to the Fu- hrman’s grading system [18].
Follow-up strategies
[image:3.612.96.520.85.469.2]The routine follow-up consisted of blood and urine tests, and chest and abdominal CT or magnetic resonance imaging every 3 to 6 months for the first 2 years after surgery and annually thereafter. Information on death was obtained from outpatient medical records, te- lephone interview, or the patient’s social secu -rity death index. The cutoff of follow-up was September 1, 2016. OS and MFS were calcu-lated from the date of surgery to the date of death from any cause, or recurrence of radio-logically or historadio-logically confirmed distant metastasis on the date of the last follow-up, respectively. The primary endpoint of this stu- dy was OS.
Table 2. Baseline demographics stratified by modified frailty index
Factors mFI = 0 mFI = 1 mFI = 2 mFI ≥ 3 P value
N 253 (37.6) 289 (43%) 104 (15.5) 26 (3.9%)
Follow-up 66.8 ± 35.2 56.0 ± 34.0 52.4 ± 30.1 58.4 ± 38.7 P = 0.028 Age (SD) 56.2 (12.3) 63.9 (11.8) 66.5 (10.7) 71.4 (10.0) < 0.001
Sex
Female 109 (43.1%) 103 (35.6%) 29 (27.9%) 8 (30.8%) 0.04 Male 144 (56.9%) 186 (64.4%) 75 (72.1%) 18 (69.2%)
ASA grade
I 46 (18.2%) 34 (11.8%) 6 0 < 0.001
II 204 (80.6%) 235 (81.3%) 83 18 III 3 (1.2%) 20 (6.9%) 15 8
BMI (SD) 22.8 (3.3) 23.3 (2.8) 23.8 (2.7) 23.5 (3.2) 0.033
Mean tumor size (IQR) 4 (3-6) 4 (3-6) 4 (3-5.4) 3 (2.5-4) 0.937
Pathological T stage
pT1 202 (79.9%) 223 (77.2%) 79 (76.0%) 19 (73.1%) 0.075
pT2 32 (12.6%) 25 (8.7%) 16 (15.4%) 5 (19.2%)
pT3 16 (6.3%) 38 (13.1%) 7 (6.7%) 1 (3.8%)
pT4 3 (1.2%) 3 (1.0%) 2 (1.9%) 1 (3.9%)
Fuhrman grade
1 83 (32.8%) 92 (31.8%) 30 (28.9%) 8 (30.8%) 0.950
2 106 (41.9%) 120 (41.5%) 49 (47.1%) 10 (38.4%)
3 56 (22.1%) 67 (23.2%) 23 (22.1%) 6 (23.1%)
4 8 (3.2%) 10 (3.5%) 2 (1.9%) 2 (7.7%)
Histologic subtype
Clear cell 220 (87.0%) 250 (86.5%) 91 (87.5%) 26 (100%) 0.500
Papillary 15 (5.9%) 17 (5.9%) 10 (9.6%) 0
Chromophobe 17 (6.7%) 20 (6.9%) 2 (1.9%) 0
Collecting duct 1 (0.4%) 1 (0.3%) 1 (1.0%) 0
Assessment of frailty
Frailty was qualified using the mFI (Table 1) [12, 13]. Briefly, it was calculated based on 11 variables from the CSHA-FI, and 1 point was given for each variable based on the functional health status before surgery. The variables were: partially or totally dependent, diabetes mellitus type II, hypertension, chronic obstruc-tive pulmonary disease, congesobstruc-tive heart fail-ure, history of myocardial infarction within 6 months, prior cardiac surgery, percutaneous coronary intervention, or angina within the past month, impaired sensorium, history of transient ischemic attack, history of cerebrovascular accident, and peripheral vascular disease requiring surgery or active claudication pres-ent. Ultimately, the mFI scores ranged from 0 to 6 (Figure 1).
Statistical analysis
Statistical analyses were performed using the SPSS software package version 22.0 (IBM, Armonk, NY). Normally distributed continuous variables are presented as mean ± standard deviation, and non-normally distributed contin-uous variables are presented as median and interquartile ranges. Categorical variables are
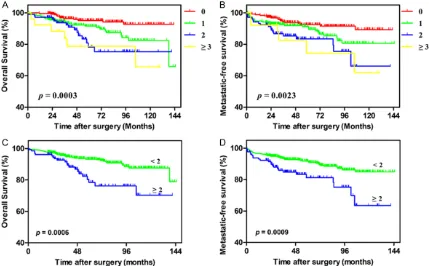
presented as counts and percentages. The association between the mFI and several parameters was compared using the Student’s t test, Chi-square test or Fisher’s exact test (categorical data), and the Mann-Whiney U test (non-normally distributed continuous data and ranked data). X-tile software (Version 3.6.1, Yale University, New Haven CT, USA) was app-lied to calculate the discriminatory ability of mFI to identify the optimal cutoff value. The influence of mFI scores on patient OS and MFS was analyzed using the Kaplan-Meier method, and the log-rank test was used to assess the differences. Univariate and multivariate analy-sis (forward stepwise method) was perform- ed to identify the influence of patient age, sex, BMI, ASA grade, tumor size, pathologic T stage, tumor grade, histologic subtype, and frailty on OS and MFS. Variables with p < 0.05 in the univariate analysis were included in the su- bsequent multivariate analysis. Nomograms for OS and MFS were established by R softw- are (Version 3.4.1; Institute for Statistics and Mathematics, Vienna, VIC, Austria). The predic-tive accuracy of the two models, of which one included variables only and the other included variables plus mFI, were evaluated by Harrell’s concordance index (c-index). All tests were two-Figure 2. Kaplan-Meier survival curves for OS and MFS versus frailty with patients grouped by (A) and (B) frailty
[image:4.612.91.520.73.339.2]sided, and differences were considered to be statistically significant at p < 0.05.
Results
Patient grouping
From January 2004 to July 2014, a total of 672 patients, including 249 (37.1%) women and 423 (62.9%) men, were included in our study. The mean age at surgery was 61.7 (12.6) years, and the median tumor size was 4 (range, 3-6) cm. The mean follow-up duration was 59.6 ± 34.5 months. The patients’ clinicopathologic characteristics are summarized in Table 2. A total of 253 (37.6%) patients had an mFI of 0, 289 (43.0%) had an mFI of 1, 104 (15.5%) had an mFI of 2, and 26 (3.9%) had an mFI ≥ 3 (Figure 1). A higher mFI was correlated with sex (p = 0.04), BMI (p = 0.033), and ASA grade (p < 0.001). Patients with higher mFI scores were more likely to be older, the mean age was 56.2 for mFI = 0, 63.9 for mFI = 1, 66.5 for mFI = 2, and 71.4 for mFI ≥ 3. There was no significant difference in the tumor size (p = 0.937), patho-logic T stage (p = 0.075), tumor grade (p = 0.950), and histologic subtype (p = 0.500) among the mFI groups.
Association of frailty with survival
During follow-up, 74 (11.0%) patients experi -enced distant metastasis and 61 (9.1%) died within 10 years of follow-up. The 5-year survival rates were 90.5% for OS and 89.7% for MFS, respectively. The optimal cutoff value for mFI of OS was identified as 2 by means of X-tile pro -gram (Figure S1), the P value of mFI was 0.0009. Therefore, patients were divided into 2 groups: a higher mFI group (mFI ≥ 2) and a lower mFI group (mFI < 2). Patients with an mFI ≥ 2 had significantly poorer OS (p = 0.0006) and MFS (p = 0.0009) than those with an mFI < 2 in Kaplan-Meier survival analysis (Figure 2). Univariate and multivariate analysis revealed that a higher mFI was a statistically significant predictor of OS and MFS. Therefore, multivari-ate analysis for OS and MFS was applied to identify various independent predictors (Table
[image:5.612.93.523.84.376.2]3). The following factors were included in the multivariate Cox proportional hazards model: sex, age, mFI value, ASA grade, BMI, tumor size, pathologic T stage, and Fuhrman grade. The results indicated that a higher mFI was an inde-pendent risk factor for OS (HR = 2.43, p = 0.002) and MFS (HR = 2.22, p = 0.002). Table 3. Univariate and multivariate logistic regression analysis of risk factors for OS and MFS
OS Univariate analysis Multivariate analysis
HR (95% CI), P value HR (95% CI), P value
Sex (male) 1.59 (0.91-2.78), 0.107
Age (≥ 65) 4.05 (2.22-7.36), < 0.001 3.15 (1.71-5.80), < 0.001
mFI (≥ 2) 2.45 (1.44-4.15), < 0.001 2.43 (1.40-4.23), 0.002
ASA grade (≥ III) 3.31 (1.75-6.25), < 0.001
BMI (≥ 25) 0.28 (0.11-0.69), 0.006 0.27 (0.12-0.69), 0.006
Mean tumor size (≥ 7) 2.85 (1.69-4.81), < 0.001 2.00 (1.16-3.47), 0.013
Pathological T stage (≥ 3) 4.40 (2.50-7.72), < 0.001 3.94 (2.17-7.17), < 0.001
Fuhrman grade (≥ 3) 2.92 (1.76-4.83), < 0.001 2.27 (1.36-3.78), 0.002
Histologic subtype (Clear cell) 1.48 (0.75-2.91), 0.259
MFS Univariate analysis Multivariate analysis
HR (95% CI), P value HR (95% CI), P value
Sex (male) 1.70 (1.02-2.85), 0.042
Age (≥ 65) 2.65 (1.63-4.31), < 0.001 2.16 (1.31-3.55), 0.003
mFI (≥ 2) 2.23 (1.37-3.63), < 0.001 2.22 (1.34-3.69), 0.002
ASA grade (≥ III) 2.16 (1.11-4.20), 0.024
BMI (≥ 25) 0.32 (0.15-0.69), 0.004 0.33 (0.15-0.73), 0.006
Mean tumor size (≥ 7) 2.77 (1.72-4.47), < 0.001 2.11 (1.28-3.49), 0.003
Pathological T stage (≥ 3) 3.33 (1.93-5.74), < 0.001 2.82 (1.59-4.99), < 0.001
Fuhrman grade (≥ 3) 2.59 (1.64-4.09), < 0.001 2.05 (1.29-3.27), 0.002
Moreover, age, BMI, tumor size, pathologic T stage and Fuhrman grade were also indepen-dent predictors of OS and MFS.
Prognostic nomograms for OS and MFS
Prognostic nomograms were depicted by all the independent indicators in the multivari- ate analysis and were applied to predict the survival rates for RCC patients after surgery (Figure 3). To use nomograms, an individual patient’s value was located on the variable axis, and each subtype was assigned a score according to the point scale. Then the sum of the points was located on the Total points axis,
we could easily draw downward a straight line to the survival axes to determine the estimat- ed probability of survival. These nomograms could predict the probability of death for all-cause or distant metastasis for RCC patients within 3-, 5- and 10-years after surgery (Figure S2). The c-index for OS and MFS were 0.831 and 0.763, respectively.
Discussion
[image:6.612.93.522.71.473.2]As the incidence of RCC continues to rise, it is important to identify those patients at high risk of a poor prognosis after surgery. In the present study, we used a frailty index to examine the Figure 3. Postoperative nomogram with mFI and significant clinicopathologic characteristics predicted the prob
-ability of RCC for (A) OS and (B) MFS. To use the nomogram, an individual RCC patients’ value is located on each
variable axis, and a line is depicted upward to determine the number of points received for each variable value. Subsequently, the sum of these number is located no Total Point axis, and a line is drawn downward to the survival
effects of frailty on long-time survival in RCC patients undergoing surgery. In addition, nomo-grams were established to improve the predic-tive accuracy. We found that a higher frailty score (mFI ≥ 2) was an independent risk predic -tor of OS and MFS, and the predictive nomo-grams, integrating mFI and other independent factors, could be used for the prognosis and clinical decision-making for surgeons.
Frailty was defined as vulnerability to adverse health outcomes and/or death following stress events [6]. Both kidney cancer and curative nephrectomy are major physiologic stressors, suggesting the potential of assessing frailty in patients with RCC. Therefore, the incorpora-tion of a frailty measurement for older cancer patients has been advocated. The mFI is a sim-ple and efficient frailty assessment tool that has abbreviated from the CSHA-FI [12, 13]. It uses readily available historical variables that can be consistently and reliably collected in the preoperative setting. Thus, the mFI is an ideal screening tool in the everyday clinical setting. In the current study, our findings demonstra-te that higher frailty value is independently associated with declines in OS and MFS. Furthermore, patients with an mFI ≥ 2 had sig -nificantly poorer 5-year OS and MFS compared with patients with an mFI < 2. Limited studies have indicated that compared with healthy indi-viduals, frail patients had higher risks of death in several models of frailty. Clough-Gorr et al. illustrated the association between frailty and all-cause mortality at 5, 7 and 10 years of fol-low-up in older breast cancer patients (adjust-ed 5-year HR = 1.87, 95% CI 1.36-2.57; adjust -ed 7-year HR = 2.31, 95% CI 1.40-2.94; adjusted 10-year HR = 1.74, 95% CI 1.39-2.18) [10, 20]. Patal et al. demonstrated that the mFI was associated with mortality both 1 and 2 years after sustaining a femoral neck fracture in patients aged 60 years and over [14]. Additionally, Cloney et al. found that frailty was associated with decreased OS for glioblasto- ma patients undergoing craniotomy [15]. Therefore, our results are consistent with other frailty studies performed in multiple settings [6, 10, 14, 15, 19].
With the evidence linking frailty to poor out -comes, it has been suggested that frailty as- sessment should be implemented in clinical practice. Instead of being an irreversible state,
frailty occurs as a dynamic process with transi-tions between higher and lower states of frail- ty [20, 21]. Therefore, incorporation of the notion of frailty into the clinic to monitor and manage the population health may prevent fur-ther deterioration in physical and functional impairment. The management strategies in- clude building frailty clinics for an in-depth assessment and incorporating physical and cognitive exercise, social support, and nutrition for people in the earlier stages of frailty [20, 22, 23]. These strategies may improve the long-term survival of frail patients.
Nomogram has the ability to simplify compli-cated statistical predictive models into simple graphical representations that generates a numerical probability of a clinical event. The- refore, previous studies have reported that nomograms are more favorable for predicting outcomes in cancers than conventional TNM staging systems [24, 25]. In the present study, we first established and externally validated new nomogram models consisting of mFI, age, BMI, tumor size, tumor grade and pathological T stage, which could predict the probability of die for all-cause and distant metastasis for postoperative patients within 3-, 5- and 10- year. The nomograms performed well in pre-dicting OS (c-index: 0.831) and MFS (c-index: 0.763). These results demonstrated that nomo-grams could accurate predict prognosis in RCC patients after surgery.
screen-ing systems were required to be assessed prospectively.
A higher mFI score (mFI ≥ 2) was revealed as a significant prognostic factor for postoperative long-term survival in patients with non-meta-static RCC. Additionally, the predictive nomo-grams combined with mFI could be used for the prognosis and clinical decision-making for surgeons.
Acknowledgements
All of authors thank Editage for English lan -guage editing. This work did not receive any specific grant from funding agencies in public, commercial, or not-for-profit sectors.
Disclosure of conflict of interest
None.
Address correspondence to: Zhixian Yu, Department
of Urology, The First Affiliated Hospital of Wen-zhou Medical University, WenWen-zhou, China. E-mail: yuzx515@163.com
References
[1] Siegel RL, Miller KD and Jemal A. Cancer sta-tistics, 2017. CA Cancer J Clin 2017; 67: 7-30. [2] Ljungberg B, Bensalah K, Canfield S, Dabes
-tani S, Hofmann F, Hora M, Kuczyk MA, Lam T,
Marconi L, Merseburger AS, Mulders P, Powles T, Staehler M, Volpe A and Bex A. EAU guide-lines on renal cell carcinoma: 2014 update. Eur Urol 2015; 67: 913-924.
[3] Capitanio U and Montorsi F. Renal cancer. Lan-cet 2016; 387: 894-906.
[4] Athar U and Gentile TC. Treatment options for metastatic renal cell carcinoma: a review. Can J Urol 2008; 15: 3954-3966.
[5] Oudard S and Vano Y. The role of rechallenge with targeted therapies in metastatic renal-cell carcinoma. Curr Opin Urol 2015; 25: 402-410. [6] Fried LP, Tangen CM, Walston J, Newman AB,
Hirsch C, Gottdiener J, Seeman T, Tracy R, Kop WJ, Burke G, McBurnie MA; Cardiovascular Health Study Collaborative Research Group.
Frailty in older adults: evidence for a pheno-type. J Gerontol A Biol Sci Med Sci 2001; 56: M146-156.
[7] Jones D, Song X, Mitnitski A and Rockwood K.
Evaluation of a frailty index based on a com-prehensive geriatric assessment in a popula-tion based study of elderly Canadians. Aging Clin Exp Res 2005; 17: 465-471.
[8] Kulminski AM, Ukraintseva SV, Kulminskaya IV,
Arbeev KG, Land K and Yashin AI. Cumulative
deficits better characterize susceptibility to
death in elderly people than phenotypic frailty: lessons from the cardiovascular health study. J Am Geriatr Soc 2008; 56: 898-903.
[9] Song X, Mitnitski A and Rockwood K. Preva -lence and 10-year outcomes of frailty in older
adults in relation to deficit accumulation. J Am
Geriatr Soc 2010; 58: 681-687.
[10] Clough-Gorr KM, Thwin SS, Stuck AE and Silli
-man RA. Examining five- and ten-year survival
in older women with breast cancer using
can-cer-specific geriatric assessment. Eur J Cancer
2012; 48: 805-812.
[11] Searle SD, Mitnitski A, Gahbauer EA, Gill TM and Rockwood K. A standard procedure for
creating a frailty index. BMC Geriatr 2008; 8: 24.
[12] Tsiouris A, Hammoud ZT, Velanovich V, Hodari A, Borgi J and Rubinfeld I. A modified frailty in -dex to assess morbidity and mortality after lo-bectomy. J Surg Res 2013; 183: 40-46. [13] Karam J, Tsiouris A, Shepard A, Velanovich V
and Rubinfeld I. Simplified frailty index to pre -dict adverse outcomes and mortality in vascu-lar surgery patients. Ann Vasc Surg 2013; 27: 904-908.
[14] Patel KV, Brennan KL, Brennan ML, Jupiter DC,
Shar A and Davis ML. Association of a modified frailty index with mortality after femoral neck
fracture in patients aged 60 years and older. Clin Orthop Relat Res 2014; 472: 1010-1017. [15] Cloney M, D’Amico R, Lebovic J, Nazarian M,
Zacharia BE, Sisti MB, Bruce JN, McKhann GM, Iwamoto FM and Sonabend AM. Frailty in geriatric glioblastoma patients: a predictor of operative morbidity and outcome. World Neu-rosurg 2016; 89: 362-367.
[16] Edge SB and Compton CC. The american joint committee on cancer: the 7th edition of the AJCC cancer staging manual and the future of TNM. Ann Surg Oncol 2010; 17: 1471-1474. [17] Kovacs G, Akhtar M, Beckwith BJ, Bugert P,
Cooper CS, Delahunt B, Eble JN, Fleming S,
Ljungberg B, Medeiros LJ, Moch H, Reuter VE, Ritz E, Roos G, Schmidt D, Srigley JR, Storkel S, van den Berg E and Zbar B. The Heidelberg classification of renal cell tumours. J Pathol
1997; 183: 131-133.
[18] Fuhrman SA, Lasky LC and Limas C. Prognostic significance of morphologic parameters in re -nal cell carcinoma. Am J Surg Pathol 1982; 6: 655-663.
[19] Clough-Gorr KM, Stuck AE, Thwin SS and Silli -man RA. Older breast cancer survivors: geriat-ric assessment domains are associated with poor tolerance of treatment adverse effects and predict mortality over 7 years of follow-up. J Clin Oncol 2010; 28: 380-386.
frailty into clinical practice. J Frailty Aging 2013; 2: 121-124.
[21] Gill TM, Gahbauer EA, Allore HG and Han L.
Transitions between frailty states among com-munity-living older persons. Arch Intern Med 2006; 166: 418-423.
[22] Fiatarone MA, O’Neill EF, Ryan ND, Clements
KM, Solares GR, Nelson ME, Roberts SB,
Ke-hayias JJ, Lipsitz LA and Evans WJ. Exercise
training and nutritional supplementation for physical frailty in very elderly people. N Engl J Med 1994; 330: 1769-1775.
[23] McCorkle R, Strumpf NE, Nuamah IF, Adler DC, Cooley ME, Jepson C, Lusk EJ and Torosian M. A specialized home care intervention improves
survival among older post-surgical cancer pa-tients. J Am Geriatr Soc 2000; 48: 1707-1713.
[24] Sternberg CN. Are nomograms better than cur-rently available stage groupings for bladder cancer? J Clin Oncol 2006; 24: 3819-3820. [25] Touijer K and Scardino PT. Nomograms for
staging, prognosis, and predicting treatment outcomes. Cancer 2009; 115: 3107-3111. [26] Mogal H, Vermilion SA, Dodson R, Hsu FC,
Howerton R, Shen P and Clark CJ. Modified
frailty index predicts morbidity and mortality after pancreaticoduodenectomy. Ann Surg On-col 2017; 24: 1714-1721
Figure S1. X-tile analyses of overall survival were performed using patients’ data to determine the optimal cutoff
values for mFI. The sample of RCC patients was divided into the lower mFI group and higher mFI group. X-tile plots of lower mFI group and were shown in the left panels. The optimal cutoff values highlighted by the white lines in the left panels are shown in histograms of the entire cohort (middle panels), and the Kaplan-Meier plots are displayed in the right panels. The optimal cutoff values for mFI was 2 (X2 = 10.938, P = 0.0009).
Figure S2. Example for nomogram predicting the probability of 3-, 5- and 10-year MFS in RCC patients. A RCC
[image:10.612.95.520.270.441.2]