Effect of Pipe Materials on BLE using
Graph-Based Integrated Hydraulic Model
Kazeem B. Adedeji,
Member, IAENG,
Yskandar Hamam,
Member, IAENG,
Bolanle T. Abe,
Member, IAENG,
and Adnan M. Abu-Mahfouz
Abstract—The battle of background leakage estimate (BLE) in water supply networks has been the subject of discussion in the last years. This paper aims to investigate the effect of pipe materials with particular reference to their impact on the BLE in looped water supply networks using a graph-based integrated hydraulic model. In the applications, the hydraulic modelling was carried out through steady-state flow modelling. The model was demonstrated on a water supply network derived from the literature. The results obtained evidence the influence of pipe materials on the background leakage estimation. The effect is more pronounced on very smooth and new cast iron or welded steel pipe while the least effect on BLE is observed when oil cast iron and bricks is considered.
Index Terms—Background leakage, Hydraulic model, Pipe materials, Water loss, Water supply networks.
I. INTRODUCTION
W
ATER loss occurs in all distribution systems, even though the volume of the losses depends on the type of systems and monitoring equipment attached. A major component of water loss is the leakage from the installed piping systems. In water supply systems (WSSs), leakage is inevitable and makes up a larger part, sometimes more than 70% of the total water losses [1]. This has been a threat to the operational services of water utilities and has been a subject of discussion in the last years. In most cases, the level of service provided to the consuming end is usually compromised, whilst reducing the income of water suppliers, and increasing the environmental impact of water extractions [2].With the increasing growth in technology, the use of information and communication technology (ICT) for water network analysis [3] is becoming increasingly common. Wa-ter distribution networks (WDNs) are disperse in nature, and in some cases, measurement data are not always available, the use of advanced computing tools and software package for the analysis of the pipe networks for state estimation, leakage analysis and demand forecasting purposes has im-proved the planning and schedule maintenance of water supply networks. In the last years, the use of geographical information and supervisory control and data acquisition (SCADA) systems in the water industries permit the easy usage of hydraulic modelling for the assessment of water supply network facilities for pressure control and leakage
Manuscript received March 02, 2018; revised April 09, 2018.
This work was supported by the Tshwane University of Technology, Pretoria, South Africa and the Council for Scientific and Industrial Research (CSIR), Pretoria, South Africa.
The authors are with the Department of Electrical Engineering, Tshwane University of Technology, Pretoria South Africa.
A.M. Abu-Mahfouz is also with Meraka Institute, CSIR, Pretoria, South Africa.
Y. Hamam is also an Emeritus Professor, ESIEE-Paris, France. Corresponding author: K.B. Adedeji, Email: [email protected].
analysis. In WDNs, background leakage is often hidden and constitutes a major threat to water loss volume in the system. Because of their diffuse nature, they go unreported for a very long period of time. In recent times, the battle of background leakage estimate combines with optimal pressure control and network rehabilitation [4–14] will be a major breakthrough in reducing the overall water network leakage ratio.
Several research studies have been conducted with the aim of reducing water loss through leaking pipes for leakage management, and control of water losses. Understanding the characteristics of leakage or leakage hydraulics is vital to reducing water loss through leaking pipes. To this effect, several factors have been reported to influence the leakage flow through a hole or crack in pipes. Amongst others, the pressure through the pipe, the soil hydraulics, as well as the water demand pattern, have been reported to influence the behaviour of leaks in WSSs [15]. The pipe material is another interesting factor that cannot be overlooked.
The goal of reducing water losses to an acceptable level remains elusive. Due to the dispersed nature of water supply networks, the problem is more aggravated when a leak occurs in more than one point along a single pipe in the system. Thus, the complexities involved in this problem are much greater than initially thought. Nevertheless, a huge research progress has been made in understanding the various factors that affect water losses, however, much still remains to be done to achieve a well-reduced network leakage ratio. In this paper, the influence of the pipe materials (M1 to M5) on the background leakage estimate (BLE) in a looped water supply system is presented. The rest of the paper is organised as fol-lows. Section II presents the integrated hydraulic modelling of the water supply distribution networks using graph theory. The results of the investigation of a water supply distribution system derived from literature are discussed in Section III while Section IV concludes the paper.
II. GRAPH-BASEDHYDRAULICMODELLING OFWDNS
Using graph theory, a water distribution network (WDN) may be viewed as a connected graph with a finite set of edges and vertices or nodes. The former consist of pipes, pumps, and valves. Conventionally, the basic hydraulic equations de-scribing the flow in a water distribution network are governed by the principle of mass continuity in the node and energy conservation around the hydraulic loop. For any water supply distribution networks comprising of b number of pipes, n number of junction nodes, ns number of source nodes or
fixed-grade nodes (nodes with known pressures), and nl
number of load nodes (nodes with unknown pressures), the total number of nodes in the network is n = ns +nl.
while the energy conservation equation can be written for any loop in the network. For the sake of simplicity, while still maintaining generality, other network elements such as pumps and valves are neglected. Thus, the governing equations result in a system of partly linear and partly non-linear equations which may be expressed as
AQ−ClTPl−CsTPs = 0
ClQ+q = 0
(1)
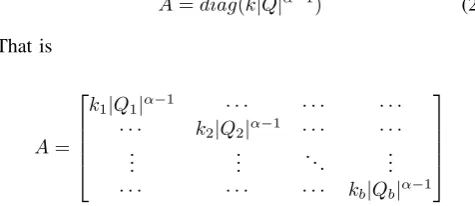
where A is a diagonal matrix of size (b×b) relating the pressure drop to the flow in each pipe. The matrix A may be expressed as
A=diag(k|Q|α−1) (2)
That is A=
k1|Q1|α−1 · · · ·
· · · k2|Q2|α−1 · · · · ..
. ... . .. ...
· · · kb|Qb|α−1
Also in (2), k= [k1, k2, ..., kb]T is a (b×1) vector of the
pipe hydraulic resistance whose values depend on the head loss model used. BothPlandPsare the pressure at the load
and supply nodes respectively. Q and q are the vectors of the flow in each pipe and the demand at the load nodes. The vectorq comprises of the actual nodal demand and the pressure dependent leakage model. Also,Clof size (b×nl)
andCsof size (b×ns) are the incidence sub-matrices derived
from the topological incidence matrixC, withClconnecting
the pipes to the load nodes andCs connecting pipes to the
supply nodes. The matrixC has an element of 1 if the flow in the pipe is entering the node connected to that pipe and an element of -1 if the flow in the pipe is leaving the node connected to such pipe. This may be expressed as
Cij=
+1 if the flow in pipe j enters nodei
−1 if the flow in pipe j leaves nodei 0 if pipe j is not incident to nodei
By solving the system of equations in (1) using a Newton-like method, the iterative solution of the model in (1) at every iteration“t00 may be expressed as
Pl(t+1) = −B−1{q+C
lD−1[(D−A)Q(t)+CsTPs]}
Q(t+1) = Q(t)+D−1[CT l P
(t+1)
l −AQ(t)+CsTPs]
(3)
In (3),
B =ClD−1ClT (4)
whereB represents the network admittance matrix which is symmetry and highly sparse,D∈ <b×b is a diagonal matrix
whose elements are the partial derivatives of the matrix A
A. Accounting for background leakage model in the vector q
Background leakage flow occurs continuously along the length of a pipe and it is usually lumped at the pipe end nodes. If Q¯ denotes the vector of the background leakage flow along all the pipes defined by Germanopoulos [16], then the vector of the nodal leakage level may be expressed as
¯ qnleak=
1 2ψ
¯
Q (5)
whereq¯nleakrepresents the vector of the leakage flow at the
node andψ is the absolute of the network incidence matrix C. That is,
ψ=|C| (6)
[image:2.595.49.287.230.333.2]III. RESULTS ANDDISCUSSIONS
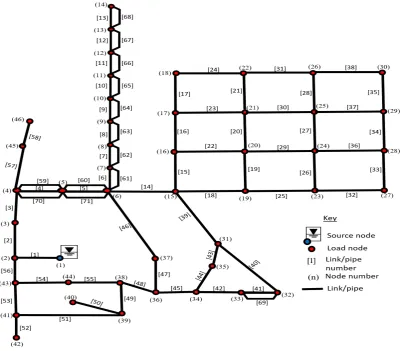
Fig. 1 shows the schematic diagram of the case study water supply network used for the numerical example 1. As may be observed in Fig. 1, the network consist of 1 supply node (or source node) and 45 demand or load nodes. The supply node (node 1) and the load nodes (which indexes from node 2 to node 46) are interconnected by a series of pipes of varying lengths and diameters between 25m to 300m and 80mmto 300mmrespectively. The base demand at the load nodes varies between 0.19l/sto 12.4l/s. The hydraulic data relevant to this network may be found in [17].
Fig. 2 shows the profile of the leakage flow at the pipe level for the case study water supply network used in the numerical example. The figure demonstrates the variability in the background leakage outflow that exists among individual pipes with different materials. Depending on the boundary conditions surrounding each pipe, it may be observed that, in most cases, the least impact on the background leakage estimation is observed when an oil cast iron and bricks are considered. Moreover, the most effect on the BLE is noticed in very smooth pipe and new cast iron or welded steel.
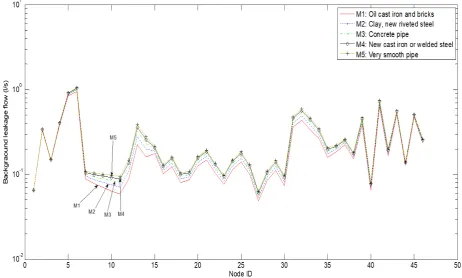
Fig. 3 shows the nodal leakage flow for the case study water supply network used in the numerical example. When different pipe materials are investigated, the variability in the background leakage flow that exists among individual nodes is illustrated. From this figure, and in a similar manner to the result presented in Fig. 2, at the node level, it may be observed that oil cast and bricks have the least influence on the background leakage outflow while the significant effect is noticed when a very smooth pipe and new cast iron or welded steel is considered.
Fig. 1. The layout of the water supply distribution networks used for the numerical example.
[image:3.595.66.527.475.752.2]Fig. 3. Nodal leakage outflow.
IV. CONCLUSION
With the increasing growth in technology, the adoption of ICT which permits the use of hydraulic models for water network analysis and leakage reduction is becoming increas-ingly common. The goal of reducing water losses to an acceptable level remains elusive. Due to the dispersed nature of water supply networks, the problem is more aggravated when a leak occurs in more than one point along a single pipe in the system. Nevertheless, a huge research progress has been made in understanding the various factors that affect water losses. In this paper, the influence of the pipe materials (M1 to M5) on the background leakage estimate in a looped water supply system is discussed. The overall simulation results indicate the influence of pipe materials on the background leakage estimation. While the effect is more pronounced on very smooth and new cast iron or welded steel pipe, the least effect is observed when an oil cast iron and bricks are considered.
REFERENCES
[1] WHO, “World Health Organisation, leakage manage-ment and control - A best practice manual,” WHO, Geneva, 2001.
[2] J.E. Van Zyl, C.R.I. Clayton, “The effect of pressure on leakage in water distribution systems,”Water Man-agement, vol. 160, 2014, pp. 109–114.
[3] K.B. Adedeji, Y. Hamam, B.T. Abe, A.M. Abu-Mahfouz, “A spreadsheet tool for the analysis of flows in small-scale water piping networks,”In: Proceedings of the IEEE 15th International Conference of Industrial Informatics2017a, pp. 1213–1218.
[4] K.B. Adedeji, Y. Hamam, B.T. Abe, A.M. Abu-Mahfouz, “Leakage detection and estimation algorithm for loss reduction in water piping networks,”Water, vol. 9, 2017b, pp. 1–21.
[5] K.B. Adedeji, Y. Hamam, B.T. Abe, A.M. Abu-Mahfouz, “Towards achieving a reliable leakage detec-tion and localizadetec-tion algorithm for applicadetec-tion in water piping networks: An overview,” IEEE Access, vol. 5, 2017c, pp. 20272–20285.
[6] K.S. Hindi, Y. Hamam, Y, “Locating pressure control elements for leakage minimization in water supply networks: An optimization model,”Engineering Opti-misation, vol. 17, 1991a, pp. 281–291.
[7] K.S. Hindi, Y. Hamam, Y, “Pressure control for leakage minimization in water supply networks part 1: Single period models,” International Journal of System Sci-ence, vol. 22, 1991b, pp. 1573–1585.
[8] K.S. Hindi, Y. Hamam, “Pressure control for leakage minimization in water supply networks: Part 2. multi-period models,” International Journal of System Sci-ence, vol. 22, 1991c, pp. 1587–1598.
[9] P.R. Page, A.M. Abu-Mahfouz, S. Yoyo, “Parameter-less remote real-time control for the adjustment of pres-sure in water distribution systems,” Journal of Water Resource Planning and Management, vol. 48, 2017, doi:10.1061/(ASCE)WR.1943-5452.00008057.
[10] P.R. Page, A.M. Abu-Mahfouz, M. Mothetha, “Pres-sure management of water distribution systems via the remote real-time control of variable speed pumps,”
Journal of Water Resource Planning and Management, vol. 143, no. 8, 2017, pp. 1-6.
[11] P.R. Page, A.M. Abu-Mahfouz, S. Yoyo, “Real-time adjustment of pressure to demand in water distribution systems: Parameter-less P-controller algorithm,” Proce-dia Engineering, vol. 154, no. 7, 2016, pp. 391397. [12] K.B. Adedeji, Y. Hamam, B.T. Abe and A.M.
Abu-Mahfouz, “Pressure Management Strategies for Water Loss Reduction in Large-Scale Water Piping Networks: A Review,” In: Gourbesville P., Cunge J., Caignaert G. (eds), Advances in Hydroinformatics, Springer Water, Springer, Singapore, 2018, pp. 465-480.
[13] P.R. Page, A.M. Abu-Mahfouz, O. Piller , M. Moth-etha and M.S. Osman, “Robustness of parameter-less remote real-time pressure control in water distribution systems,” In: Gourbesville P., Cunge J., Caignaert G. (eds), Advances in Hydroinformatics, Springer Water, Springer, Singapore, 2018, pp. 449-463.
[14] L. Berardi, D. Laucelli R. Ugarelli O. Giustolisi, “Hy-draulic system modelling: Background leakage model calibration in Oppegrd municipality,” Procedia Engi-neering, vol. 119, 2015, pp. 633–642.
[15] J.E. Van Zyl, “Theoretical modelling of pressure and leakage in water distribution systems,” Proceedia En-gineering, vol. 89, 2014, pp. 273–277.
[16] G. Germanopoulos, “A technical note in the inclusion of pressure dependent demand and leakage terms in water supply network models,” Civil Engineering Systems, vol. 2, 1985, pp. 171–179.