JHEP07(2014)097
Published for SISSA by SpringerReceived: March 10, 2014 Revised: April 28, 2014 Accepted: June 17, 2014 Published: July 21, 2014
The bottomonium spectrum at finite temperature
from
N
f= 2 + 1
lattice QCD
G. Aarts,a C. Allton,a T. Harris,b S. Kim,c M. P. Lombardo,d S. M. Ryan,b
and J.-I. Skullerude
aDepartment of Physics, College of Science, Swansea University,
Swansea, United Kingdom
bSchool of Mathematics, Trinity College,
Dublin 2, Ireland
cDepartment of Physics, Sejong University,
Seoul 143-747, Korea
dINFN-Laboratori Nazionali di Frascati,
I-00044, Frascati (RM) Italy
eDepartment of Mathematical Physics, National University of Ireland Maynooth,
Maynooth, County Kildare, Ireland
E-mail: g.aarts@swan.ac.uk,c.allton@swansea.ac.uk,tharris@tcd.ie, skim@sejong.ac.kr,Mariapaola.Lombardo@lnf.infn.it,
ryan@maths.tcd.ie,jonivar@thphys.nuim.ie
Abstract:We present results on the bottomonium spectrum at temperatures above and
below the deconfinement crossover temperature, Tc, from dynamical lattice QCD simu-lations. The heavy quark is treated with a non-relativistic effective field theory on the lattice and serves as a probe of the hot medium. Ensembles with a finer spatial lattice spacing and a greater range of temperatures below Tc than those previously employed by this collaboration are used. In addition, there are Nf = 2 + 1 flavours of Wilson clover quark in the sea with Mπ ≈400 MeV and we perform a more careful tuning of the bottom quark mass in this work. We calculate the spectral functions of S and P wave bottomonium states using the maximum entropy method and confirm earlier findings on the survival of the ground state S wave states up to at least 2Tc and the immediate dissociation of the P wave states above Tc.
Keywords: Lattice QCD, Thermal Field Theory
JHEP07(2014)097
Contents1 Introduction 1
2 Lattice set-up 2
2.1 Lattice NRQCD 3
2.2 Zero temperature results 5
3 Bottomonium at finite temperature 7
3.1 Thermal modification of correlation functions 8
3.2 Spectral functions 10
4 Systematic tests of MEM 10
5 Conclusions 13
A Free lattice spectral functions 14
1 Introduction
The dissociation of heavy quarkonia in a deconfined medium may provide a valuable ther-mometer for relativistic heavy-ion collisions [1]. Dissociation, or melting, contributes to the suppression of the yield of these states in nuclear collisions compared with hadronic ones [2]. Suppression patterns [3, 4] are complicated by the statistical recombination of heavy quarks in the quark-gluon plasma (QGP). However, competing effects are expected to be less pronounced for bottomonium than for charmonium [5]. Indeed sequential suppres-sion has been observed recently in the Υ system by CMS at the LHC [6]. It is therefore desirable to understand the dissociation of mesons in the bottomonium system from ab initio QCD.
Analytic results from effective field theories [7–12] can aid the identification and inter-pretation of the relevant physical phenomena, such as the role of the finite width of such states in the plasma as well as the familiar colour-Debye screening mechanism [9]. However, in order to achieve a separation of scales, they generally rely on a choice of the parametric size of the temperature, for instance T ∼gmb orT ∼g2mb, where mb is the heavy quark mass andgis the coupling which is assumed to be sufficiently weak for a hierarchy of scales to emerge. In contrast, by directly simulating the non-relativistic field theory for the heavy quark (NRQCD) non-perturbatively, all that is required is thatmb T, which is certainly satisfied for the bottom quark in the relevant regime up to 4 or 5Tc.
JHEP07(2014)097
around the crossover temperature, Tc. However, it remains a challenge to controlsystem-atic errors in dynamical lattice simulations. This paper continues the work of thefastsum
collaboration’s programme to investigate phenomenologically relevant observables in the QGP with improved control over uncertainties [13–17]. Here, we calculate bottomonium spectral functions fromNf = 2+1 ensembles using the maximum entropy method. The de-termination of the spectral functions from the lattice aims to complement other approaches such as weak-coupling effective field theory and potential models [5,18–24] to give a com-plete understanding of the behaviour of heavy quarkonium through the deconfinement crossover.1
An earlier analysis of the spectral functions by this collaboration from Nf = 2 flavour ensembles suggested the ground state S waves (ηb and Υ channels) survive up to at least 2Tc while the first excited state may be suppressed in the deconfined phase, both at zero [14] and non-zero momentum [15]. Those conclusions are consistent with predictions from effective field theory [9] and experimental data [6], although a detailed comparison with the latter is beyond the scope of these lattice studies. An examination of the correlation functions indicated [13] that the P waves (hb, χb1,2,3 channels) are greatly modified directly aboveTc. By comparison with the expectations from the free continuum effective theory the observed thermal modification of the correlators provided evidence in favour of the hypothesis that the P waves dissociate soon above the crossover temperature. This interpretation was supported by the examination of the spectral functions in those channels [16].
In this paper we extend the Nf = 2 analysis by using newNf = 2 + 1 ensembles with improved lattice parameters. The results for the spectral functions are compatible with earlier findings but in the analysis of the correlators we note that the finite threshold plays a more prominent role, discussed in section 3.1. The following section outlines the simu-lation details and zero temperature calibration. We present the bottomonium correlators and spectral functions at finite temperature in section 3, discuss systematic effects in the spectral function reconstruction in section 4and conclude in section 5.
2 Lattice set-up
In this work we employ ensembles with anisotropic lattice spacings, using a tadpole-improved Wilson clover quark action for the light and strange quarks and a tadpole- and Symanzik-improved gauge action. Tree-level improvement coefficients are used for both the fermion and gauge actions. The tuning of the lattice parameters was performed by the Hadron Spectrum Collaboration and further discussion can be found in ref. [31]. A range of temperatures above and below the deconfinement crossover is accessible from 0.76Tcto 1.90Tc. The fixed-scale approach is used whereby the temperature is varied by changing the number of temporal lattice sites while the lattice spacings are kept constant. This reduces the overhead of zero temperature simulations required to tune the lattice parameters. The renormalized anisotropy, ξ ≡as/aτ, is tuned to ξ = 3.5, which allows us to maintain an
1Previous studies of quarkonium spectral functions from lattice QCD, mostly for charmonium, can be
JHEP07(2014)097
Ns 16 24 24 24 24 24 24 24
Nτ 128 40 36 32 28 24 20 16
[image:4.595.142.455.84.160.2]T /Tc ∼0 0.76 0.84 0.95 1.09 1.27 1.52 1.90 T (MeV) ∼0 141 156 176 201 235 281 352 Ncfg 499 502 503 998 1001 1002 1000 1042
Table 1. Summary of the ensembles used in this work. The crossover temperature is determined from the renormalized Polyakov loop [32]. The zero temperature tuning of the lattice parameters was completed by the Hadron Spectrum Collaboration [31].
Nf as (fm) a−τ1 (GeV) ξ Mπ/Mρ asmb E (MeV) First generation 2 0.162 7.35 6 0.54 4.5 8570 Second generation 2 + 1 0.1227(8) 5.63(4) 3.5 0.45 2.92 8252(9)
Table 2. Comparison between lattice parameters used in earlier work [13–16, 34, 35] (first gener-ation) and this work (second genergener-ation). E is the additive shift in the bottomonium energy, see eq. (2.6).
adequate resolution of the correlation functions to obtain the spectral functions at high temperatures.
These “second generation” ensembles [17] represent multiple improvements over the “first generation” ones used in the previous work by this collaboration [13–16]. In particu-lar, the spatial lattice spacing,as= 0.1227(8) fm is finer, while Mπ/Mρ∼0.45 is reduced. Moreover, the strange quark is now included in the sea. Details are given in tables1and2. On these ensembles the pion is relatively heavy,Mπ ≈400 MeV, while the kaon is roughly physical, MK ≈ 500 MeV [33]. The highest accessible temperature is slightly reduced in this study with respect to the earlier work.
2.1 Lattice NRQCD
NRQCD is an effective field theory with power counting in the heavy quark velocity in the bottomonium rest frame,v∼ |p|/mb [36]. The finite lattice spacing cuts off the relativistic modes of the heavy quark in the discretized theory. The heavy quark and anti-quark fields decouple and their numbers are separately conserved. Their propagators, S(x), solve an initial-value problem whose discretization leads to the following choice for the evolution equation
S(x+aτeτ) =
1−aτH0|τ+aτ 2k
k
Uτ†(x)
1−aτH0|τ 2k
k
(1−aτδH)S(x), (2.1)
withUτ(x) being the temporal gauge link at site x and eτ the temporal unit vector. The leading-order Hamiltonian is defined by
H0 =− ∆(2) 2mb
, with ∆(2n)= 3 X
i=1
∇+i ∇−i
n
JHEP07(2014)097
0.2
0.21
0.22
0.23
0.24
0.25
0
0.2
0.4
0.6
0.8
1
1.2
a
τE
(
ˆ
P
2)
a
2sP
ˆ
2η
b [image:5.595.146.457.85.270.2]Υ
Figure 1. Zero temperature dispersion relations in theηb and Υ channels used to determine the
1S spin-averaged kinetic mass,M2(1S), with fits given in eq. (2.5).
The higher order covariant finite differences are written in terms of the components of the usual forward (∇+i ) and backward (∇−i ) first order ones. The correction terms are given by
δH =− ∆ (2)2
8m3 b
+ ig0 8m2
b
∇±·E−E·∇±
− g0
8m2 b
σ· ∇±×E−E×∇±
− g0
2mb
σ·B
+a 2 s∆(4) 24mb −
aτ ∆(2)
2
16km2b ,
(2.3)
which incorporateO(v4) corrections as well as the leading spin-dependent corrections. The matching coefficients are determined at tree-level. The terms on the final line of eq. (2.3) remove theO(a2
s) errors in H0 and the O(aτ) errors of the evolution equation respectively. The choice of k = 1 for Lepage’s parameter is sufficient for these anisotropic lattices in order to satisfy the stability criterion max|1−aτH0/2k|< 1. Other choices of k = 2,3 were investigated but their effects are negligible. The clover definition of the field-strength tensor is used to define the unimproved chromoelectric and magnetic fields and ∇± is the symmetric covariant finite difference operator. Tadpole improvement is implicit and implemented by dividing all links by the mean link determined from the fourth root of the average plaquette.
JHEP07(2014)097
temperature which appears in the hadronic lattice dispersion relationaτE( ˆP2) =aτE(0) +
a2sPˆ2 2ξ2a
τM2 +. . . ,
a2sPˆ2 = 4 3 X
i=1 sin2
πni Ns
.
(2.4)
whereni=−Ns/2 + 1, . . . , Ns/2. In this work we tune the heavy quark mass by requiring the spin-averaged 1S kinetic mass, M2(1S) = (M2(ηb) + 3M2(Υ))/4, to be equal to its experimental value. Using the spin-averaged kinetic mass mitigates the systematic error due to the determination of the hyperfine splitting in the kinetic mass [38]. The fits to the dispersion relations, shown in figure 1, at the tuned value of the heavy quark mass asmb= 2.92, are given by
aτE(ηb; ˆP2) = 0.2058(2) + 0.0239(3)a2sPˆ2, aτE(Υ; ˆP2) = 0.2150(3) + 0.0241(3)a2sPˆ2,
(2.5)
with a statistical error determined from a bootstrap analysis. Higher order terms in the dispersion relation could not be resolved within the statistical precision. The tuned value of the heavy quark mass corresponds toM2(1S) = 9560(110) MeV which is consistent with the experimental value,Mexpt(1S) = 9444.7(8) MeV. The error includes a contribution from the statistical uncertainty in the scale set from the Ω baryon mass [39]. This tuning is an improvement over the ad hoc choice of the heavy quark mass in the previous study.
2.2 Zero temperature results
Figure 2shows correlation functions in the Υ (red crosses) and χb1 (blue circles) channels and the energies, aτE, determined from single exponential fits at large Euclidean times. The experimental Υ(1S) mass,Mexpt(Υ), is used to determine the overall energy shift, E, of spectral quantities
E=Mexpt(Υ)−E(Υ; ˆP2 = 0) = 8252(9) MeV, (2.6)
so that E +E(Υ) is fixed to the experimental Υ(1S) mass. This allows us to compare the NRQCD energies directly with the experimental spectrum, shown in table3. We note that in ref. [40] a heavy quark action with O(v6) corrections was used in conjunction with the same zero temperature ensemble used in this work. Slight discrepancies between the spectra could arise from a different heavy quark action including a different choice for the matching coefficients. Precision studies of the zero temperature bottomonium spectrum using NRQCD have been performed by the HPQCD collaboration [38,41].
The maximum entropy method (MEM) with Bryan’s algorithm [43] was used to obtain the spectral functions, ρ(ω), from the hadronic correlation functions, which are related through
G(τ) =
Z ωmax
ωmin dω
2π K(τ, ω)ρ(ω), K(τ, ω) =e
JHEP07(2014)097
10
−1510
−1210
−910
−610
−310
00
20
40
60
80
100
120
G
(
τ
)
/G
(0
)
τ /a
τa
τE
(Υ) = 0
.
21460(5)
[image:7.595.148.447.84.270.2]a
τE
(
χ
b1) = 0
.
2964(4)
Figure 2. Correlation functions in the Υ and χb1 channels with the corresponding ground state energies extracted from exponential fits. Filled symbols denote negative data excluded from the fit.
n2S+1L
J State aτE E+E (MeV) Mexpt (MeV) 11S
0 ηb 0.20549(4) 9409(12) 9398.0(3.2) 21S0 ηb0 0.311(3) 10004(21) 9999(4) 13S1 Υ 0.21460(5) 9460* 9460.30(26) 23S
1 Υ0 0.318(3) 10043(22) 10023.26(31) 11P1 hb 0.2963(4) 9920(15) 9899.3(1.0) 13P0 χb0 0.2921(4) 9896(15) 9859.44(52) 13P
1 χb1 0.2964(4) 9921(15) 9892.78(40) 13P2 χb2 0.2978(4) 9928(15) 9912.21(40)
Table 3. Bottomonium spectrum from standard exponential fits where the Υ mass has been used to set the absolute energy shift,E. The error quoted in the third column is statistical, while the error in the fourth column includes a contribution from the statistical uncertainty in the scale [33, 39]. The experimental masses are taken from the Particle Data Group booklet [42].
The lower limit aτωmin ∼ 0 can be negative or positive since aτω = 0 corresponds to E determined in eq. (2.6), while the upper limit aτωmax ∼ 2 should be large enough to accommodate all spectral features of interest. These boundaries have been varied to ensure the stability of the results, see section4.
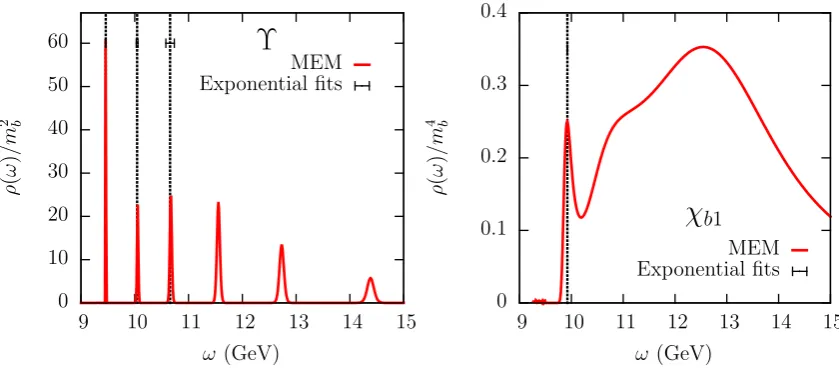
Although this is a typical ill-posed problem given the discrete and noisy estimator for the correlation function, G(τ), MEM gives a unique solution after specification of the default model. Further details on the implementation used can be found in ref. [14], where also the default model dependence is studied in detail. Figure3shows the spectral functions in the S wave Υ (left) and P wave χb1 (right) channels along with energies extracted from multi-exponential fits directly to the correlators using theCorrFitterpackage [44]
[image:7.595.146.450.324.461.2]JHEP07(2014)097
010 20 30 40 50 60
9 10 11 12 13 14 15
ρ
(
ω
)
/m
2 b
ω(GeV)
Υ
MEM Exponential fits
0 0.1 0.2 0.3 0.4
9 10 11 12 13 14 15
ρ
(
ω
)
/m
4 b
ω(GeV)
χ
b1 [image:8.595.87.507.83.268.2]MEM Exponential fits
Figure 3. Spectral functions in the Υ (left) and χb1 (right) channels at zero temperature with energies determined from exponential fits shown as black dotted lines with statistical errors.
functions. We note that while as many as six well-defined peaks can be discerned in the S wave channel presented here, the third and higher peaks are not compatible with the experimental spectrum [42]. A more thorough investigation of the zero temperature spectrum could be undertaken following the HPQCD approach [38,41].
3 Bottomonium at finite temperature
The heavy quarks are valence quarks which propagate through the thermal medium ac-cording to the solution of the initial value problem in NRQCD. Their propagators do not satisfy anti-periodic thermal boundary conditions so the heavy quarks are not in thermal equilibrium with the medium. This is illustrated in the representation of the correlation function in eq. (2.7) which is manifestly not symmetric aboutτ = 1/2T, while the kernel, K(τ, ω), is independent of the temperature. The thermal modification of the correlators can therefore be directly attributed to the modification of the associated spectral function. The asymmetry of the hadronic correlation functions can be seen explicitly in figure 2. These simplifications result from replacingω →2mb+ω and taking themb/T → ∞ limit in the standard kernel at finite temperature
K(τ, ω) = cosh(ωτ −ω/2T) sinh(ω/2T) =e
−ωτ(1 +n
B(ω)) +eωτnB(ω)→e−ωτ, (3.1)
wherenB(ω) = 1/(exp(ω/T)−1) is the Bose-Einstein distribution.
JHEP07(2014)097
0.99 1 1.01 1.02 1.03 1.04 1.050 5 10 15 20 25 30 35 40
G ( τ ; T ) /G ( τ ; T ≈ 0)
τ /aτ
Υ
1.90 =T /Tc
1.52 1.27 1.09 0.95 0.84 0.76
1 1.04 1.08 1.12 1.16 1.2
0 5 10 15 20 25 30 35 40
G ( τ ; T ) /G ( τ ; T ≈ 0)
τ /aτ
χ
b1T /Tc= 1.90
[image:9.595.87.509.83.241.2]1.52 1.27 1.09 0.95 0.84 0.76
Figure 4. Thermal modification,G(τ;T)/G(τ;T ≈0), of the correlation functions in the Υ (left) andχb1(right) channels.
3.1 Thermal modification of correlation functions
The ratios of the correlation functions at finite temperature to those at zero temperature are shown in figure 4. With increasing temperature the enhancement of the correlators sets in at earlier temporal separations. We observe temperature dependence already below Tc and stronger dependence above Tc. An enhancement of approximately 4% is seen in the S wave Υ channel (left) above Tc but there is a greater effect of almost 20% in the P wave χb1 channel (right). The enhancement relative to the low temperature correlators in the Nf = 2 studies [14,16] was approximately 2% and 25% in the S wave and P wave channels, respectively. The correlators in the other S wave (ηb) and P wave (hb, χb0, χb2) channels show analogous modifications to the Υ andχb1channels. Typically, as the temper-ature is increased an enhancement is seen in the ratio of quarkonium correlators, both for NRQCD [14,16] and in relativistic charmonium studies [27,28]. It is easy to see that both thermal broadening of the ground state peak and non-exponential decay of the correlator result in an enhancement of these ratios.
The S wave effective mass displays little temperature dependence (figure 5, left) but a clear effect is seen in the P wave channel effective mass (right). In ref. [13] it was also observed that the S wave effective mass showed little variation with temperature while the temperature dependence in the P wave channel effective mass was even more pronounced than visible here.
It is useful to compare the effective mass at high temperatures with that in the non-interacting infinite temperature limit. In continuum NRQCD the spectral functions are known for free heavy quarks [9], and are given by
ρfree(ω)∝(ω−ω0)αΘ(ω−ω0), where α = (
1/2, S wave.
3/2, P wave. (3.2)
JHEP07(2014)097
0.20.3 0.4 0.5
5 10 15 20 25 30 35 40
aτ
M
eff
(
τ
)
τ /aτ
Υ
T /Tc= 0.76
0.84 0.95 1.09 1.27 1.52 1.90
0.3 0.4 0.5 0.6
5 10 15 20 25 30 35 40
aτ
M
eff
(
τ
)
τ /aτ
χ
b1T /Tc= 0.76
[image:10.595.85.509.80.241.2]0.84 0.95 1.09 1.27 1.52 1.90
Figure 5. Temperature dependence of the effective mass in the Υ (left) and theχb1(right) channels.
atω = 0 in the free effective theory. While the energy shift, E, is defined at zero temper-ature the threshold, ω0, may be temperature dependent, e.g. due to the thermal dressing of the quarks. In the infinite temperature limit the correlation functions then have the following behaviour
Gfree(τ)∝ e−ω0τ
τα+1, (3.3)
and the effective mass becomes
Meff(τ)≡ − 1 G(τ)
dG(τ) dτ
G=Gfree
−→ ω0+ α+ 1
τ . (3.4)
Pure power law decay in the correlator or the absence of plateaus in the effective mass may be less evident the more ω0 deviates from zero (or the threshold from the additive constantE). In the earlier Nf = 2 studies comparisons between the correlators and effec-tive mass and their non-interacting counterparts were possible without including a finite threshold. However, the threshold appears to play a more significant role here which is reflected in the fact that there is a change in the energy shift,E, of about 300 MeV between the two studies, see table 2. The convergence of the effective mass in the Υ channel at high temperatures to a plateau (figure 5, left) demonstrates the unchanged nature of the ground state in the plasma. The discrepancies in the χb1 channel (right) above Tc are indicitative of a significant thermal broadening of the ground state or power-law decay of the correlator, characteristic of unbound quarks. The spectral functions in the following section offer further insight into the interpretation of the temperature effects.
JHEP07(2014)097
0.98 1 1.02 1.04 1.06 1.08 1.1 1.120 2 4 6 8 10 12 14 16
G ( τ ; T = 1 . 90 Tc ) /G ( τ ; T ≈ 0)
τ /aτ
Υ
asmb= 1.20
2.00 2.92 4.01 12.32
0.95 1 1.05 1.1 1.15 1.2 1.25 1.3 1.35 1.4
0 2 4 6 8 10 12 14 16
G ( τ ; T = 1 . 90 Tc ) /G ( τ ; T ≈ 0)
τ /aτ
χ
b1asmb= 1.20
[image:11.595.88.507.84.242.2]2.00 2.92 4.01 12.32
Figure 6. Dependence on the heavy quark mass of the modification in the correlators at the highest accessible temperature,T /Tc = 1.90, in the Υ (left) andχb1 (right) channels.
χb1 (right) channels. Correlators in the χb1 channel exhibit greater thermal modification than in the Υ channel at each of the lattice heavy quark masses investigated. At smaller values of the heavy quark mass, approaching the charm quark mass, a large enhancement is seen even in the Υ channel correlation function, while for large values of the heavy quark mass some enhancements are still seen in the χb1 channel. The mass dependence has also been investigated in theNf = 2 case [45].
3.2 Spectral functions
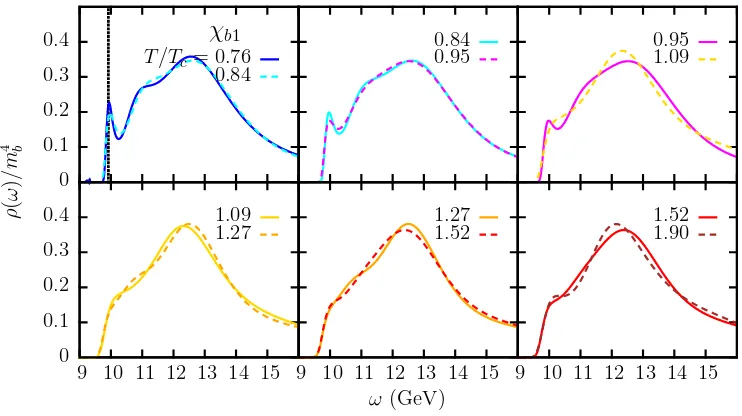
Figures 7 and 8 depict the spectral functions in the Υ and χb1 channels respectively at temperatures from 0.76Tcup to 1.90Tc. For clarity each panel displays just two neighbour-ing temperatures. In the Υ channel the ground state peak is clearly visible and coincides with the energy extracted from the exponential fit to the correlation function at zero tem-perature, see figure 3(left). The ground state peak persists at all accessible temperatures demonstrating the survival of the ground state to at leastT = 1.90Tc. We observe a broad-ening in the peak and a decrease in its height aboveTc. BelowTc the second peak may be identified with the first excited state. Its interpretation above Tc is less clear which may be due to melting as well as the possible presence of lattice artefacts in the high frequency part of the spectral function, which are discussed further in appendix A.
In the χb1 channel the ground state peak can be discerned at temperatures below the Tc and agrees with the energy from the exponential fit at zero temperature. This peak is observed to disappear immediately in the deconfined phase which we suggest indicates the dissociation of this state almost as soon as the deconfined phase is reached. We note that the ground state peak in the P wave channels is harder to distinguish than in the S wave channels, even belowTc.
4 Systematic tests of MEM
JHEP07(2014)097
02 4 6 8 10 12
0 1 2 3 4 5
9 10 11 12 13 14 15
ρ
(
ω
)
/m
2 b
9 10 11 12 13 14 15
ω (GeV)
9 10 11 12 13 14 15
Υ
T /Tc= 0.76
0.84
0.84
0.95 01..9509
1.09
[image:12.595.118.479.82.298.2]1.27 11..2752 11..5290
Figure 7. Temperature dependence of the reconstructed spectral function in the Υ channel. The dashed black lines in the first panel indicate the ground state and first excited state energies deter-mined from multi-exponential fits at zero temperature. Note the different ordinate scale between the upper and lower panels.
0 0.1 0.2 0.3 0.4
0 0.1 0.2 0.3 0.4
9 10 11 12 13 14 15
ρ
(
ω
)
/m
4 b
9 10 11 12 13 14 15
ω(GeV)
9 10 11 12 13 14 15
χ
b1 T /Tc= 0.760.84
0.84
0.95 01..9509
1.09
1.27 11..2752 11..5290
Figure 8. Temperature dependence of the reconstructed spectral function in theχb1 channel with the zero temperature ground state energy shown in the first panel with a dashed black line.
[image:12.595.113.484.371.579.2]JHEP07(2014)097
01 2 3 4 5 6 7
ρ
(
ω
)
/m
2 b
0 0.1 0.2 0.3 0.4
0 0.4 0.8 1.2 1.6
ρ
(
ω
)
/m
4 b
aτ(ω−ωmin)
0 0.4 0.8 1.2 1.6 2
Υ
, N
τ= 28
[2, 25]
[2, 26]
[2, 27]
[3, 25]
[3, 26]
[3, 27]
Υ
, N
τ= 20
[2,17]
[2,18]
[2,19]
[3,17]
[3,18]
[3,19]
χ
b1, N
τ= 28
[2, 25]
[2, 26]
[2, 27]
[3, 25]
[3, 26]
[3, 27]
χ
b1, N
τ= 20
[2,16]
[2,18]
[2,19]
[3,16]
[3,17]
[image:13.595.114.483.82.340.2][3,19]
Figure 9. Stability of the reconstructed spectral function with respect to selection of temporal correlator data [τ1/aτ, τ2/aτ] shown in the key for the Υ (top) andχb1 (bottom) channels, for two temperatures corresponding toNτ = 28 (left) andNτ = 20 (right). The results when the largest
temporal separation (τ /aτ =Nτ−1) is included are shown with dashed lines.
The stability of the spectral function with the variation of the temporal range of the correlation functions used in the reconstruction is shown in figure9. The spectral functions are stable as long as data at temporal separations close toτ /aτ = 0 or Nτ are excluded on account of lattice artefacts. Effects due to the inclusion of temporal separations near Nτ have also been discussed in ref. [16]. Although there are no temporal boundary conditions for the heavy quark fields, we recall that the gauge fields are periodic. Since the spatial lattice spacing is coarser than the temporal one,as= 3.5aτ, effects at separations close to Nτ may be expected at this scale. The effect is stronger in the P wave channels [16].
In the Υ channel (figure9, top panels) the spectral function is stable when varying the temporal window as long as the correlator datum closest to τ /aτ = 0 is omitted. In the χb1 channel (figure 9, bottom panels) the spectral function is stable as long as the largest temporal separation τ /aτ =Nτ−1 is also excluded. Therefore the reconstructed spectral function converges in all cases when the range of correlator data, [τ1/aτ, τ2/aτ], is chosen such thatτ1/aτ &1 andτ2/aτ .Nτ −1.
JHEP07(2014)097
0 2 4 6 8 10 12 14
0 0.5 1 1.5 2
ρ
(
ω
)
/m
2 b
aτ(ω−ωmin)
Υ
, N
τ= 40
[image:14.595.145.457.83.272.2]{2, 3,4, . . . ,38} {2, 4,6, . . . ,38}
Figure 10. Reconstructed spectral function in the Υ channel using a subset of the correlator data compared with using the full correlator data.
Υ χb1
Nτ aτωmin, aτωmax aτωmin, aτωmax 128 0.12, 2.12 0.18, 2.18
[image:14.595.198.397.321.468.2]40 0.08, 2.08 0.16, 2.16 36 0.08, 2.08 0.16, 2.16 32 0.08, 2.08 0.16, 2.16 28 0.08, 2.08 0.10, 2.10 24 0.08, 2.08 0.08, 2.08 20 0.00, 2.00 0.00, 2.00 16 -0.04, 1.96 -0.04, 1.96
Table 4. Frequency ranges used in reconstruction of the spectral functions. The frequency interval is discretized intoNω= 1000 points for eachNτ.
The frequency domain chosen for each reconstruction of spectral function is given in table 4. This interval must be chosen judiciously and may extend to negative frequencies as the energies can be shifted by an a priori unknown constant in the effective theory. Furthermore, this range must be sufficiently large to exclude unphysical spectral weight which has been observed to appear at the edges of the interval.
5 Conclusions
JHEP07(2014)097
These enhancements are greater in the P wave than the S wave channels for eachtempera-ture below and aboveTc. There is significant quark mass dependence in these modifications, with lighter states showing increased temperature dependence.
Further interpretation is aided by calculating the spectral functions using MEM. At zero temperature the reconstructed spectral functions have localised peaks coincident with bound state energies extracted directly from the correlation functions. The analysis of the spectral functions at finite temperature suggests the survival of the ground state S waves (Υ, ηb) up to at least 1.90Tc with some modification above Tc. Their first excited states (Υ(2S), ηb(2S)) appear to dissolve close to Tc, although the proximity of lattice artefacts complicates the interpretation of these structures. The ground state P wave (χb1,2,3, hb) peaks are suppressed immediately above the crossover temperature indicating significant alterations, compatible with the dissociation of this state in the QGP. These results are qualitatively consistent with the conclusions of the earlier Nf = 2 studies and a system-atic comparison between the temperature dependence of the peak positions and widths is underway. In the future we also plan to investigate the momentum dependence of the bot-tomonium spectral functions and examine new Bayesian approaches to the reconstruction of the spectral functions [46,47].
Acknowledgments
We thank D. K. Sinclair for code used in the calculation of the heavy quark propagators and A. Rothkopf for stimulating discussions about the Bayesian reconstruction of the spectral functions. We are grateful to the Hadron Spectrum Collaboration for the use of their zero temperature ensemble. This work is undertaken as part of the UKQCD collaboration and the STFC funded DiRAC Facility. We acknowledge the PRACE Grants 2011040469 and Pra05 1129, the Initial Training Network STRONGnet, Science Foundation Ireland grants 11-RFP.1-PHY3193 and 11-RFP.1-PHY-3201, the Trinity Centre for High-Performance Computing, the Irish Centre for High-End Computing, STFC, the Wolfson Foundation, the Royal Society and the Leverhulme Trust for support. SK is supported by the National Research Foundation of Korea, grant No. 2010-002219.
A Free lattice spectral functions
The free lattice spectral functions are calculated by summing over the first Brillouin zone [14] according to
a2sρS(ω) = 4πNc ξN3
s
X
n∈1BZ
δ(aτω−2aτE(n)), (A.1)
a4sρP(ω) = 4πNc
ξN3 s
X
n∈1BZ ˆ
JHEP07(2014)097
0 5 10 15 20 25 30 35 40 450 1 2 3 4 5 6 7
ρ ( ω ) (G eV 2 )
ω−2mb (GeV)
0 1 2 3 4 5 6 7 8 0 200 400 600 800 1000 1200 1400 1600 ρ ( ω ) (G eV 4 )
S wave P wave
[image:16.595.96.503.82.302.2]First gen. Second gen. First gen. cont. Second gen. cont.
Figure 11. Free lattice spectral functions in a large volume for the second generation parameters (in blue) and the first generation parameters (in red) for both the S wave (left panel) and P wave (right panel).
The lattice dispersion relation corresponding to the improved NRQCD action is given by
aτE(n) =−2 log
1− 1
2 ˆ p2 2ξasmb
−log
1− pˆ 4
24asmbξ +
1 +asmb 2ξ
(ˆp2)2 8ξ(asmb)3
(A.3)
with the lattice momenta defined by
ˆ p2 = 4
3 X i=3 sin2 πni Ns
, pˆ4 = 16 3 X i=3 sin4 πni Ns
, ni =− Ns
2 + 1, . . . , Ns
2 . (A.4)
A comparison between the free lattice spectral functions for the first and second genera-tion parameters (see table2) is shown in figure11for the S wave (left) and P wave (right) channels. The effect of the finer spatial lattice spacing is apparent as the cusp artefacts — which correspond to momenta reaching the corners of the Brillouin zone — are pushed to higher frequencies, and the support of the free lattice spectral function is correspondingly enlarged. Note that at high temperatures the support of the reconstructed spectral func-tions (figures 7 and 8) is comparable with that of the free lattice spectral function. The difference between the dotted lines representing the free spectral functions in the continuum is due to the slightly different choice of heavy quark mass between the two ensembles.
JHEP07(2014)097
References[1] N. Brambilla et al.,Heavy quarkonium: Progress, puzzles and opportunities, Eur. Phys. J.C 71(2011) 1534[arXiv:1010.5827] [INSPIRE].
[2] T. Matsui and H. Satz,J/ψ suppression by quark-gluon plasma formation,Phys. Lett.B 178 (1986) 416[INSPIRE].
[3] F. Karsch, M.T. Mehr and H. Satz,Color screening and deconfinement for bound states of heavy quarks,Z. Phys.C 37 (1988) 617[INSPIRE].
[4] F. Karsch, D. Kharzeev and H. Satz,Sequential charmonium dissociation,Phys. Lett.B 637 (2006) 75[hep-ph/0512239] [INSPIRE].
[5] R. Rapp, D. Blaschke and P. Crochet,Charmonium and bottomonium production in heavy-ion collisions,Prog. Part. Nucl. Phys.65(2010) 209[arXiv:0807.2470] [INSPIRE]. [6] CMScollaboration, Observation of sequential Upsilon suppression in PbPb collisions,Phys.
Rev. Lett.109(2012) 222301 [arXiv:1208.2826] [INSPIRE].
[7] M. Laine, O. Philipsen, P. Romatschke and M. Tassler,Real-time static potential in hot QCD,JHEP 03(2007) 054[hep-ph/0611300] [INSPIRE].
[8] M. Laine,A Resummed perturbative estimate for the quarkonium spectral function in hot QCD,JHEP 05(2007) 028[arXiv:0704.1720] [INSPIRE].
[9] Y. Burnier, M. Laine and M. Veps¨al¨ainen,Heavy quarkonium in any channel in resummed hot QCD,JHEP 01(2008) 043[arXiv:0711.1743] [INSPIRE].
[10] A. Beraudo, J.-P. Blaizot and C. Ratti,Real and imaginary-time Q Q¯ correlators in a thermal medium,Nucl. Phys. A 806(2008) 312[arXiv:0712.4394] [INSPIRE].
[11] N. Brambilla, M.A. Escobedo, J. Ghiglieri, J. Soto and A. Vairo,Heavy quarkonium in a weakly-coupled quark-gluon plasma below the melting temperature,JHEP 09 (2010) 038
[arXiv:1007.4156] [INSPIRE].
[12] N. Brambilla, M.A. Escobedo, J. Ghiglieri and A. Vairo,Thermal width and gluo-dissociation of quarkonium in pNRQCD,JHEP 12(2011) 116[arXiv:1109.5826] [INSPIRE].
[13] G. Aarts et al.,Bottomonium above deconfinement in lattice nonrelativistic QCD,Phys. Rev. Lett.106(2011) 061602 [arXiv:1010.3725] [INSPIRE].
[14] G. Aarts et al.,What happens to the Υandηb in the quark-gluon plasma? Bottomonium spectral functions from lattice QCD,JHEP 11(2011) 103[arXiv:1109.4496] [INSPIRE]. [15] G. Aarts et al.,S wave bottomonium states moving in a quark-gluon plasma from lattice
NRQCD,JHEP 03(2013) 084[arXiv:1210.2903] [INSPIRE].
[16] G. Aarts et al.,Melting of P wave bottomonium states in the quark-gluon plasma from lattice NRQCD,JHEP 12(2013) 064[arXiv:1310.5467] [INSPIRE].
[17] A. Amato et al.,Electrical conductivity of the quark-gluon plasma across the deconfinement transition, Phys. Rev. Lett.111(2013) 172001 [arXiv:1307.6763] [INSPIRE].
[18] A. M´ocsy and P. Petreczky,Color screening melts quarkonium,Phys. Rev. Lett.99(2007) 211602[arXiv:0706.2183] [INSPIRE].
JHEP07(2014)097
[20] P. Petreczky, C. Miao and A. M´ocsy ,Quarkonium spectral functions with complex potential, Nucl. Phys.A 855 (2011) 125[arXiv:1012.4433] [INSPIRE].
[21] A. Rothkopf,A first look at Bottomonium melting via a stochastic potential,JHEP 04(2014) 085[arXiv:1312.3246] [INSPIRE].
[22] W.M. Alberico, A. Beraudo, A. De Pace and A. Molinari,Quarkonia in the deconfined phase: Effective potentials and lattice correlators,Phys. Rev.D 75(2007) 074009[hep-ph/0612062] [INSPIRE].
[23] C.-Y. Wong,Heavy quarkonia in quark-gluon plasma,Phys. Rev.C 72 (2005) 034906
[hep-ph/0408020] [INSPIRE].
[24] F. Riek and R. Rapp, Quarkonia and heavy-quark relaxation times in the quark-gluon plasma,Phys. Rev.C 82 (2010) 035201[arXiv:1005.0769] [INSPIRE].
[25] M. Asakawa and T. Hatsuda, J/ψ andηc in the deconfined plasma from lattice QCD,Phys.
Rev. Lett.92 (2004) 012001[hep-lat/0308034] [INSPIRE].
[26] S. Datta, F. Karsch, P. Petreczky and I. Wetzorke,Behavior of charmonium systems after deconfinement,Phys. Rev.D 69(2004) 094507 [hep-lat/0312037] [INSPIRE].
[27] A. Jakov´ac, P. Petreczky, K. Petrov and A. Velytsky,Quarkonium correlators and spectral functions at zero and finite temperature,Phys. Rev.D 75(2007) 014506[hep-lat/0611017] [INSPIRE].
[28] G. Aarts, C. Allton, M.B. Oktay, M. Peardon and J.-I. Skullerud,Charmonium at high temperature in two-flavor QCD,Phys. Rev.D 76(2007) 094513 [arXiv:0705.2198] [INSPIRE].
[29] H.T. Ding et al., Charmonium properties in hot quenched lattice QCD, Phys. Rev.D 86 (2012) 014509[arXiv:1204.4945] [INSPIRE].
[30] S. Bors´anyi et al.,Charmonium spectral functions from 2+1 flavour lattice QCD,JHEP 04 (2014) 132[arXiv:1401.5940] [INSPIRE].
[31] R.G. Edwards, B. Jo´o and H.-W. Lin,Tuning for three-flavors of anisotropic clover fermions with stout-link smearing, Phys. Rev.D 78(2008) 054501[arXiv:0803.3960] [INSPIRE].
[32] C. Allton et al.,2+1 flavour thermal studies on an anisotropic lattice,PoS(LATTICE 2013)151[arXiv:1401.2116] [INSPIRE].
[33] Hadron Spectrumcollaboration, H.-W. Lin et al.,First results from 2+1 dynamical quark
flavors on an anisotropic lattice: Light-hadron spectroscopy and setting the strange-quark mass,Phys. Rev.D 79(2009) 034502 [arXiv:0810.3588] [INSPIRE].
[34] R. Morrin, A. ´O Cais, M. Peardon, S.M. Ryan and J.-I. Skullerud,Dynamical QCD simulations on anisotropic lattices, Phys. Rev.D 74(2006) 014505 [hep-lat/0604021] [INSPIRE].
[35] M.B. Oktay and J.-I. Skullerud,Momentum-dependence of charmonium spectral functions from lattice QCD,arXiv:1005.1209[INSPIRE].
[36] G.P. Lepage et al.,Improved nonrelativistic QCD for heavy quark physics,Phys. Rev.D 46 (1992) 4052[hep-lat/9205007] [INSPIRE].
JHEP07(2014)097
[38] HPQCDcollaboration, R.J. Dowdall et al.,The Upsilon spectrum and the determination of
the lattice spacing from lattice QCD including charm quarks in the sea,Phys. Rev.D 85 (2012) 054509[arXiv:1110.6887] [INSPIRE].
[39] G. Moir, M. Peardon, S.M. Ryan, C.E. Thomas and L. Liu,Excited spectroscopy of charmed mesons from lattice QCD, JHEP 05(2013) 021[arXiv:1301.7670] [INSPIRE].
[40] W. Detmold, S. Meinel and Z. Shi, Quarkonium at nonzero isospin density,Phys. Rev.D 87 (2013) 094504[arXiv:1211.3156] [INSPIRE].
[41] R.J. Dowdall, C.T.H. Davies, T. Hammant and R.R. Horgan,Bottomonium hyperfine splittings from lattice NRQCD including radiative and relativistic corrections,
arXiv:1309.5797[INSPIRE].
[42] Particle Data Groupcollaboration, J. Beringer et al.,Review of Particle Physics (RPP), Phys. Rev.D 86(2012) 010001 [INSPIRE].
[43] M. Asakawa, T. Hatsuda and Y. Nakahara,Maximum entropy analysis of the spectral functions in lattice QCD,Prog. Part. Nucl. Phys.46(2001) 459[hep-lat/0011040] [INSPIRE].
[44] K. Hornbostel et al.,Fast fits for lattice QCD correlators,Phys. Rev.D 85(2012) 031504
[arXiv:1111.1363] [INSPIRE].
[45] S. Kim et al., Two topics from lattice NRQCD at non-zero temperature: Heavy quark mass dependence and S-wave bottomonium states moving in a thermal bath,PoS(LATTICE 2012)086[arXiv:1210.7586] [INSPIRE].
[46] S. Kim, P. Petreczky and A. Rothkopf,Lattice NRQCD study of in-medium bottomonium states usingNf = 2 + 1,483×12 HotQCD configurations,arXiv:1310.6461[INSPIRE].
[47] Y. Burnier and A. Rothkopf, Bayesian approach to spectral function reconstruction for Euclidean quantum field theories,Phys. Rev. Lett.111(2013) 182003[arXiv:1307.6106]
![Table 1. Summary of the ensembles used in this work. The crossover temperature is determinedfrom the renormalized Polyakov loop [32]](https://thumb-us.123doks.com/thumbv2/123dok_us/928807.605713/4.595.142.455.84.160/table-summary-ensembles-crossover-temperature-determinedfrom-renormalized-polyakov.webp)


![Figure 9. Stability of the reconstructed spectral function with respect to selection of temporalcorrelator data [τ1/aτ, τ2/aτ] shown in the key for the Υ (top) and χb1 (bottom) channels, for twotemperatures corresponding to Nτ = 28 (left) and Nτ = 20 (righ](https://thumb-us.123doks.com/thumbv2/123dok_us/928807.605713/13.595.114.483.82.340/stability-reconstructed-spectral-selection-temporalcorrelator-channels-twotemperatures-corresponding.webp)

