Modeling spatial processes with unknown
extremal dependence class
Rapha¨
el G. Huser
CEMSE Division, King Abdullah University of Science and Technology
and
Jennifer L. Wadsworth
∗Department of Mathematics and Statistics, Lancaster University
September 5, 2017
Abstract
Many environmental processes exhibit weakening spatial dependence as events be-come more extreme. Well-known limiting models, such as max-stable or generalized Pareto processes, cannot capture this, which can lead to a preference for models that ex-hibit a property known as asymptotic independence. However, weakening dependence does not automatically imply asymptotic independence, and whether the process is truly asymptotically (in)dependent is usually far from clear. The distinction is key as it can have a large impact upon extrapolation, i.e., the estimated probabilities of events more extreme than those observed. In this work, we present a single spatial model that is able to capture both dependence classes in a parsimonious manner, and with a smooth transition between the two cases. The model covers a wide range of possibilities from asymptotic independence through to complete dependence, and per-mits weakening dependence of extremes even under asymptotic dependence. Censored likelihood-based inference for the implied copula is feasible in moderate dimensions due to closed-form margins. The model is applied to oceanographic datasets with ambiguous true limiting dependence structure.
Keywords: asymptotic dependence and independence; censored likelihood inference; copula; threshold exceedance; spatial extremes.
∗J. Wadsworth gratefully acknowledges funding from EPSRC fellowship grant EP/P002838/1. The
1
Introduction
The statistical modeling of spatial extremes has received much attention since the article of
Padoan et al.(2010) provided a method of inference formax-stable processes. The latter form an important class of models for spatial extremes, as they arise as the only non-degenerate
limits of renormalized pointwise maxima of spatial stochastic processes. More precisely, let
Yi(s),i = 1,2, . . ., be independent and identically distributed copies of a stochastic process
{Y(s) : s ∈ S} with index set S ⊂ R2. If there exist functions a
n(s) > 0, bn(s) such that
the limiting process
M(s) = lim
n→∞1max≤i≤n
Yi(s)−bn(s)
an(s)
(1)
has non-degenerate marginals, then M(s) is a max-stable process (de Haan and Ferreira,
2006, Chapter 9). A practical issue with max-stable processes is that their d-dimensional
densities (and hence the likelihood function) are difficult to evaluate, as the number of terms
involved equals the dth Bell number, which grows super-exponentially with d. As such,
spatial models for high threshold exceedances, which have simpler likelihoods, have become
more appealing; see e.g.,Ferreira and de Haan(2014);Wadsworth and Tawn(2014);Engelke
et al.(2015);Thibaud and Opitz(2015) andde Fondeville and Davison(2016). The threshold
exceedance analogue of the max-stable process is known as the generalized Pareto process, and has a similar asymptotic dependence structure in its joint tail region.
In order for limiting max-stable or generalized Pareto processes to provide good
statis-tical models, we require that the extremes of Y(s) are well represented by these processes,
i.e., adequate convergence has occurred. However, there are no guarantees on rates of
con-vergence, and in practice, limit models may not hold well. One way to assess the validity
of convergence is to assess whether the stability properties of limit models hold well:
0.90 0.92 0.94 0.96 0.98 1.00
0.0
0.2
0.4
0.6
u
χu
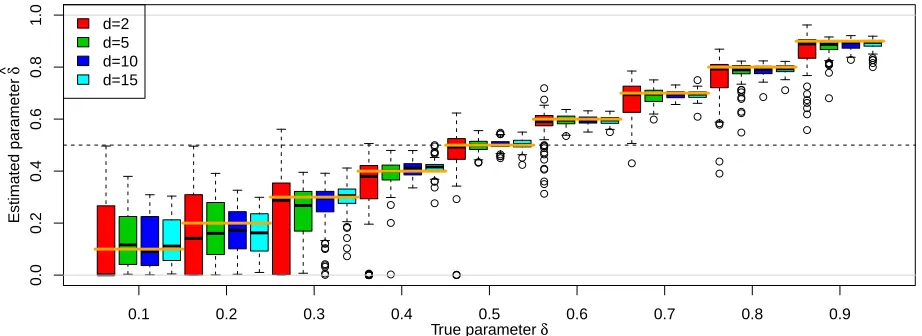
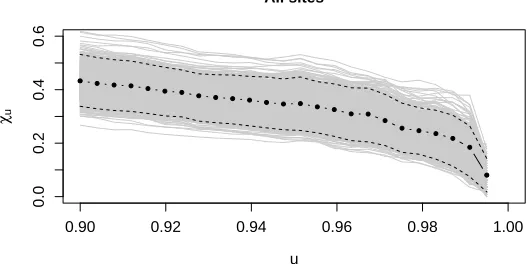
[image:3.612.165.429.91.223.2]All sites
Figure 1: Estimate of the dependence summary χu in (2) (dots) for the significant wave
height data of §4.1 plotted against quantile, u. Gray lines are estimates from a stationary bootstrap resampling procedure (see§4.1); dashed lines indicate the central 95% of bootstrap samples, pointwise.
whilst generalized Pareto copulas are invariant to conditioning on threshold exceedances of
higher levels (threshold-stability). A graphical diagnostic for max-stability is presented in
Gabda et al. (2012), whilst for threshold-stability, one can examine plots of
χu := P{F1(Y1)> u, . . . , Fd(Yd)> u|F1(Y1)> u}, Yj =Y(sj)∼Fj, (2)
where the argument sj denotes the jth spatial location; if the data follow a generalized
Pareto process law, then this function should be constant as the quantile u tends to one
(Rootz´en et al., 2017). For environmental data in particular, it is much more common to
see estimates of (2) decreasing as u → 1, indicating that dependence weakens with level of extremeness. An example of this is given in Figure 1, for a dataset of significant wave
heights, to be analyzed in§4.1.
If the limit of χu defined in (2) as u→1 is positive for all sites s1, . . . ,sd and alld≥2,
the processY(s) is termedasymptotically dependent, and eventually, possibly at much higher levels, a generalized Pareto process should represent a suitable model for the data. If the limit
is zero for all sites s1, . . . ,sd and all d≥2, we term the processasymptotically independent;
are possible, but owing to the structure of spatial data, it is common over small spatial
domains to assume that the process is either asymptotically dependent or asymptotically
independent, and we assume this here also. Determining a suitable model for the data
usually requires distinguishing between these two scenarios, since most models exhibit only
one type of dependence; choosing the incorrect class will lead to unsuitable extrapolation
into the joint upper tail (Ledford and Tawn, 1997; Davison et al., 2013).
In practice, because asymptotic properties are always difficult to infer, it is ideal to fit
spatial models encompassing both asymptotic dependence classes, and let the data speak for
themselves. To our knowledge, the only instance in the literature of such a hybrid spatial
extreme model is the max-mixture model ofWadsworth and Tawn (2012). However, in that
model, asymptotic independence only occurs at a boundary point of the parameter space,
thus inference methods allowing for this are non-regular. Moreover, the model is highly
parametrized and requires pairwise likelihood fitting methods.
In this paper, we address such deficiencies by presenting a class of spatial processes
de-scribed by a small number of parameters and making a smooth transition between the two
dependence paradigms. Specifically, we propose a novel class of spatial extremal models
that have non-trivial asymptotically dependent and asymptotically independent submodels
with the transition taking place in the interior of the parameter space. The latter property
allows us to quantify our uncertainty about the dependence class in a simple manner. Our
new spatial models can thus be viewed as similar in spirit to the generalized extreme-value
(GEV) distribution in the univariate case, which was introduced by von Mises (1954) and
Jenkinson (1955) as a three-parameter model combining the three limiting extreme-value
types (i.e., reversed Weibull, Gumbel and Fr´echet), hence providing a way to make inference
without specifying the asymptotic distribution family prior to fitting the model.
assess the evidence for asymptotic dependence over asymptotic independence, if so desired.
In encompassing both extremal dependence classes, our approach has similarities with
the bivariate model of Wadsworth et al. (2017). However our construction here is simpler
and substantially more amenable to higher-dimensional inference. Other related work that
allows for both asymptotic dependence structures in a spatial setting is the Gaussian scale
mixture models proposed in the recent work of Huser et al. (2017), but their models either
make the transition at a boundary point of the parameter space, or are inflexible in their
representation of asymptotic independence structures.
The paper is organized as follows. Section 2 describes the new spatial model and its
extremal dependence properties. Section 3 details censored likelihood inference, describes
a test for the asymptotic dependence class, and presents a simulation study validating the
methodology. The new model is then applied to two oceanographic datasets in Section 4,
while Section 5 concludes with some discussion. All proofs are deferred to Appendix A.
2
Model
2.1
Copula-based approach
The main goal of this work is to provide flexible extremal dependence structures for spatial
processes. As such, we take a copula-based approach and seek the construction of flexible
families of copulas for spatial extremal dependence. For a process with marginal distribution
functions Xj ∼Fj, the d-dimensional copula function C, is defined as
C(u1, . . . , ud) = P{F1(X1)≤u1, . . . , Fd(Xd)≤ud}.
When the margins Fj, j = 1, . . . , d, are continuous, which will be the case throughout this
paper, the copula is unique (Sklar,1959), and represents a multivariate distribution function
displays interesting extremal dependence properties. Details of likelihood calculations of the
copula of the model we introduce are presented in Section 3.
2.2
Construction
Let{W(s) :s∈ S ⊂R2} be a stationary spatial process with standard Pareto margins, and
displaying asymptotic independence with hidden regular variation; a consequence of this is that for any x≥1,
P{W(sj)> x}=x−1,
P{W(sj)> x, W(sk)> x}=LW(x)x−1/ηW(h), k 6=j, (3)
whereLW : (0,∞)→(0,∞) is slowly varying at infinity, i.e.,LW(ax)/LW(x)→1 asx→ ∞
for any a > 0, and 0 < ηW(h)<1 for h=sj −sk 6=0 (Ledford and Tawn, 1996; Resnick, 2002). Note that we exclude the further possibility ηW(h) = 1 (h 6= 0), LW(x) → 0 as
x → ∞, because this does not arise in models that we might naturally consider for W(s). The parameter ηW(h), called the coefficient of tail dependence, summarizes the joint tail
decay of the process W(s) and it is a function of the lag vector h. For simplicity, in what
follows we will restrict ourselves to isotropic processes, and will therefore writeηW(h) (or, for
notational convenience, ηW, when no confusion can arise), where h =khk =ksj −skk ≥ 0
denotes the Euclidean distance between sites sj,sk ∈ S. Examples of models satisfying (3)
include marginally transformed Gaussian processes and inverted max-stable processes; see
§2.5 for more details.
WithW(s) as described, letRbe an independent standard Pareto random variable. Our
spatial dependence model is defined through the random field constructed as
X(s) = RδW(s)1−δ, δ∈[0,1]. (4)
The following simple observation highlights why the parsimonious model defined in (4) is
asymptotic dependence; when δ < 1/2 the converse is true, and this induces asymptotic
independence. These facts are formalized in §2.3.
Construction (4) has superficial similarities with the Gaussian scale mixture models
stud-ied by Huser et al. (2017), who multiply a Gaussian random field by a random effect that
determines the extremal dependence properties. However, in (4) the latent process W(s)
does not have Gaussian margins, resulting in a very different construction in practice, and
need not have a Gaussian copula structure, which yields a much wider class of models. In
practice, high-dimensional inference requires tractable densities for W(s) (see §3.1), leading to the Gaussian copula as a natural choice in spatial settings. Alternative possibilities for
W(s) are discussed further in §2.5.
Remark 1. Representation (4) is convenient to study the asymptotic dependence properties
of the process X(s) using the theory of regular variation; see §2.3. However, as the copula structure is invariant with respect to monotone marginal transformations, there is an infinite number of ways to characterize the copula stemming from X(s), some of which may be computationally more attractive or have appealing interpretations. For example, taking the logarithm on both sides of (4), we obtain an additive structure
˜
X(s) :=δR˜+ (1−δ) ˜W(s), (5)
where R˜ := log(R) ∼ Exp(1) is independent of W˜(s) := log{W(s)}, also with Exp(1)
margins. In Sections3and4, copula and likelihood computations are based on expression (5).
The variable R in (4) or equivalently the variable ˜R in (5), may be interpreted in various
ways, shedding light on the extremal behavior ofX(s). For example, by writing ˜R :={R˜(s) : s∈ S ⊂R2}, it can be seen as a random process indexed by S with perfect dependence, so
the representation in (5) implies that ˜X(s) can be interpreted as a mixture between perfect
constructed hybrid bivariate models using a certain type of mixture between asymptotic
dependence and complete independence.
Alternatively, R or ˜R may be interpreted as an unobserved latent random factor
im-pacting simultaneously the whole regionS, hence affecting the joint tail characteristics, and making a link with the common factor copula models for spatial data introduced byKrupskii
et al.(2017). One major difference with our approach, however, is that here ˜Rand ˜W(s) are
both on the unit exponential scale, whereas the location mixture copula models of Krupskii
et al. (2017) assume that ˜W(s) is a Gaussian process and that both components in (5) are
weighted equally, corresponding to δ = 1/2. Consequently, their exponential factor model
always displays asymptotic dependence. Other distributions for the random factor were
in-vestigated in Krupskii et al. (2017), but they all yield copulas with (non-trivial) asymptotic
dependence lying on the boundary of, or at a single point in, the parameter space.
We next study the dependence properties of model (4) for δ ∈ (0,1) noting the simple interpretations at the endpoints of the parameter space: it is clear from (4) or (5) that
perfect dependence arises as δ →1, whilst the copula of W(s) is recovered as δ→0.
2.3
Dependence properties
Owing to the simple construction of this process, it is sufficient to study bivariate dependence
to make more general conclusions. Comments on higher-dimensional dependence will be
made throughout the remainder of the section.
To examine the dependence properties of the process (4), we relate the behavior of the
bivariate joint survivor function on the diagonal, P(Xj > x, Xk > x), to the marginal survivor
function, P(Xj > x), where for simplicity we write Xj =X(sj) and so forth. We focus on a
bivariate version of the dependence measure (2),
and its limit χ(h) := limu→1χu(h), with h = ksj −skk. A value of χ(h) > 0 indicates
asymptotic dependence for this pair of sites, whilst χ(h) = 0 defines asymptotic
indepen-dence. Because the process X(s) has common margins with upper endpoint at infinity, the
limit may be equivalently expressed as
χ(h) = lim
x→∞P(Xj > x, Xk > x)/P(Xj > x). (7)
When χ(h) = 0, alternative measures are needed to discriminate between the different levels
of dependence exhibited by asymptotically independent distributions. A widely satisfied
assumption, already made for the process W(s) in (3) (modulo the restriction made on the
coefficient of tail dependence), is
P(Xj > x, Xk > x) = LX{P(Xj > x)−1}P(Xj > x)1/ηX(h), (8)
whereLX is slowly varying at infinity, andηX(h)∈(0,1] is the coefficient of tail dependence
for the process X(s). When ηX(h) = 1 and LX(x) → χ(h) > 0 as x → ∞, the pair of
variables (Xj, Xk)T are asymptotically dependent, else they are asymptotically independent
and the value of ηX(h) summarizes the strength of extremal dependence in the joint upper
tail. For notational convenience, the dependence on distance h in χ(h) and ηX(h) may be
omitted when no confusion can arise.
2.3.1 Marginal distribution
The marginal distribution of the process (4) may be established forδ 6= 1/2 as follows:
1−FX(x) = P(Xj > x) = P{Wj > x1/(1−δ)R−δ/(1−δ)}
= P(R > x1/δ) +x−1/(1−δ)
Z x1/δ
1
rδ/(1−δ)−2dr
= δ
2δ−1x
−1/δ− 1−δ
2δ−1x
−1/(1−δ), x≥1, δ6= 1/2. (9)
The case δ = 1/2 may either be established independently, or as a limit, from which we get
this is the survival function of a log-Gamma random variable with rate and shape parameters
both equal to two. Notice that margins are here available in closed form, unlike the Gaussian
scale mixture model ofHuser et al.(2017), or the bivariate model ofWadsworth et al.(2017).
Since the copula is the object of interest in all of the above cases, this makes model (4)
computationally more appealing.
2.3.2 Joint distribution
We now derive the joint survivor function of a pair of variables (Xj, Xk)T from the process
X(s) in (4), and then use this result in (7) and (8), combined with (9), to derive the
corresponding coefficients χ and ηX characterizing tail dependence of X(s) depending on
the value of δ.
Proposition 1. With definitions and notation as established above, the joint survivor
func-tion of (4) satisfies
P(Xj > x, Xk > x) =
(
L(x)x−1/{(1−δ)ηW}, if η
W ≥δ/(1−δ),
E{min(Wj, Wk)(1−δ)/δ}x−1/δ{1 +o(1)} if ηW < δ/(1−δ),
where L is slowly varying at infinity.
Corollary 1. If δ > 1/2, the pair (Xj, Xk)T is asymptotically dependent with
χ= Emin(Wj, Wk)(1−δ)/δ
2δ−1
δ = E min
"
Wj(1−δ)/δ
E{Wj(1−δ)/δ},
Wk(1−δ)/δ
E{Wk(1−δ)/δ}
#!
>0. (10)
If δ ≤ 1/2, the pair (Xj, Xk)T is asymptotically independent, i.e., χ = 0. Furthermore, the coefficient of tail dependence for the process (4) is
ηX =
1, if δ ≥1/2,
δ/(1−δ), if ηW/(1 +ηW)< δ <1/2,
ηW, if δ ≤ηW/(1 +ηW).
(11)
Remark 2. Analogous dependence summaries ind dimensions are simple to establish using
andη1:d
W denoted-dimensional counterparts of the coefficient of tail dependence, defined using the d-dimensional joint survivor function, then expression (11) still holds with ηX and ηW replaced by ηX1:d and ηW1:d. The d-dimensional analogue of χ generalizes expression (10), and is discussed in Remark 3.
The caseδ = 1/2 is of particular interest, since it represents a boundary between
asymp-totic dependence and asympasymp-totic independence: according to Corollary1we have asymptotic
independence (χ = 0), but the coefficient of tail dependence ηX attains its boundary value
of 1. In this case, we therefore have LX(x) → 0 asx → ∞ in (8). Furthermore, the model
has the appealing property that χ&0 as δ &1/2 and ηX &ηW as δ &ηW/(1 +ηW). As
noted at the end of §2.2, as δ &0, the dependence structure of the W process is recovered. Our model X(s) in (4) hence provides a smooth interpolation from the asymptotically
in-dependent submodel W(s) and perfect dependence, as the parameter δ varies in the unit
interval, and it transits through non-trivial asymptotically independent and asymptotically
dependent submodels.
2.4
Further dependence properties under asymptotic dependence
Here, we outline the connection to other well-known measures of dependence in the case
of asymptotic dependence. We focus firstly on a limiting measure, namely the so-called
exponent function, V : (0,∞)d→(0,∞) defined for all x
1, . . . , xd>0 by
V(x1, . . . , xd) = lim
t→∞t 1−P
X1 ≤FX−1
1−(tx1)−1 , . . . , Xd≤FX−1
1−(txd)−1 ,
which describes the joint dependence of the associated max-stable or generalized Pareto
pro-cess; see Davison et al. (2012), Cooley et al. (2012), Segers (2012) or Davison and Huser
(2015) for recent reviews on max-stable models. We then examine the sub-asymptotic be-havior under asymptotic dependence, i.e., the mode of convergence towards such limiting
Proposition 2. For X(s) as given in model (4) and δ >1/2,
V(x1, . . . , xd) = E
"
max
j=1,...,d
Wj(1−δ)/δ
E{Wj(1−δ)/δ}xj
#
= 2δ−1
δ E
(
max
j=1,...,d
Wj(1−δ)/δ xj
)
.
Remark 3. It follows from Proposition 2that thed-dimensional extremal coefficient, θ1:d=
V(1, . . . ,1), is
θ1:d= E
"
max
j=1,...,d
Wj(1−δ)/δ
E{Wj(1−δ)/δ}
#
= 2δ−1
δ E
max
j=1,...,dW (1−δ)/δ j
∈[1, d]. (12)
Furthermore the d-dimensional version ofχ, χ1:d, in (6) equals
lim
u→1P{FX(X1)> u, . . . , FX(Xd)> u|FX(X1)> u}=
2δ−1
δ E
min
j=1,...,dW (1−δ)/δ j
,
which can be demonstrated directly or by using inclusion-exclusion relationships between these parameters, such as outlined in Rootz´en et al. (2017).
The behavior of χu−χ= P{FX(Xj)> u |FX(Xk)> u} −χ as u→ 1, i.e., the rate at
which χu converges to its limit χ, determines the flexibility of a process for capturing
sub-asymptotic extremal dependence. Proposition 3 demonstrates that the parameterization of
model (4) gives flexibility in this rate, meaning that dependence can weaken above the level
used for fitting, whilst still allowing for the possibility of asymptotic dependence.
Proposition 3. For δ >1/2,
χu−χ=χ
1−δ δ
δ
2δ−1
(1−2δ)/(1−δ)
(1−u)(2δ−1)/(1−δ){1 +o(1)}, u→1. (13)
For comparison, generalized Pareto processes have χu ≡χ for all u above a certain level
(Rootz´en et al., 2017), whilst all max-stable processes have χu −χ (1−u), as u → 1.
However, asχis a dependence measure on the scale of the observations rather than maxima,
it is less useful in the context of max-stable processes, where the summary (12) is typically
0.90 0.92 0.94 0.96 0.98 1.00
0.0
0.2
0.4
0.6
0.8
1.0
χu
Threshold u
Coefficient
χu
0.9 ●
0.8 ●
0.7 ●
0.6
● 0.55
● 0.52
● 0.5
● 0.48
0.45 0.4
0.3 0.2 0.1
●
δ
0.0 0.2 0.4 0.6 0.8 1.0
0.0
0.2
0.4
0.6
0.8
1.0
ηX
δ
Coefficient of tail dependence
ηX
ηW=0.9
ηW=0.8
ηW=0.7
ηW=0.6
ηW=0.5
ηW=0.4
ηW=0.3
ηW=0.2
[image:13.612.79.533.79.321.2]ηW=0.1
Figure 2: Left: Coefficient χu in (6) for model (4) plotted as a function of the threshold
u ∈ [0.9,1] for δ = 0.1,0.2,0.3,0.4,0.45,0.48,0.5,0.52,0.55,0.6,0.7,0.8,0.9 (top to bottom) and (Wj, Wk)T with a Gaussian copula with correlation 0.4. Black dots at u = 1 denote
the limit quantities χ= limu→1χu, and the green dashed curve (superimposed with δ= 0.1)
corresponds to the vector (Wj, Wk)T, i.e., the case δ = 0. Right: Coefficient of tail
depen-dence ηX in (11) (solid colored curves) as a function ofδ ∈(0,1) for ηW = 0.1, . . . ,0.9 (thin
to thick). The valueηW = 0.7 corresponds to the choice of (Wj, Wk)T on the left panel.
rapid for δ near 1, to rates slower than (1−u) for 1/2 < δ < 2/3. Note that for δ < 1/2, the rate χu−χ is determined by the coefficient of tail dependence, ηX; recall (8) and (11).
Figure2illustrates the flexibility in extremal dependence structures, by plottingχuin (6)
as a function of the thresholdu and the limit quantity χ= limu→1χu in (10), for a range of
values of δ ∈ (0,1), and (Wj, Wk)T following a Gaussian copula with correlation parameter
0.4. Figure 2also displays the coefficient of tail dependence ηX defined in (8) and (11) as a
function of δ for ηW = 0.1, . . . ,0.9. The smooth transition from asymptotic dependence to
asymptotic independence taking place at δ = 1/2 can be clearly seen from these two plots.
Moreover, as is intuitive, the right panel of Figure 2 shows that the process X(s) in (4)
2.5
Example models
We conclude this section with some concrete suggestions for the W process that may be
useful in certain applications, such as those described in Section 4.
Example 1 (Gaussian process). Let{Z(s) :s∈ S} be a stationary Gaussian process with
correlation function ρ(h), and standard Gaussian marginal distribution, denoted Φ. Then
W(s) = 1/[1−Φ{Z(s)}]
has a Gaussian copula, Pareto margins, and coefficient of tail dependence ηW(h) = {1 +
ρ(h)}/2. In this case, the value ofχ(h) in (10) needs to be calculated either by Monte Carlo or numerical integration, both of which are simple and quick.
Example 2 (Inverted max-stable process). Let{M(s) :s∈ S}be a stationary max-stable
process with extremal coefficient function θ(h)∈(1,2], and marginal distribution functions
Gs, s∈ S. Then the process
W(s) = 1/Gs{M(s)}
has an inverted max-stable copula (Ledford and Tawn, 1996; Wadsworth and Tawn, 2012),
Pareto margins, and coefficient of tail dependenceηW(h) = 1/θ(h). The value ofχ(h) in (10)
can be calculated as
χ(h) = 2δ−1
δ E{min(Wj, Wk)
(1−δ)/δ}
= 2δ−1
1−(1−δ){1 +ηW(h)}
, δ >1/2. (14)
For this class of processes ηW(h) ∈[1/2,1) for h >0, thus the range of χ(h) values can be
established for each δ. Moreover, thed-dimensional quantityχ1:d takes the same form as in
equation (14) with ηW(h) replaced by η1:dW ∈[1/d,1).
In what follows, we will principally take W(s) to have a Gaussian copula because the
process, which suffers the same explosion in the number of terms as a max-stable process
density. Pairwise or higher-dimensional composite likelihoods (see, e.g., Padoan et al.,2010;
Varin et al., 2011; Castruccio et al., 2016) offer an alternative approach, but we do not
explore this further here. Outside of a spatial context however, other dependence structures
may be preferred.
Example 3 (Non-spatial model). We remark that non-spatial use of the model (4) is also
possible, replacing the process W(s) with an asymptotically independent random vector
W = (W1, . . . , Wd)T with pairwise coefficients of tail dependenceηWjk <1,j < k ∈ {1, . . . , d}.
For multivariate models in dimension d greater than two some care is required, however, as
model (4) allows only ford-wise asymptotic dependence (i.e.,χ1:d >0), ord-wise asymptotic
independence (i.e., χjk = 0, for all j < k ∈ {1, . . . , d}). Such assumptions are natural
in the context of spatial processes, but often less so for genuinely multivariate data. For
dimension d= 2 however, where χ1:2 >0 is the complement ofχ1:2 = 0, model (4) offers an
interesting alternative to that ofWadsworth et al.(2017) for bivariate data. The latter show
that the copula model defined byX =RW, where the radial variable Rfollows a unit scale
generalized Pareto distribution with shape parameter ξ ∈R and max(W) = 1, with R and W independent, displays asymptotic dependence for ξ > 0 and asymptotic independence
for ξ ≤ 0. One advantage of model (4) is that a version with an asymmetric dependence structure is simpler to implement, by selecting an asymmetric bivariate distribution for the
copula of W. We illustrate the improvement this can offer in §4.2.
3
Inference and Simulation
3.1
Censored likelihood
We wish to fit the dependence structure of model (4) to the extremes of spatial processes.
cap-turing extremal dependence, we use a censored likelihood, which prevents low values from
affecting the estimation of the extremal dependence structure. Such an approach is now
stan-dard in inference for multivariate and spatial extremes, although different censoring schemes
have been adopted; see e.g. Smith et al. (1997), Wadsworth and Tawn (2012) and Huser
et al.(2016, 2017). We assume that we are working with aW process that has a density, so
that this is also true for the copula.
Assume that n independent replicates of a random process {Y(s) : s ∈ S ⊂ R2} are
observed at d spatial locations,s1, . . . ,sd ∈ S. Denote the ith replicate at the jth location
by Yij, i = 1, . . . , n, j = 1, . . . , d. We assume that in its joint tail region, i.e., for
observa-tions above a high marginal threshold, the process Y(s) has the same copula as our model
X(s) defined in (4), but with possibly different marginal distributions Fs. To estimate the
dependence structure, we first transform the margins to uniform independently at each site
sj, j = 1, . . . , d. In Section 4, we use the semi-parametric procedure of Coles and Tawn
(1991), whereby the distribution function is estimated using the asymptotically-motivated
generalized Pareto distribution above a high marginal threshold, and the empirical
distribu-tion funcdistribu-tion below that threshold. The resulting variables are denoted Uij = ˆFsj(Yij). An
alternative is to use the empirical distribution function throughout as inHuser et al.(2017).
This two-step approach is common practice in the copula literature and provides consistent
inference for the copula under mild regularity conditions (see, e.g., Joe, 2015).
The second step is to estimate the copula parameters using the transformed data based on
a censored likelihood. When fitting the copula stemming from model (4), the parameters to
be estimated are ψ= (δ,ψT
W)T ∈Ψ = [0,1]×ΨW ⊂Rp, where ψW is a (p−1)-dimensional
˜
X(s) = δR˜+ (1−δ) ˜W(s) in (5), the resulting copula C and its density care
C(u1, . . . , ud;ψ) =FX1:d˜ {FX−˜1(u1), . . . , FX−˜1(ud)}, (15)
c(u1, . . . , ud;ψ) =fX1:d˜ {F
−1 ˜
X (u1), . . . , F
−1 ˜ X (ud)}
d
Y
j=1
h
fX˜{FX−˜1(uj)}
i−1
, (16)
where FX˜(x) = FX(ex) and fX˜(x) = fX(ex)ex with fX(x) = dFX(x)/dx, easily obtained in
closed form through (9). The functionsFX˜ andfX˜ are the marginal distribution and density,
respectively, stemming from the ˜X(s) process observed at the sites s1, . . . ,sd, whilst
FX1:d˜ (x1, . . . , xd) =
Z rδ?
0
FW˜
(1−δ)−1(x1−δr), . . . ,(1−δ)−1(xd−δr) e−rdr,
fX1:d˜ (x1, . . . , xd) = (1−δ)−d
Z rδ?
0
fW˜ (1−δ)−1(x1−δr), . . . ,(1−δ)−1(xd−δr) e−rdr
represent the joint distribution function and density, respectively, of this process. Here,
r?
δ = min(x1, . . . , xd)/δ, and FW˜, fW˜ denote the joint distribution and density, respectively,
for the ˜W(s) process. The partial derivatives of the copula C(u1, . . . , ud;ψ) with respect to
any set of variables J ⊂ {1, . . . , d} of cardinality dJ may be expressed as
CJ(u1, . . . , ud;ψ) =
∂dJ
Q
j∈J ∂uj
C(u1, . . . , ud;ψ)
=FX,1:d˜J{F−1 ˜
X (u1), . . . , F
−1 ˜ X (ud)}
Y
j∈J
h
fX˜{FX−˜1(uj)}
i−1
, (17)
where
FX,1:d˜J(x1, . . . , xd) = (1−δ)−dJ
Z rδ?
0
FW ,˜ J
(1−δ)−1(x1−δr), . . . ,(1−δ)−1(xd−δr) e−rdr,
with FW ,˜ J(x1, . . . , xd) = ∂dJFW˜(x1, . . . , xd)/Qj∈J ∂xj. When the processW(s) is based on
a Gaussian copula, partial derivatives in (17) involve the multivariate Gaussian distribution
in dimensiond−dJ. Although the unidimensional integrals appearing in (15), (16) and (17) cannot be expressed in closed form, they can nevertheless be accurately approximated using
ψ = (δ,ψT
W)T ∈ Ψ, while avoiding influence of non-extreme data below high marginal
thresholds u?1, . . . , u?d, we maximize the censored log likelihood function defined as
`(ψ) =
n
X
i=1
log{Li(ψ)}, (18)
with contributions defined through the sets of indices Ji ={j :Uij > u?j} ⊆ {1, . . . , d} as
Li(ψ) =
C(u?
1, . . . , u?d;ψ), Ji =∅,
c(Ui1, . . . , Uid;ψ), Ji ={1, . . . , d},
CJi{max(Ui1, u
?
1), . . . ,max(Uid, u?d);ψ}, otherwise.
The set Ji determines whether the ith observation vector (Ui1, . . . , Uid)T has threshold
exceedances in no, all, or some but not all components, respectively; therefore, these sets
may be different for each likelihood contribution i = 1, . . . , n. The estimator maximizing
(18) over Ψ is denoted by ˆψ. The performance of this inference approach is assessed in our
simulation study §3.2 and it is used in the application in§4.1.
Another possible censoring scheme is to use either the fully censored contribution
C(u?
1, . . . , u?d;ψ) in (18) if Ji = ∅ (i.e., the variable Uij is lower than the threshold u?j
for all j = 1, . . . , d), or the completely uncensored contributionc(Ui1, . . . , Uid;ψ) otherwise.
This was used by Wadsworth and Tawn(2012), Opitz (2016) and Wadsworth et al.(2017),
and is adopted in the example of §4.2, where we compare fits of bivariate models.
3.2
Simulation study
3.2.1 Parameter estimation
To assess the performance of the maximum censored likelihood estimator ˆψ defined through
(18), we simulated data from the copula defined by (4) at d= 2,5,10,15 locations uniformly
generated in the unit square, [0,1]2. We sampled n = 1000 independent replicates at these
locations, and considered the scenarios δ = 0.1, . . . ,0.9 (from asymptotic independence to
dependence) with W(s) defined by a Gaussian copula structure with powered exponential
● ● ● ● ● ● ● ● ●
● ● ● ● ●
● ● ● ● ● ● ● ● ● ● ● ● ●
● ●
● ●
●
● ● ● ● ●
● ● ● ●
● ● ●
● ● ●
●
● ● ●
● ●
● ●
● ● ● ● ● ●
● ● ●
● ● ●
●
● ●
●
●
● ●
●
● ● ● ●
●
● ● ● ● ● ● ●
● ●
● ●
● ● ● ●
● ●
● ● ● ● ● ● ● ●●●●●
0.0
0.2
0.4
0.6
0.8
1.0
True parameter δ
Estimated par
ameter
δ
^
0.1 0.2 0.3 0.4 0.5 0.6 0.7 0.8 0.9
[image:19.612.73.534.80.248.2]d=2 d=5 d=10 d=15
Figure 3: Boxplots for the MLE ˆδ based on (18) setting the thresholds as u?
j = 0.95, j =
1, . . . , d, for model (4) withδ= 0.1, . . . ,0.9 (left to right). The underlying processW(s) has a Gaussian copula with correlation function ρ(sj,sk) = exp{−(ksj −skk/λ)ν} and λ= 0.5,
ν = 1. The process was observed at d = 2 (red, left), 5 (green, second left), 10 (dark blue, second right) and 15 (light blue, right) random locations in [0,1]2, and n = 1000
replicates were simulated. True values are indicated by the orange horizontal segments, and the boundary between asymptotic dependence and independence is indicated by the horizontal dashed line at δ= 0.5. Boxplots are based on 100 independent simulations.
and ν = 1, we then estimated ψ = (δ, λ, ν)T by maximizing (18) with marginal thresholds
u?
1 = · · · = u?d = 0.95, giving about 50 exceedances at each location. For identifiability
reasons, we fixedν = 1 whend= 2. Because the process is almost perfectly dependent when
δ approaches unity, this creates numerical difficulties: to deal with this issue, we increase
the relative precision in the Rfunctionintegrate used for the calculation of the integrals in
(15), (16) and (17) for larger values of δ. Figure 3 shows boxplots of estimated parameters
ˆ
δ based on 100 independent simulations.
Overall, the estimation procedure works as expected, with boxplots for δ approximately
centered around the true value, though a small bias appears for δ = 0.8,0.9, which is due
to numerical instabilities and difficulties in identifying all three parameters in such strong
dependence scenarios, despite the higher numerical precision; recall Figure 2. As is typical
close to 0 and 1, but the distribution displays some asymmetry near to the endpoints 0 and
1. Estimation seems to be easier when δ ≈ 1/2, which leads to small bias and variability. As δ→0, the copula structure of X(s) converges to that of the latent process W(s), here a Gaussian copula, and therefore low values such as δ= 0.1,0.2 yield very similar dependence
structures, leading to higher variability. Boxplots of ˆλ and ˆν (see Supplementary Material)
suggest that results are better in the asymptotic independence case whenδ ≤0.5. For larger values of δ, the range λ is more variable and the smoothness parameter ν is slightly more
biased, owing to the very strong dependence. However, in practice, one could restrict the
parameter δ to 0 ≤ δ ≤ 0.8, say, as δ > 0.8 is very unlikely to occur in applications. For all parameters δ, λ and ν, but particularly for ν, the fit improves significantly when more
locations are available.
3.2.2 Testing the dependence class
A major advantage of model (4) over currently available models for spatial extremes is that
we do not need to explicitly determine whether the data exhibit asymptotic dependence or
asymptotic independence in order to select an appropriate class of models. However, since so
much effort has previously been placed on determining the appropriate dependence class, we
present the details and simulation experiments of a model-based test for this here. Coles et al.
(1999) suggest using nonparametric estimators of the measureχu (defined slightly differently
to (6)) and its counterpart ¯χu, but when the threshold u increases to unity, the associated
uncertainty inflates dramatically. This renders any test based on these nonparametric
estima-tors almost useless in practice. To increase the power for discriminating between asymptotic
dependence and independence, a parametric model-based approach seems sensible and our
copula model (4) provides a very natural way to proceed, because the transition between
the two asymptotic paradigms takes place in the interior of the parameter space. We stress,
best used in conjunction with other diagnostics. Standard likelihood theory can be invoked
to design tests for the null hypotheses
H0AD :δ >1/2 (asympt. dependence) vs HAAI :δ ≤1/2 (asympt. independence);
H0AI :δ≤1/2 (asympt. independence) vs HAAD :δ >1/2 (asympt. dependence).
Let ˆψ= (ˆδ,ˆλ,νˆ)T be the maximum likelihood estimator (MLE). We suggest using asymptotic
normality of ˆψto test forHAD
0 orH0AI, an assumption that should hold true ifn is large and
δ is not too close to its boundaries 0 and 1. In particular, denoting the estimated variance
of ˆδ by ˆvδ, the power of these tests at the level 100×(1−α)% can be computed as
P(reject HAD
0 |HAAI holds) = P(ˆδ <0.5−
p
ˆ
vδz1−α |δ≤0.5), (19)
P(reject HAI
0 |HAAD holds) = P(ˆδ >0.5 +
p
ˆ
vδz1−α |δ >0.5), (20)
respectively, where z1−α is the (1−α)-quantile of the standard normal distribution.
To compute the power curves (19) and (20), we drew 300 simulations of model (4) at
d = 2,5,10 locations in [0,1]2 with n = 1000,2000 independent replicates, under the same
setting as §3.2.1. Range λ = 0.5 and smoothness ν = 1 were fixed, and we considered a sequence δ ∈ [0.3,0.8] in steps of 0.02, estimating all parameters using the MLE based on (18) with marginal thresholds u?
1 = · · · = u?d = 0.95. The Hessian matrix at the MLE was
used in order to compute ˆvδ as the (1,1)-entry of the reciprocal Fisher information.
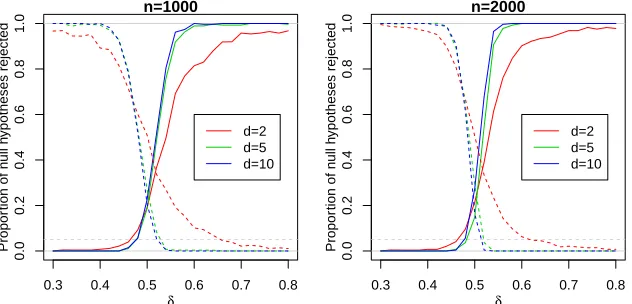
Figure 4 displays the proportion of null hypotheses rejected (i.e., the power curves (19)
and (20) when the corresponding null hypotheses are false), estimated using the 300
simu-lations and plotted as a function ofδ ∈[0.3,0.8]. As expected, for all dimensions, the power to reject asymptotic dependence (respectively asymptotic independence) improves as δ→0 (respectivelyδ →1), and with higher dimensions, although there is little difference between
d = 5 and d = 10. Comparing left and right panels, increased sample size also improves
0.3 0.4 0.5 0.6 0.7 0.8
0.0
0.2
0.4
0.6
0.8
1.0
n=1000
δ
Propor
tion of n
ull h
ypotheses rejected d=2 d=5 d=10
0.3 0.4 0.5 0.6 0.7 0.8
0.0
0.2
0.4
0.6
0.8
1.0
n=2000
δ
Propor
tion of n
ull h
[image:22.612.149.465.74.226.2]ypotheses rejected d=2 d=5 d=10
Figure 4: Proportion of times the null hypothesesHAD
0 (dashed) andH0AI(solid) are rejected,
plotted against the trueδ value, computed from 300 simulations. The horizontal dashed line at 0.05 shows the nominal level used for the tests. The model (4) was simulated atd= 2 (red), 5 (green), and 10 (blue) sites in [0,1]2 with n = 1000 (left), 2000 (right) replicates, using
an underlying Gaussian copula for W(s) with correlation function ρ(sj,sk) = exp{−(ksj −
skk/λ)ν} and λ = 0.5, ν = 1. Parameters were estimated by maximum likelihood based on
(18) with marginal thresholds u?
1 =· · ·=u?d= 0.95.
Type I error however suggests that the Hessian may not give a good representation of the
asymptotic variance, possibly owing to numerical approximations. In Section4.1 we suggest
using bootstrap methods to calculate uncertainty.
4
Oceanographic applications
4.1
Hindcast significant wave height data
Wadsworth and Tawn (2012) considered modeling the extremes of the winter observations
of a hindcast dataset of significant wave height, a measure of ocean energy, from the North
Sea. Calculating the coefficient of tail dependence η(h) for the wave height process, they
suggested that there was evidence for asymptotic independence of the process, although
strong spatial dependence between sites. Figure 1 suggests a high degree of ambiguity in
what the appropriate extremal dependence structure should be, since the summary χu is
decreasing as u increases, but not necessarily to a value of zero. This ambiguous situation
such as model (4) that can handle both scenarios.
Measurements of the hindcast are recorded at three-hourly intervals, yielding eight
ob-servations per day, over a period of 31 years. In total the dataset of winter (December,
January, February) wave heights consists of 22376 observations at 50 locations. Margins are
transformed to uniform using the semiparametric transformation of Coles and Tawn(1991).
The data are strongly temporally dependent and so we subsample to extract one realization
per day, giving 2797 observations. The resulting data still exhibit temporal dependence, but
this thinning eases the computational burden of model fitting, whilst the information loss
should be small. Finally, we select a subset of 20 sites to fit the model to, whilst using all
data for validation of the fit. Distance is measured in units of latitude (one unit ≈111km); the range of distances between sites is 0.27–2.99 units.
Model (4) was fitted by maximum likelihood based on (18) with thresholds u?
1 = · · · =
u?
d= 0.95, assuming a Gaussian copula for theW process (Example 1); Table 1reports the
results. The uncertainty measures are based on 200 bootstrap samples, created using the
stationary bootstrap (Politis and Romano, 1994). This procedure relies on sampling blocks
of geometric length; we sampled using an average length of 14 days, although any blocks that
reached the end of February (i.e., the end of one winter) were curtailed, so that observations
within a block are always consecutive. Figure 2 in the Supplementary Material shows that
this bootstrap procedure captures the temporal dependence in the extremes adequately.
The MLE ofδindicates asymptotic independence, although the 95% bootstrap confidence
interval includes values above 0.5, meaning that firm conclusions about the asymptotic
de-pendence class are difficult to draw; this further highlights the need for models that can
incorporate both scenarios. Whilst asymptotic independence is indicated, the value of δ
suggests that that our model is more suited than a simple Gaussian model. To reinforce
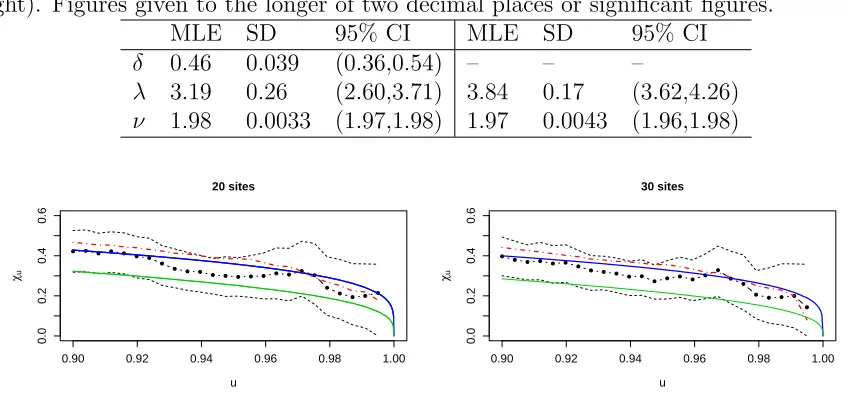
Table 1: MLEs, standard deviations (SD) of bootstrap replications, and approximate 95% confidence intervals (CI) for parameters of our model (4) (left) and the Gaussian process (right). Figures given to the longer of two decimal places or significant figures.
MLE SD 95% CI MLE SD 95% CI
δ 0.46 0.039 (0.36,0.54) – – –
λ 3.19 0.26 (2.60,3.71) 3.84 0.17 (3.62,4.26)
ν 1.98 0.0033 (1.97,1.98) 1.97 0.0043 (1.96,1.98)
0.90 0.92 0.94 0.96 0.98 1.00
0.0
0.2
0.4
0.6
u χu
20 sites
0.90 0.92 0.94 0.96 0.98 1.00
0.0
0.2
0.4
0.6
u χu
30 sites
Figure 5: Estimates of χu for the hindcast wave height data. Central black dots: empirical
estimate ofχu from the temporally thinned data; dashed lines: approximate 95% confidence
intervals based on the stationary bootstrap procedure described in the text; dot-dash red line: empirical estimate of χu from all data; thick solid blue line: fit from our model; thin
solid green line: fit from the Gaussian model. Left: data to which the model was fitted (from 20 sites); right: data to which the model was not fitted (from 30 sites).
reported on the right side of Table 1. Although the Gaussian model is nested within the
model we fit, testing is non-standard as it occurs at the boundary of the parameter space,
i.e., for δ = 0. The maximized log-likelihood for our model was 62 units higher than for
the Gaussian model, representing a clear improvement, although interpretation is difficult
as there is no explicit accounting for temporal dependence in the likelihood.
To assess the fit of the model, we consider two diagnostics. Figure 5 displays the fitted
value ofχu, as defined in (2), for the subset of sites included in the model fit (left panel) and
the subset of sites excluded from the fit (right panel). Although the model was fitted using
censored likelihood above a 95%-quantile threshold, the fit looks good on the plotted range
u∈(0.9,1). The Gaussian model clearly underestimates the dependence.
ex-ceedances, conditioning upon having at least one exceedance. The Supplementary Material
contains histograms of the distribution from our data sample and from the fitted model, and
suggests that the fitted model appears to capture this distribution quite well.
4.2
Newlyn oceanographic data
We fit a bivariate version of model (4), as discussed in Example 3, to the Newlyn
oceano-graphic data analyzed in Wadsworth et al. (2017) to illustrate an asymmetric construction,
and to compare with the symmetric models fitted therein. The data, shown in Figure 6,
comprise 2894 observations of wave height, surge and period, and we analyze them pairwise,
transforming to uniformity again using the semiparametric transformation ofColes and Tawn
(1991). To generate an asymmetric model, we assume that the copula of (W1, W2)T is that
of an inverted Dirichlet max-stable distribution (recall Example 2). The bivariate Dirichlet
max-stable distribution (Coles and Tawn, 1991) has exponent function
V(x1, x2) =
1
x1
1−Be
αx1
αx1+βx2
;α+ 1, β
+ 1
x2
Be
αx1
αx1+βx2
;α, β+ 1
, α, β >0,
where Be(·, a, b) is the Beta distribution function with shape parameters a and b. The bivariate inverted max-stable distribution with Pareto margins has joint survivor function
P(W1 > w1, W2 > w2) = exp[−V{(logw1)−1,(logw2)−1}]. To ensure consistency with the
approach of Wadsworth et al. (2017), we use the censored likelihood described therein and
at the end of§3.1 for both models. That is, we use the full density contribution when either variable is above a censoring threshold, which is set to the 95%-quantile in each margin.
Table 2 gives the Akaike Information Criterion (AIC) for the model of Wadsworth et al.
(2017) and our asymmetric model; improvements are seen for pairs involving wave period,
which shows a more asymmetric dependence structure than height and surge. One limitation
of this choice for (W1, W2)T is that it cannot exhibit negative dependence, and as such, the
![Figure 2: Left:and (the limit quantities Coefficient χu in (6) for model (4) plotted as a function of the thresholdu ∈ [0.9, 1] for δ = 0.1, 0.2, 0.3, 0.4, 0.45, 0.48, 0.5, 0.52, 0.55, 0.6, 0.7, 0.8, 0.9 (top to bottom)Wj, Wk)T with a Gaussian copula with co](https://thumb-us.123doks.com/thumbv2/123dok_us/9303452.430935/13.612.79.533.79.321/figure-quantities-coecient-plotted-function-thresholdu-gaussian-copula.webp)