RESEARCH ARTICLE
INDIVIDUAL KNOWLEDGE AND HOUSEHOLD LEVEL CAUSES ASSOCIATED WITH MALARIA
INCIDENCE IN A KUDAPAKKAM VILLAGE: A STATISTICAL EXPLORATION
Chandrasekaran, R., *Manimannan, G. and Prema, R.
Department of Statistics, Madras Christian College, Tambram, Chennai
ARTICLE INFO ABSTRACT
A multi-level analysis was carried out among people of Kudapakkam Village. This area was chosen as a model to study malaria Knowledge Attitude and Practices (KAP). This area is situated Thiruvallur district of Tamilnadu in India. The aim is to determine awareness factors associated with malaria. Data were collected from secondary sources containing 580 respondents. The data deals with socio demographic characteristics, knowledge of signs and symptoms, usage of Long Lasting Insecticidal
Net (LLIN) and adverse measures of malaria. Forty percent of respondents doesn’t know about signs and symptoms of malaria and remaining sixty percentage respondents know the signs and symptoms of malaria. Awareness of malaria, usage of LLIN was significantly associated with family grade of education; Awareness of malaria was not significantly associated with occupation, gender, respondent age, community, occupation of the family. Knowledge, signs and symptoms and usage of LLIN have no association with malaria attacks. In addition, to found the hidden pattern of Knowledge, signs and symptoms and usage of LLIN using two step cluster analysis and cross validate this pattern using discriminant analysis.
Copyright © Manimannan, G. et al. This is an open access article distributed under the Creative Commons Attribution License, which permits unrestricted use, distribution, and reproduction in any medium, provided the original work is properly cited.
INTRODUCTION
Health is the level of functional metabolic efficiency of an organism at both the micro (cellular) and macro (social) level. In the medical field, health is commonly defined as an organism’s ability to efficiently respond to challenges. An another widely accepted definition of health is that of the World Health Organization (WHO) which states that Health is a state of complete physical, mental and social well being and not merely the absence of disease on infirmity. Malaria is an infectious disease caused by a parasite (plasmodium) which is transmitted from human to human by the bite of infected female Anopheles mosquitoes. Malaria is one of the most successful parasites ever known to mankind. After thousands of years, it remains the world’s most pervasive infection, affecting at least 91 different countries and 300 million people. The disease causes fever, shivering, joint pain, headache, and vomiting. In severe cases, patients can have jaundice, kidney failure, anemia, and can lapse into a coma. It is ever-present in the tropics and countries in sub-Saharan Africa, which account for nearly 90 percent of all malaria cases. The majority of the remaining cases are clustered in India, Brazil, Afghanistan, Sri Lanka, Thailand, Indonesia, Vietnam, Cambodia, and China. Malaria causes 1 to 1.5 million deaths each year, and Africa, it accounts for 25 percent of all deaths of children under the age of five.
*Corresponding author: Manimannan, G.
Department of Statistics, Madras Christian College, Tambram, Chennai
Review of Literature
Prevention of the disease through better knowledge and awareness is the appropriate way to keep it away. And people remain healthy, as illness confusion and health-seeking behaviour may enhance or interfere with the effectiveness of control measures (Klein et al., 1998). Studies pertaining to knowledge, attitude and practices (KAP) showed that direct interaction with community, plays an important role in circumventing malaria problem (Collins et al., 1997; Singh et al., 1998). Poor people are at increased risk both of becoming infected with malaria and of having this more frequently. Child mortality rates are known to be higher in poorer households and malaria is responsible for a substantial proportion of their deaths. Poor families live in dwellings that offer little protection against mosquitoes and are less able to afford possessing insecticide-treated nets. Poor people are also less likely to be able to pay either for effective malaria treatment or for transportation to a health facility capable of treating the disease (WHO, RBM, 2003). To analyze the Knowledge, Attitude and Practice (KAP) in malaria control of the respondents using frequencies and chi-square test. In this paper attempt to identify the awareness based on age, education and sex using TwoStep cluster analysis. In addition, to cross-validate the TwoStep cluster analysis using Discriminant Analysis (DA).
Database and Methodology
In this study, the secondary data containing 580 respondents were selected and the information was based on their
ISSN: 0975-833X
International Journal of Current Research Vol. 5, Issue, 12, pp.4187-4193, December, 2013
INTERNATIONAL JOURNAL OF CURRENT RESEARCH
Article History:
Received 06thSeptember, 2013
Received in revised form 20thSeptember, 2013
Accepted 08thOctober, 2013
Published online 25thDecember, 2013
Key words:
Malaria, Chi-square test, LLIN,
two step cluster analysis and Discriminant analysis.
RESEARCH ARTICLE
INDIVIDUAL KNOWLEDGE AND HOUSEHOLD LEVEL CAUSES ASSOCIATED WITH MALARIA
INCIDENCE IN A KUDAPAKKAM VILLAGE: A STATISTICAL EXPLORATION
Chandrasekaran, R., *Manimannan, G. and Prema, R.
Department of Statistics, Madras Christian College, Tambram, Chennai
ARTICLE INFO ABSTRACT
A multi-level analysis was carried out among people of Kudapakkam Village. This area was chosen as a model to study malaria Knowledge Attitude and Practices (KAP). This area is situated Thiruvallur district of Tamilnadu in India. The aim is to determine awareness factors associated with malaria. Data were collected from secondary sources containing 580 respondents. The data deals with socio demographic characteristics, knowledge of signs and symptoms, usage of Long Lasting Insecticidal
Net (LLIN) and adverse measures of malaria. Forty percent of respondents doesn’t know about signs and symptoms of malaria and remaining sixty percentage respondents know the signs and symptoms of malaria. Awareness of malaria, usage of LLIN was significantly associated with family grade of education; Awareness of malaria was not significantly associated with occupation, gender, respondent age, community, occupation of the family. Knowledge, signs and symptoms and usage of LLIN have no association with malaria attacks. In addition, to found the hidden pattern of Knowledge, signs and symptoms and usage of LLIN using two step cluster analysis and cross validate this pattern using discriminant analysis.
Copyright © Manimannan, G. et al. This is an open access article distributed under the Creative Commons Attribution License, which permits unrestricted use, distribution, and reproduction in any medium, provided the original work is properly cited.
INTRODUCTION
Health is the level of functional metabolic efficiency of an organism at both the micro (cellular) and macro (social) level. In the medical field, health is commonly defined as an organism’s ability to efficiently respond to challenges. An another widely accepted definition of health is that of the World Health Organization (WHO) which states that Health is a state of complete physical, mental and social well being and not merely the absence of disease on infirmity. Malaria is an infectious disease caused by a parasite (plasmodium) which is transmitted from human to human by the bite of infected female Anopheles mosquitoes. Malaria is one of the most successful parasites ever known to mankind. After thousands of years, it remains the world’s most pervasive infection, affecting at least 91 different countries and 300 million people. The disease causes fever, shivering, joint pain, headache, and vomiting. In severe cases, patients can have jaundice, kidney failure, anemia, and can lapse into a coma. It is ever-present in the tropics and countries in sub-Saharan Africa, which account for nearly 90 percent of all malaria cases. The majority of the remaining cases are clustered in India, Brazil, Afghanistan, Sri Lanka, Thailand, Indonesia, Vietnam, Cambodia, and China. Malaria causes 1 to 1.5 million deaths each year, and Africa, it accounts for 25 percent of all deaths of children under the age of five.
*Corresponding author: Manimannan, G.
Department of Statistics, Madras Christian College, Tambram, Chennai
Review of Literature
Prevention of the disease through better knowledge and awareness is the appropriate way to keep it away. And people remain healthy, as illness confusion and health-seeking behaviour may enhance or interfere with the effectiveness of control measures (Klein et al., 1998). Studies pertaining to knowledge, attitude and practices (KAP) showed that direct interaction with community, plays an important role in circumventing malaria problem (Collins et al., 1997; Singh et al., 1998). Poor people are at increased risk both of becoming infected with malaria and of having this more frequently. Child mortality rates are known to be higher in poorer households and malaria is responsible for a substantial proportion of their deaths. Poor families live in dwellings that offer little protection against mosquitoes and are less able to afford possessing insecticide-treated nets. Poor people are also less likely to be able to pay either for effective malaria treatment or for transportation to a health facility capable of treating the disease (WHO, RBM, 2003). To analyze the Knowledge, Attitude and Practice (KAP) in malaria control of the respondents using frequencies and chi-square test. In this paper attempt to identify the awareness based on age, education and sex using TwoStep cluster analysis. In addition, to cross-validate the TwoStep cluster analysis using Discriminant Analysis (DA).
Database and Methodology
In this study, the secondary data containing 580 respondents were selected and the information was based on their
ISSN: 0975-833X
International Journal of Current Research Vol. 5, Issue, 12, pp.4187-4193, December, 2013
INTERNATIONAL JOURNAL OF CURRENT RESEARCH
Article History:
Received 06thSeptember, 2013
Received in revised form 20thSeptember, 2013
Accepted 08thOctober, 2013
Published online 25thDecember, 2013
Key words:
Malaria, Chi-square test, LLIN,
two step cluster analysis and Discriminant analysis.
RESEARCH ARTICLE
INDIVIDUAL KNOWLEDGE AND HOUSEHOLD LEVEL CAUSES ASSOCIATED WITH MALARIA
INCIDENCE IN A KUDAPAKKAM VILLAGE: A STATISTICAL EXPLORATION
Chandrasekaran, R., *Manimannan, G. and Prema, R.
Department of Statistics, Madras Christian College, Tambram, Chennai
ARTICLE INFO ABSTRACT
A multi-level analysis was carried out among people of Kudapakkam Village. This area was chosen as a model to study malaria Knowledge Attitude and Practices (KAP). This area is situated Thiruvallur district of Tamilnadu in India. The aim is to determine awareness factors associated with malaria. Data were collected from secondary sources containing 580 respondents. The data deals with socio demographic characteristics, knowledge of signs and symptoms, usage of Long Lasting Insecticidal
Net (LLIN) and adverse measures of malaria. Forty percent of respondents doesn’t know about signs and symptoms of malaria and remaining sixty percentage respondents know the signs and symptoms of malaria. Awareness of malaria, usage of LLIN was significantly associated with family grade of education; Awareness of malaria was not significantly associated with occupation, gender, respondent age, community, occupation of the family. Knowledge, signs and symptoms and usage of LLIN have no association with malaria attacks. In addition, to found the hidden pattern of Knowledge, signs and symptoms and usage of LLIN using two step cluster analysis and cross validate this pattern using discriminant analysis.
Copyright © Manimannan, G. et al. This is an open access article distributed under the Creative Commons Attribution License, which permits unrestricted use, distribution, and reproduction in any medium, provided the original work is properly cited.
INTRODUCTION
Health is the level of functional metabolic efficiency of an organism at both the micro (cellular) and macro (social) level. In the medical field, health is commonly defined as an organism’s ability to efficiently respond to challenges. An another widely accepted definition of health is that of the World Health Organization (WHO) which states that Health is a state of complete physical, mental and social well being and not merely the absence of disease on infirmity. Malaria is an infectious disease caused by a parasite (plasmodium) which is transmitted from human to human by the bite of infected female Anopheles mosquitoes. Malaria is one of the most successful parasites ever known to mankind. After thousands of years, it remains the world’s most pervasive infection, affecting at least 91 different countries and 300 million people. The disease causes fever, shivering, joint pain, headache, and vomiting. In severe cases, patients can have jaundice, kidney failure, anemia, and can lapse into a coma. It is ever-present in the tropics and countries in sub-Saharan Africa, which account for nearly 90 percent of all malaria cases. The majority of the remaining cases are clustered in India, Brazil, Afghanistan, Sri Lanka, Thailand, Indonesia, Vietnam, Cambodia, and China. Malaria causes 1 to 1.5 million deaths each year, and Africa, it accounts for 25 percent of all deaths of children under the age of five.
*Corresponding author: Manimannan, G.
Department of Statistics, Madras Christian College, Tambram, Chennai
Review of Literature
Prevention of the disease through better knowledge and awareness is the appropriate way to keep it away. And people remain healthy, as illness confusion and health-seeking behaviour may enhance or interfere with the effectiveness of control measures (Klein et al., 1998). Studies pertaining to knowledge, attitude and practices (KAP) showed that direct interaction with community, plays an important role in circumventing malaria problem (Collins et al., 1997; Singh et al., 1998). Poor people are at increased risk both of becoming infected with malaria and of having this more frequently. Child mortality rates are known to be higher in poorer households and malaria is responsible for a substantial proportion of their deaths. Poor families live in dwellings that offer little protection against mosquitoes and are less able to afford possessing insecticide-treated nets. Poor people are also less likely to be able to pay either for effective malaria treatment or for transportation to a health facility capable of treating the disease (WHO, RBM, 2003). To analyze the Knowledge, Attitude and Practice (KAP) in malaria control of the respondents using frequencies and chi-square test. In this paper attempt to identify the awareness based on age, education and sex using TwoStep cluster analysis. In addition, to cross-validate the TwoStep cluster analysis using Discriminant Analysis (DA).
Database and Methodology
In this study, the secondary data containing 580 respondents were selected and the information was based on their
ISSN: 0975-833X
International Journal of Current Research Vol. 5, Issue, 12, pp.4187-4193, December, 2013
INTERNATIONAL JOURNAL OF CURRENT RESEARCH
Article History:
Received 06thSeptember, 2013
Received in revised form 20thSeptember, 2013
Accepted 08thOctober, 2013
Published online 25thDecember, 2013
Key words:
Malaria, Chi-square test, LLIN,
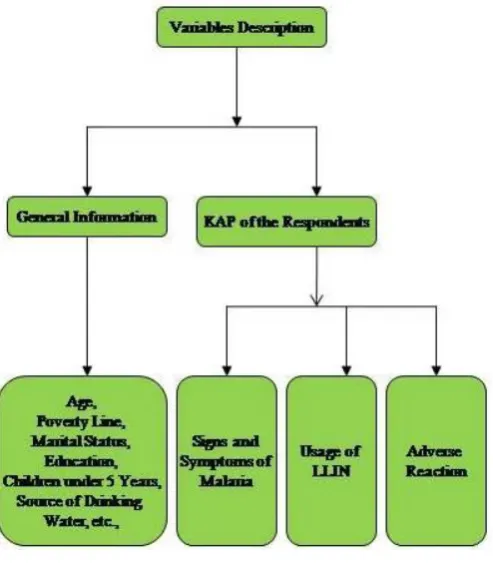
respondents Knowledge, Attitude and Practice (KAP) of malaria control in Kudapakkam village, Thiruvallur District. Kudapakkam village consists of two blocks. In 2010, it is noted that people from one block were mostly affected by malaria. Data were collected from health workers using simple random sampling method. The following flow charts describing variables.
Fig. Variable Description
Algorithm for Two Step Cluster Analysis
The Two Step Cluster Analysis method is an exploratory tool designed to reveal natural groupings (or clusters) within a data set that would otherwise not be clear. The algorithm employed by this procedure has several desirable features that differentiate it from traditional statistical clustering techniques:
Step1: The ability to create clusters based on both categorical
and continuous variables.
Step 2: Automatic selection of the number of clusters. Step 3: The ability to analyze huge data files efficiently.
Clustering Principles
In order to handle categorical and continuous variables, the Two Step Cluster Analysis procedure uses a likelihood distance measure which assumes that variables in the cluster model are independent. Further, each continuous variable is assumed to have a normal (Gaussian) distribution and each categorical variable is assumed to have a multinomial distribution. Empirical internal testing indicates that the procedure is fairly robust to violations of both the assumption of independence and the distributional assumptions, but you should try to be aware of how well these assumptions are met. The two steps of the Two Step Cluster Analysis procedure's algorithm can be summarized as follows:
Step 1. The procedure begins with the construction of a Cluster
Features (CF) Tree. The tree begins by placing the first case at the root of the tree in a leaf node that contains variable information about that case. Each successive case is then added to an existing node or forms a new node, based upon its similarity to existing nodes and using the distance measure as the similarity criterion. A node that contains multiple cases contains a summary of variable information about those cases. Thus, the CF tree provides a capsule summary of the data file.
Step 2. The leaf nodes of the CF tree are then grouped using an
agglomerative clustering algorithm. The agglomerative clustering can be used to produce a range of solutions. To determine which number of clusters is "best", each of these cluster solutions is compared using Schwarz's Bayesian Criterion (BIC) or the Akaike Information Criterion (AIC) as the clustering criterion (BIRCH by Zhang et al, 1996)
Number of clusters: auto-cluster
A characteristic of hierarchical clustering is that it produces a sequence of partitions in one run: 1, 2, 3,…, clusters. A K-means algorithm would need to run multiple times (one for each specified number of clusters) in order to generate the sequence. To determine the number of clusters automatically, SPSS developed a two-step procedure that works well with the hierarchical clustering method. In the first step, the BIC or AIC for each number of clusters within a specified range is calculated and used to find the initial estimate for the number of clusters. In the second step, the initial estimate is refined by finding the largest increase in distance between the two closest clusters in each hierarchical clustering stage.
The BIC and AIC for Jclusters are defined as
) log( 2
) (
1
N m J
BIC j
J
j j
j J
j
j m J
AIC( ) 2 2
1
Where
K
n k
k A
j J k L
m 2 1
Distance Measure
A distance measure is needed in both the pre-cluster and cluster steps. Two distance measures are available.
Log-Likelihood Distance
The log-likelihood distance measure can handle both continuous and categorical variables. It is a probability based distance. The distance between two clusters is related to the decrease in log-likelihood as they are combined into one cluster. In calculating log-likelihood, normal distributions for continuous variables and multinomial distributions for categorical variables are assumed. It is also assumed that the variables are independent of each other, and so are the cases. The distance between clusters jand s is defined as
j s js
s j
d( , ) , , where (1)
B A K k vk K k vk k v E 1 1 22 ˆ ˆ
ˆ log 2 1 (2) N N N N E vkl L l vkl vk A log ˆ 1
(3)If ˆk2is ignored in equation (2), the distance between clusters j and s would be exactly the decrease in log-likelihood when the
two clusters are combined. The ˆk2 term is added to solve the
problem caused by ˆk2 0 which would result in the natural logarithm being undefined (this would occur, for example, when a cluster only has one case).
Euclidean distance
This distance measure can only be applied if all variables are continuous. The Euclidean distance between two points is clearly defined. The distance between two clusters is here defined by the Euclidean distance between the two cluster centers. A cluster center is defined as the vector of cluster means of each variable. In our research paper, we are using log-likelihood distance measure.
DISCRIMINANT ANALYSIS
RESULT AND DISCUSSION
[image:3.595.70.267.51.166.2]The Auto-Clustering table can be used to assess the optimal number of clusters in our analysis, as shown below.
Table 1. Auto-Clustering
Number of Clusters
Schwarz's Bayesian Criterion (BIC)
Ratio of Distance Measures
1 2 3 4 5 6 7 8 9 10 11 12 13 14 15 16089.308 15451.838 15091.936 15088.072 15157.392 15313.423 15491.582 15695.668 15919.301 16154.764 16404.002 16657.945 16921.100 17185.135 17464.191 1.353 1.828 1.205 1.321 1.089 1.117 1.096 1.062 1.078 1.027 1.056 1.005 1.102 1.047
The clustering criterion (in this case the BIC) is computed for each potential number of clusters. Smaller values of the BIC indicate better models, and in this situation, the "best" cluster solution has the smallest BIC. However, there are clustering problems in which the BIC will continue to decrease as the number of clusters increases, but the improvement in the cluster solution, as measured by the BIC Change, is not worth the increased complexity of the cluster model, as measured by the number of clusters. In such situations, the changes in BIC and changes in the distance measure are evaluated to determine the "best" cluster solution. A good solution will have a reasonably large Ratio of BIC Changes and a large Ratio of Distance Measures (Table 1).
Table 2. Cluster Distribution
[image:3.595.298.548.70.233.2]Cluster Cluster Size Percentage of Combined Percentage of Total 1 2 3 Combined 285 227 68 580 49.1% 39.1% 11.7% 100.0% 49.1% 39.1% 11.7% 100.0%
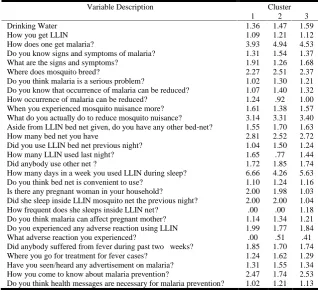
Table 3. Cluster Centroids for KAP
Variable Description Cluster
1 2 3
Drinking Water How you get LLIN How does one get malaria?
Do you know signs and symptoms of malaria? What are the signs and symptoms?
Where does mosquito breed?
Do you think malaria is a serious problem?
Do you know that occurrence of malaria can be reduced? How occurrence of malaria can be reduced?
When you experienced mosquito nuisance more? What do you actually do to reduce mosquito nuisance? Aside from LLIN bed net given, do you have any other bed-net? How many bed net you have
Did you use LLIN bed net previous night? How many LLIN used last night? Did anybody use other net ?
How many days in a week you used LLIN during sleep? Do you think bed net is convenient to use?
Is there any pregnant woman in your household?
Did she sleep inside LLIN mosquito net the previous night? How frequent does she sleeps inside LLIN net?
Do you think malaria can affect pregnant mother? Do you experienced any adverse reaction using LLIN What adverse reaction you experienced?
Did anybody suffered from fever during past two weeks? Where you go for treatment for fever cases?
Have you seen/heard any advertisement on malaria? How you come to know about malaria prevention?
Do you think health messages are necessary for malaria prevention?
[image:3.595.137.456.499.789.2]The cluster distribution Table 2 shows the frequency of each cluster. Of the 580 total cases, were included to the analysis and assigned to clusters, 285 were assigned to the first cluster, 227 to the second, and 68 to the third cluster respectively. The centroids show that the clusters are well separated by the continuous and categorical variables (Table 3). KAP in cluster 1 about Malaria, LLIN and Signs and symptoms are considerably very Low. In Cluster 3 KAP is high and cluster 2 KAP is Moderate level.
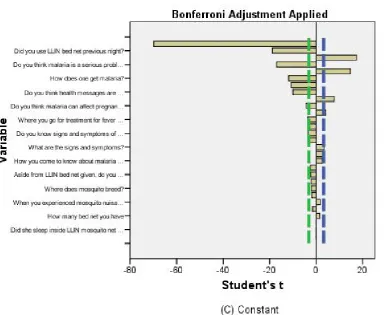
Cluster 1’s gender, age and education variables were important in differentiating this cluster from the other clusters. Cluster 2’s age, education and gender variables were important in differentiated this cluster from the other clusters. Cluster 3’seducation, age and gender variables were important in differentiated this cluster from the other clusters.
a kudapakkam village: a statistical exploration
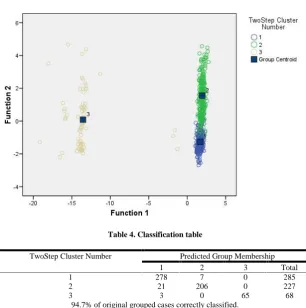
The continuous variable wise importance plots are printed for each cluster. On the X‐axis is the Student’s t statistic and on the Y‐axis is the continuous variable. If bar exceeds the critical value line, then it indicates that the variable is important in distinguishing the clusters from each other. The plots below show that Clusters 2 are differentiated by mean KAP of the respondents in both (negative and positive) direction, while Clusters 1 and 3 is differentiated by KAP in a positive direction. The classification table 4 shows the practical results of using the discriminant model. Of the cases used to create the model in first cluster, 278 of the 285 respondents who previously defaulted are classified correctly. In second cluster, 206 of the 227 respondents who previously defaulted are classified correctly. In third cluster, 65 of the 68 respondents who previously defaulted are classified correctly. Overall, 94.7% of the cases are classified correctly. Classifications based upon the cases used to create the model tend to be too "optimistic" in the sense that their classification rate is inflated.
Conclusion
From the result of chi-square and t-test, we reject the null hypothesis and conclude that the variables gender, education and age of KAP level of malaria is not the same. The centroids show that the clusters are well separated by the continuous and categorical variables. KAP in cluster 1 about Malaria, LLIN and signs and symptoms are considerably very Low. In Cluster 3 KAP is High and in cluster 2 KAP is Moderate using Two Step cluster analysis. Cross-validation achieved 95 percent of the original groups were classified correctly and rest of them
misclassified using Discriminant analysis. This case study is useful for a malaria KAP care which intends to split the respondents, for a better KAP. When new patients turn up for KAP proper guidance can be given based on TwoStep and Discriminant Classification.
Acknowledgement
We would like to express our grateful thanks to D. Aswini Kumar Maji, Health officer for Providing us the data for research.
REFERENCES
Collins KA, Samuel KD, Edwin A A, Kwadwo A, Korum, Francis KN. Malaria related beliefs and behaviour in southern Ghana: implications for treatment, prevention and control. Trop Med Int Hlth 1997; 2(5): 488–99.
Klein RE, Weller SC, Zeissing R, Richards FO, Ruebush TK. Knowledge, belief and practices in relation to malaria transmission and vector control in Guatemala. Am J Trop Med Hyg. 1995; 52: 383–8.
Manimannan G., S. Hari and G. Vijay Thiraviyam (2013), Data Mining Applications in Master Health Checkup: a Statistical Exploration, International Journal of Engineering Research & Technology (IJERT) Vol. 2 Issue 2.
Norusis, M. 2004. SPSS 13.0 Statistical Procedures Companion. Upper Saddle-River, N.J.: Prentice Hall, Inc.. Two Step Cluster Analysis, available at
http://support.spss.com/productsext/spss/documentation/ statistics/algorithms/14.0/twostep_cluster.pdf
[image:7.595.147.454.102.411.2]*******
Table 4. Classification table
TwoStep Cluster Number Predicted Group Membership
1 2 3 Total
1 2 3
278 21
3
7 206
0
0 0 65