applied to dart flight
JAMES, David <http://orcid.org/0000-0002-1135-626X> and POTTS,
Jonathan <http://orcid.org/0000-0001-8192-0295>
Available from Sheffield Hallam University Research Archive (SHURA) at:
http://shura.shu.ac.uk/21754/
This document is the author deposited version. You are advised to consult the
publisher's version if you wish to cite from it.
Published version
JAMES, David and POTTS, Jonathan (2018). Experimental validation of dynamic
stability analysis applied to dart flight. Sports Engineering, 21, 347-358.
Copyright and re-use policy
See
http://shura.shu.ac.uk/information.html
Sheffield Hallam University Research Archive
Vol.:(0123456789) https://doi.org/10.1007/s12283-018-0279-9
ORIGINAL ARTICLE
Experimental validation of dynamic stability analysis applied to dart
flight
David James1 · Jonathan Potts1
© The Author(s) 2018
Abstract
The game of darts attracts a large international following and can be fiercely competitive. Despite its popularity, and the large equipment market, no previous peer-reviewed studies have examined the trajectory of a dart in flight. This study used high-speed video techniques to measure the trajectories of 225 dart throws from 19 amateur players. The dart’s pitch and angle of attack were found to oscillate during flight in a manner that is analogous to damped harmonic motion. It was also found that the dart’s oscillation frequency was strongly correlated to launch speed, whilst its characteristic wavelength and damping ratio were independent of launch speed. The measured wavelength of oscillation (2.16 m) was found to be simi-lar to the regulation throwing distance (2.37 m). It is proposed that the dart is ‘tuned’ to the throwing distance such that it undergoes one full oscillation before striking the board. The dart flight was modelled using a classical dynamic stability analysis and good agreement was found between the experimental observations and the theoretical predictions. The success of the model confirms that the approach can be used to explore the dynamics of different dart designs through parametric sensitivity analyses.
Keywords Aerodynamics · Darts · Oscillation · Stability analysis · Trajectory
List of symbols
xac Aerodynamic centre
AR Aspect ratio
B Wing span length
xdart Centre of gravity
cMAC Mean aerodynamic chord
CMα Pitching moment gradient coefficient
cNα Normal force gradient coefficient, infinite span
CNα Normal force gradient coefficient, finite span
cr Fin root chord length
ct Wing tip chord length
F Planform parameter
f Function
h Cone section axial height
i Section number
Iy Section moment of inertia
lb Barrel length (including needle)
ls Stem length
M Pitching moment
Mα Pitching moment alpha stability derivative
mi Section mass
mL Mass of full height (not truncated) cone
Mq Pitching moment pitch rate stability derivative
mS Equivalent mass missing cone
n Number of sections
N Aerodynamic normal force
q Pitch rate
r2 Coefficient of determination rrot Radius of rotation
S Flight surface area
t Time
xsm Static margin
yfin Single fin mass centre α Angle of attack
Δ Perturbation from steady flight condition
λ Wavelength of the angle of attack oscillation
Λ Sweep angle
λc Fin taper ratio
π Ratio of circle circumference to diameter
ρ Density of air
θ Pitch angle
ζ Damping ratio * David James
1 Department of Engineering and Mathematics, Centre
λc Fin taper ratio
ϕ Body diameter
ω Damped natural frequency
ωn Undamped natural frequency
1 Introduction
The game of darts has a large international following. At the highest levels, the game is fiercely competitive with numer-ous televised tournaments and considerable rewards for the best players. The game is also a popular pastime with a long and colourful history.
The aim of the game is to successfully target different point zones on a board by throwing a dart from a set dis-tance. Whilst this may appear simple, commentators have argued that an explicit “appliance of science” exists with regards to various aspects of the game [1]. Smeets et al. [2] state that the position and orientation of a dart’s resting position in the board is determined by the angle, speed and position of the hand at release. This is analogous to stating that the dynamics of the dart’s flight towards the scoring bed are determined by its initial conditions, namely, position, velocity, orientation and angular velocity.
Similar to other projectiles, when a dart is in free flight its motion is determined by its weight, its aerodynamic drag force, and its aerodynamic lift force. The dart’s weight acts at its centre of gravity ( xdart ), whilst the aerodynamic drag and lift forces act at its aerodynamic centre ( xac).
An initial observational consideration of dart flight reveals the trajectory to be non-trivial since the magnitude and direction of the aerodynamic forces will change during flight leading to a complex trajectory.
A number of studies have examined the flight of similar projectiles such as badminton shuttlecocks [3, 4] and archery arrows [5, 6]. Shuttlecock and arrow flight is somewhat simi-lar to that of a dart since in all cases the aerodynamic centre is located behind the centre of gravity. One can assume this
to be true for a dart since it possesses large fins on its rear, and a centre of gravity located towards its tip. Cooke [3] describes how the distance (the static margin) between a shuttlecock’s aerodynamic centre and centre of gravity cre-ates a ‘restoring’ pitching moment that acts to stabilise its flight. Park [5] describes similar behaviour in the flight of an arrow.
By the 1990s, the concept of ‘stacking’ was emerging [1]. This technique regards the process of throwing darts to land on a vertical alignment to a preceding dart such that the highest possible score can be achieved (three darts within the treble 20 scoring bed). Stacking requires the ability to throw darts that rest in the dartboard close to, or below the horizontal. If the dart rests in the board inclined above the horizontal the barrel, stem and flight all create a visual and physical obstruction of the intended scoring bed. Figure 1
shows the disadvantages of landing a dart at an angle above the horizontal. Darts commentators often refer to the suc-cessful implementation of the stacking technique as the key to a player’s performance [7–9].
Despite the popularity of darts and the evident impor-tance of understanding the mechanics of dart flight, there are no peer-reviewed studies on the topic. Some authors have published studies concerning dart accuracy and the biomechanics of throwing. Smeets et al. [2] investigated the hypothesis that dart throwing accuracy was correlated to release time precision, and Burke and Yeadon [10] per-formed a biomechanical analysis of participants’ dart throw-ing technique to measure accuracy with respect to release time and hand speed; however, no measurements of actual dart trajectories were made during either of these throwing studies.
The need of darts players and dart manufacturers to better understand the mechanics of dart flight provides the motiva-tion for this study. This study will compare flight dynamics parameters from experimentally observed dart trajectories to theoretical predictions from a developed flight stability model. The aim of this work is to determine the validity
[image:3.595.55.546.554.693.2]of a flight stability model for darts to better understand the complex trajectory.
2 Methods
2.1 Experimental observation
A large throwing trial was observed to provide a descrip-tion of typical dart flight. The dart throwing trial, approved by Sheffield Hallam University’s research ethics committee, was performed by a total of 19 participants, who provided written informed consent and participated voluntarily.
The 19 participants each performed four dart throwing trials. A trial consists of throwing three darts towards a dart-board, providing the study total of 228 dart throws. Three of the throws were void due to technical difficulties leaving a total of 225 valid dart throws in the data set. Eighteen of the participants were male and one was female. All participants considered themselves to be skilled amateur darts players and all threw with their dominant arm.
Participants were permitted to throw 12 practice darts by way of a warm-up, thus familiarising themselves with the general laboratory environment. Participants were advised to aim for the treble 20 scoring bed. This is a scoring area of decisive importance in the sport of darts [11], and ensured all participants were at least aiming for the same target irre-spective of where on the dartboard the darts finally came to rest. Since the task involved muscle activity that was con-siderably below maximal levels, there was no possibility of physical fatigue [12].
A dartboard was positioned on a wall at a perpendicular height of 1.73 m from the centre of the bull’s-eye to the floor. The throwing line was located at the competition distance of 2.37 m from the front of the dartboard in accordance with
both governing bodies of darts, the Darts Regulation Author-ity [13] and the World Darts Federation [14].
Thin strips of reflective tape were attached to each dart in two positions; the front marker being taped around the front of the barrel near to the point, and the back marker being taped around the stem, near to where the flight is positioned. It was assumed that the addition of the reflective tape would not affect the performance of the dart. Participants threw a set of standard darts, with a total mass of 26.7 ± 0.2 g. The barrels were of straight weight design, meaning the mass was distributed evenly along the entire length of the bar-rel. The barrels were 23.5 ± 0.3 g, 80% tungsten, of length 57.4 mm (excluding points) and diameter 7.08 mm. Nylon stems were used, measuring 44.7 mm in length (exclud-ing thread) with diameter 7.08 mm at the widest point and 4.88 mm at the narrowest point. Standard shaped fins were used, with a span of 42.9 mm and a root chord of 50.3 mm. The combined mass of the stem and fins was 1.8 ± 0.1 g.
A Phantom V4.3 high-speed video camera, operating at 100 Hz and with an exposure time of 0.2 ms was used to capture the two-dimensional dart trajectories. The camera was positioned perpendicular to the throwing area to record the dart trajectory within the sagittal plane, as the major-ity of movement associated with throwing darts primarily occurred within this plane [15]. The camera was centred at the midpoint of the throwing arc, and at an equivalent height to the centre of the bull’s-eye. To minimise any parallax errors, the camera was located 8 m from the throwing plane.
Figure 2 provides a typical screenshot from the high-speed video footage.
The dart trajectories were analysed using bespoke image analysis software. The 2D coordinate positions of both mark-ers were obtained by manually digitising both markmark-ers during every frame of each dart trajectory. This resulted in a pair of pixel coordinates for both markers at each frame of the trajec-tory. A large checkerboard of known dimensions was filmed
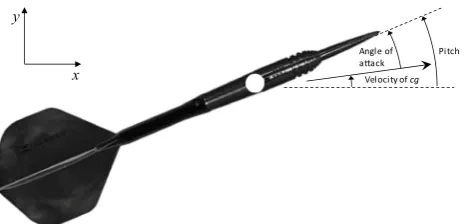
[image:4.595.56.547.527.695.2]in the plane of motion to calibrate the pixel coordinates. Con-sequently, several dynamic parameters were calculated at a frequency of 100 Hz throughout the trajectory; these included 2D position xdart in the sagittal plane, velocity of xdart (speed and flight path angle relative to the horizontal in the sagittal plane), pitch angle (angle of dart relative to horizontal in the sagittal plane), angle of attack (difference between pitch and flight path angle), and angular velocity (rate of change of pitch angle). Figure 3 shows a schematic of these parameters.
To calculate the changing velocity of xdart , best fit
second-order polynomial functions were recursively placed through a moving window of eight consecutive pairs of horizon-tal position and time data, and eight consecutive pairs of vertical position and time data. The gradients of the func-tions were used to determine the changing velocity of xdart throughout the trajectory.
Similarly, to calculate angular velocity, best fit second-order polynomial functions were recursively placed through a moving window of eight consecutive pairs of pitch angle and time data. The gradients of the functions were used to deter-mine the changing angular velocity throughout the trajectory. A repeatability study was undertaken to determine the level of human error in manually tracking the dart trajecto-ries. One single dart trajectory was chosen at random and digitised 20 times. Based on one standard deviation, the velocity of xdart was measured to within ± 0.05 m s−1 and
± 0.32°, and the angular velocity was measured to within ± 31 deg s−1.
2.2 Theoretical description
The dart was modelled using classical flight stability theory, as applied to conventional fixed wing aircraft and rocket-like geometries, assuming an initial steady-state (straight and level) flight condition. The model first considered static stability, establishing the centre of gravity and aerodynamic centre (neutral point) positions and a restorative static sta-bility measure inherent to the dart geometry (static mar-gin). The model subsequently considered dynamic stability, applying small-disturbance theory based on a pure pitching
motion analysis [16], to describe the response to a dynamic divergence perturbation for a given geometry with defined inertial properties. The output from this model was not a trajectory, more fundamentally it predicted the frequency of the free oscillatory dynamic response and a damping ratio, analogous to a mechanical mass-spring-damper system. This theoretical analysis can then be applied to model any dart where basic mass, mass distribution and geometric dimen-sions are measured experimentally. Furthermore, a gener-alised model such as this was developed such that future studies will be able to explore the dynamics of different dart designs through parametric sensitivity analyses.
2.2.1 Fin geometry
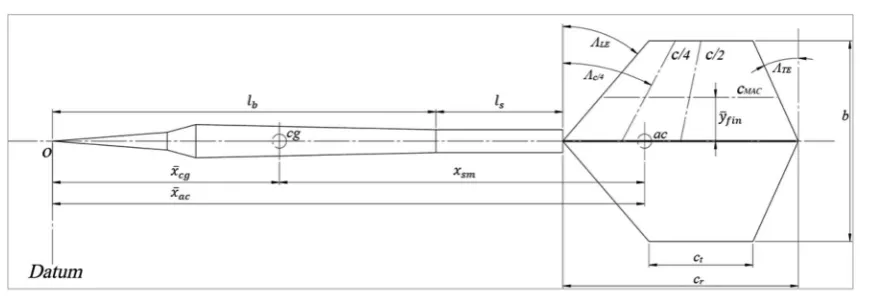
A dart has four rotationally symmetric fins, each perpendicu-lar to an adjacent pair. The inboard fin root chord length cr
is located where the four fins meet (coincident to the dart centreline axis) and the outboard wing tip chord length ct, illustrated in Fig. 4. The wing span length b, refers to the width from tip to tip of a planar fin pair, perpendicular to the chord length. The fin taper ratio, root to tip chord, is denoted
λc and the flight surface area of two planar fins is S. The sweep angle of the leading and trailing edges of each fin are
ΛLE and ΛTE, respectively, where positive sweep angle is for an edge rotated towards the tail of the dart.
2.2.2 Centre of gravity
The theoretical location of xdart was defined by treating
the needle as a cone, the barrel sections as two truncated cones with coincident base surfaces, the stem as a sim-ple cylinder and the flight as two flat plates perpendicu-lar to each other. The centre of gravity for each section (
xcone, xtrunc,xcylandxflight) was defined as follows:
where h is the axial height of each section and ϕL and ϕS are large and small end diameters of truncated cone sections, respectively. xdart is then found by taking moments of each individual section about a datum, located on
(1) xcone= h
4,
(2)
xtrunc= h 4
(
𝜙2L+2𝜙L𝜙S+3𝜙2S
𝜙2L+𝜙L𝜙S+𝜙2S )
,
(3)
xcyl= h
2,
(4) xflight= 1
8 (
cr+ct+4btanΛLE) , Velocity of cg
Pitch Angle of a ack
x y
[image:5.595.56.290.578.690.2]the needle point, such that, where i is the section number, n
number of sections considered, mi is the mass of each section and xi is the location of each section.
2.2.3 Moment of inertia
The local moment of inertia Iy was calculated about each sec-tion xibefore translating to xdart , using the parallel axis theo-rem. The flight was approximated as two perpendicular flat plates with rhomboidal external dimensions and characteristic length scales defined by mean aerodynamic chord cMAC and span b.
where mL is the mass of the full height (not truncated) cone with base diameter ϕL, and mS is the equivalent mass of the missing cone part using base diameter ϕS. xL andxS are the centre of gravity locations for the full and missing truncated sub-geometries, respectively. cMAC and b were the charac-teristic lengths to model the moment of inertia of the flight, for a tapered wing;
(5) xdart=
∑n i=1mixi ∑n
i=1mi ,
(6)
Iycone = 3m
80 (
𝜙2L+h2),
(7)
I ytrunc=
𝜙2
LmL−𝜙2SmS
(
𝜙L−𝜙S)2
3 80
[ (
𝜙L−𝜙S)2+h2
]
+m L
(
x
L−xtrunc
)2 −m
S
(
h+x
S−xtrunc
)2 ,
(8) Iy
cyl = m
48
(
3𝜙2L+4h2)
,
(9) Iy
flight= m 24 (
2c2MAC+b2),
The fin aerodynamic forces act at xac , typically approxi-mated at cMAC/4 from the leading edge. xac from the dart
needle datum is given by,
where yfin is the fin centre of gravity displacement perpen-dicular to the dart centreline given by,
and lb and ls lengths of the barrel (including needle) and stem, respectively. Assuming the fin has minimal uniform thickness, xfin=xflight , the centre of gravity of a single fin
is at the intersection of cMAC and c∕2 lines, as depicted in
Fig. 4.
2.2.4 Static stability
To calculate aerodynamic loading from each dart section, an analysis similar to Barrowman and Barrowman [17] on slender finned vehicles (rockets) was followed. However, contributions from the needle, barrel and stem sections were considered negligible relative to the aerodynamic loading on the fins. The static stability analysis was treated as ‘fins only’ with an aerodynamic normal force N (body fixed lift) perpendicular to the dart centreline acting at aerodynamic centre xac providing a pitching moment M, with rotational direction in the sagittal plane. Two pla-nar fins were considered as a short span low aspect ratio
AR wing, defined as b2/S, which is typically an indicator
of lower aerodynamic efficiency. The fins’ aerodynamic (10)
cMAC= 2cr 3
𝜆2
c+𝜆c+1
𝜆c+1 .
(11) xac = cMAC
4 +yfin tan ΛLE+lb+ls,
(12)
yfin= b 6
2𝜆c+1 𝜆c+1
[image:6.595.82.519.52.201.2]pitching moment was considered small relative to the large moment arm provided by the aerodynamic lift about xdart.
The theoretical body fixed lift curve slope cNα for a two-dimensional infinite span wing with uniform cross-section is given by 2π per radian of angle of attack α [18]. The lift curve slope was corrected for the three-dimensional dart flight wing by defining a curve through an extensive set of both numerical and empirical data [19], to account for low planform area S and sweep angle about the quarter chord line Λc∕4 given by,
where the planform parameter,
As the flight pitching moment is assumed small, the slope coefficient CMα for the dart is defined by the slope of the normal force and the distance between aerodynamic centre ( xac ) and centre of gravity ( xdart),
where the distance between centres xsm is known as the static margin,
2.2.5 Dynamic stability
The classical flight dynamic stability analysis is used a sec-ond-order differential equation, similar to a mass-spring-damper system, to yield frequency of oscillation in pitch and a damping ratio. This was expressed through a simplified one degree of freedom equation of motion where the sum of the pitching moments about xdart is given by,
where 𝜃̈ is the angular acceleration. Small-disturbance the-ory [16] was then applied, assuming small deviations about a steady flight condition. This assumption does not hold for projectiles exhibiting large pitch angles and a transient flight trajectory angle; however, due to the simplicity of the dart geometry and dynamics, the small-disturbance approach was followed. Pitching moment and pitch angle were expressed as reference values with subscript o and a perturbation from that value with prefix Δ.
(13) CN
𝛼 =
cN𝛼cosΛc∕4
2 F +
√ 1+ 4
F2 ,
(14) F= 2𝜋AR
cN
𝛼cosΛc∕4 .
(15) CM
𝛼 = − xsm
cMAC CN
𝛼,
(16)
xsm=xac−xdart.
(17)
M=Iy𝜃,̈
(18) M=Mo+ ΔM,
(19) 𝜃=𝜃o+ Δ𝜃,
The reference values Mo and θo, for straight and level flight are zero reducing to the pitching moment perturba-tion equaperturba-tion.
For an uncontrolled longitudinal free flight analysis,
where q is the pitch rate and ̇𝛼 is the rate of change of angle of attack. The ̇𝛼 contribution is considered small as there is no main wing. Typically ̇𝛼 is the effect of a fore wing on an aft tailplane or fin. Thus, the pitching moment perturbation in Eq. (20) can be expanded in terms of perturbation vari-ables by means of a Taylor series,
neglecting higher order terms, where 𝜕M∕𝜕𝛼 and 𝜕M∕𝜕q are known as the stability derivatives evaluated at the reference flight condition. Setting up the classical notation,
the pitching moment perturbation in Eq. (20) becomes
In the model, the vertical displacement of the dart cen-tre of gravity is considered small, effectively constrained to a level reference flight condition. Therefore, the pitch angle 𝜃 and angle of attack 𝛼 are the same, the pitch rate
q is the same as angular velocity ̇𝜃 and the equation of motion can be written in terms of either 𝜃 or 𝛼 ; thus
which is analogous to the classical mass-spring-damper equation and can be expressed in terms of damping ratio ζ
and undamped natural frequency ωn,
where
and damped natural frequency given by,
(20) ΔM =IyΔ𝜃.̈
(21) ΔM =f(𝛼, ̇𝛼,q),
(22) ΔM = 𝜕M
𝜕𝛼Δ𝛼+ 𝜕M
𝜕qΔq,
(23)
M𝛼= 𝜕M
𝜕𝛼 /
Iy,
(24) Mq= 𝜕M
𝜕q
/
Iy,
(25) Δ𝜃̈− M𝛼Δ𝛼−MqΔq=0.
(26)
Δ𝛼̈ −MqΔ̇𝛼−M𝛼Δ𝛼=0,
(27) Δ𝛼̈ +2𝜁 𝜔nΔ̇𝛼+𝜔
2 nΔ𝛼=0,
(28)
𝜔n=
√ −M𝛼,
(29) 𝜁= − Mq
2√−M𝛼,
(30)
The dynamic stability derivatives describe the change in pitching moment with respect to both angle of attack and pitch rate, defined by considering the change in aero-dynamic lift on a planar fin pair at a moment arm distance
xsm away from the cg. Pitching moment as a function of 𝛼
can be written,
where 𝛼 is in radians, 𝜌 air density and Vo is the forward
velocity reference value; the negative sign designates an aerodynamically stable body. The 𝛼 stability derivative is the first derivative of (31) substituted into (23);
A small change in angle of attack can be defined using the ratio of perpendicular velocity components,
Similarly, substituting (33) into (31), pitching moment as a function of pitch rate is,
and the q stability derivative from (34) and (24),
2.2.6 Velocity independence
It can be shown that the wavelength of the angle of attack oscillation for a throwing dart,
is independent of velocity Vo. First, by substituting (32) and (35) into (29), it can be shown that the damping ratio ζ is also independent of velocity,
Then by substituting (28), (32) and (37) into (31),
where the radius of rotation rrot is,
(31) M(𝛼) = −xsm
1 2𝜌V
2 oSCN𝛼𝛼,
(32)
M𝛼= −xsm 1 2𝜌V
2 oSCN𝛼
/
Iy.
(33) tan𝛼≈𝛼≈ qxsm
Vo .
(34)
M(q) = −xsm1
2𝜌V
2
oSCN𝛼
qxsm
Vo ,
(35) Mq= −x2sm1
2𝜌VoSCN𝛼 /
Iy.
(36) 𝜆= 2𝜋Vo
𝜔 ,
(37) 𝜁=
√ x3
sm𝜌SCN𝛼
8Iy ,
(38) 𝜔= Vo
rrot,
(39) rrot=1
/ √
xsm𝜌SCN𝛼
2Iy (
1− x
3 sm𝜌SCN𝛼
8Iy )
,
grouping together all terms that are independent of time t. Therefore, when (38) is substituted into (36), the velocity independent form of the wavelength is given by,
3 Results and discussion
3.1 Experimental observations
Figure 5 shows histograms of the darts’ dynamic conditions at release. These conditions are the darts’ launch velocity (magnitude and angle), the darts’ initial pitch angle, and the darts’ initial angular velocity (rate of change of pitch angle or pitch rate). The plots present data from 225 ana-lysed throws and show the range of dynamic conditions achieved by amateur players. Implementing a Shapiro Wilk test for normality showed all the distributions to be nor-mal apart from the distribution for launch speed which is evidently skewed. The median value for launch speed was 6.0 ms−1; the median value for launch flight path angle was
16.5° above the horizontal; the median initial pitch was 19.4° above the horizontal; and the median initial angular velocity was − 412 deg.s−1 (a forward’s nose down rotation
reducing the pitch angle).
Figure 6 shows the dominant relationship within the ini-tial launch conditions. There is a strong negative correla-tion between the darts’ launch speed and launch flight path angle (r2 = − 0.50, p < 0.001). This is presumably because
fast throws require a relatively flat trajectory to maintain dart height, whilst slower throws need to be directed on a steeper parabolic trajectory. This relationship supports his-torical descriptions of the effect of the move towards thinner and faster tungsten darts in the 1970s whereby players could achieve flatter trajectories [1].
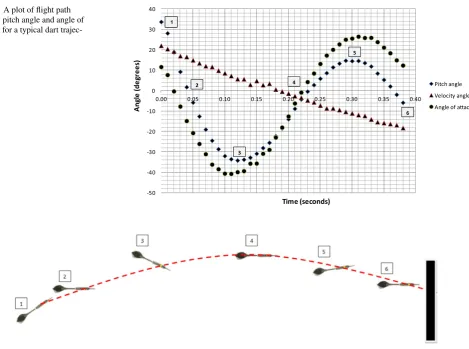
In addition to the initial launch conditions, full dynamic measures of the entire trajectory were determined for each throw at a frequency of 100 Hz. Figure 7 shows the flight path angle, pitch, and angle of attack throughout a typical trajectory. Six stages of the flight are identified on the plot and these stages are also represented in a schematic of the trajectory in Fig. 8.
The conditions at six stages of a typical trajectory identi-fied in Figs. 7 and 8 are described below:
1. The dart is released with a positive pitch and a nega-tive angular velocity (nose down rotation). Because the pitch angle does not match the flight path angle (angle of attack is not zero), the fins on the rear of the dart create aerodynamic forces that produce a pitching moment, and angular deceleration.
momentum. The angle of attack now becomes negative and the resulting aerodynamic forces produce a positive (nose up) angular acceleration.
3. The positive angular acceleration slows the negative angular velocity of the dart and initiates positive angular velocity.
4. The dart’s pitch angle, flight path angle and angle of attack all reduce to approximately zero as the dart reaches the zenith of its trajectory.
5. The dart’s angular momentum maintains its positive angular velocity as it begins the trajectory descent. This creates a positive angle of attack that induces a nega-tive angular acceleration and slows the posinega-tive angular velocity to zero once again.
6. As the dart approaches the scoring bed, its angle of attack remains positive and this maintains the nega-tive angular acceleration that builds a neganega-tive angular velocity. Ultimately, the dart lands in the scoring bed with a small negative pitch angle that will cause a visual obstruction and, therefore, make the stacking technique difficult.
Similar behaviour was found throughout the majority of the data set of participant throws. It is evident that during its trajectory, the dart’s orientation undergoes an oscillating behaviour that is analogous to damped harmonic motion. Both the dart’s pitch angle and angle of attack oscillate with reducing amplitude as the flight progresses.
It was possible to analyse the dart’s oscillating behav-iour for 194 throwing trials. 31 trails were excluded due to irregular behaviour such as not exhibiting two identifiable
0 5 10 15 20 25 30 35 40
Coun
t
Inial velocity magnitude (m/s)
0 10 20 30 40 50 60
7.5 10.012.515.017.520.022.525.027.530.0
Co
un
t
Inial velocity angle (degrees)
0 5 10 15 20 25 30 35 40
Coun
t
Inial angular velocity (deg/s)
0 5 10 15 20 25 30 35 40
-10 -5 0 5 10 15 20 25 30 35 40 45 50 55
Count
Inial pitch (degrees)
Fig. 5 Histograms of the darts’ dynamic conditions at release (N = 225)
R² = 0.50 5
10 15 20 25 30
4 5 6 7 8 9
La
unc
h
an
gl
e
(d
eg
rees
)
Launch speed (m/s)
[image:9.595.86.284.54.357.2] [image:9.595.57.282.408.580.2]oscillation peaks. For each trajectory, measures such as the first peak amplitude, second peak amplitude, frequency, wavelength and coefficient of the oscillation were deter-mined for both pitch angle and angle of attack.
3.2 Theoretical results
3.2.1 Geometry and inertial properties
Table 1 specifies the axisymmetric sections representative of the dart geometry used in the experimental throwing tri-als from pointed nose to stem, the flight is included, but the
lateral dimension refers to the span b, as illustrated in Fig. 4. For each section of the dart, diameter and axial length were measured, mass was calculated proportionally from com-bined barrel plus needle and stem plus flight mass measure-ments, and centre of mass and moment of inertia were cal-culated based on theoretical volume and mass distribution, respectively, as defined in Fig. 4. Contributions of sectional moment of inertia were translated to a common centre of gravity using the parallel axis theorem.
Relevant parameters not stated in Table 1 are outlined as follows. Fin taper ratio λc is 0.44 and the planar wing surface area S, based on two fins, is 15.55 cm2. Mass of
Fig. 7 A plot of flight path angle, pitch angle and angle of attack for a typical dart trajec-tory
-50 -40 -30 -20 -10 0 10 20 30 40
0.00 0.05 0.10 0.15 0.20 0.25 0.30 0.35 0.40
An
gl
e
(d
eg
rees
)
Time (seconds)
Pitch angle Velocity angle Angle of aack
2
3
4
5
6
1
Fig. 8 A schematic showing the orientation of a dart during a typical trajectory
Table 1 Simplified dart geometry and static mechanical properties, defined by section with reference to stated datum:
ϕi nose diameter, hi axial length,
mi mass, x
i mass centre, Iyi
moment of inertia
Datum Units Needle Barrel: nose Barrel: body Stem Flight Total
ϕi – mm 0 3.8 7.1 4.9 42.9 (span) –
hi – mm 24.5 6.1 51.3 27.1 50.3 (root) 159.3
mi – g 1.4 2.1 21.4 0.6 1.2 26.7
xi 0 mm 18.4 28.1 53.1 95.5 136.3 –
I
yi
x
i g mm2 31.2 10.6 4581.6 36.1 239.3 –
I
yi ( × 10
−6) x
[image:10.595.71.541.222.571.2] [image:10.595.175.548.620.716.2]barrel, including needle, is 24.9 g and stem and flight together 1.8 g. The measured barrel mass and theoretical barrel geometry volume (including needle) determined specific gravities of 14.60 and 1.15 g/cm3 for barrel and
stem, respectively. The centre of gravity of each section is listed in Table 1 with reference to the needle point datum, see Fig. 4. To accurately compare the theoretical oscilla-tory rotation to the high-speed video data, the experimen-tally measured centre of gravity was used for the model predictions ( xcg of 48.5 mm). The centre of gravity was
determined by balancing the dart on a vertical knife edge. The theoretically calculated dart centre of gravity position was more than 10% further from the datum than the meas-ured value, likely due to unknown material composition and theoretical geometry model approximations.
3.2.2 Static and dynamic stability properties
Mean aerodynamic chord cMAC, from (10), is 38.1 mm and aerodynamic centre position, assumed at quarter chord
cMAC/4, located at 126.5 mm relative to the datum, from (11). The planar wing lift curve slope, from (13) and (14), correcting for aspect ratio AR, 1.18, and sweep angle Λc∕4 , 27.9°, yields F and CN
𝛼 of 1.34 m
2 and 1.69 per radian,
respectively. The static margin xsm is 78.0 mm from (16); in the absence of a lifting wing xsm/ϕL is 11.0, normalised by (maximum) body diameter and pitching moment slope is − 3.5 per radian from (15).
Stability derivatives Mα and Mq for a typical dart throw,
from (32) and (35), with release velocity Vo 6 m/s, the median value from the experimental data, are − 249.1 s−2
and − 3.24 s−1, respectively. The undamped natural
frequency and damping ratio, from (37) and (38), are 15.8 rad/s and 0.10. The damped frequency, from (30), is an angular rate of 15.7 rad/s, equivalent to 2.50 Hz. The velocity independent wavelength, from (40), is 2.38 m, where the frequency-velocity curve slope is 1/rrot and radius of rotation rrot is 0.38 m, from (39).
3.3 Comparison of experimental observations to theoretical predictions
The dynamic flight stability model does not facilitate simulations of the full dart trajectory, but it does allow for predictions of the dart’s oscillating behaviour. Based solely on the dart geometry, and predicted dart inertial properties; the model provides theoretical predictions for the angle of attack oscillation with regards to wavelength, frequency and damping ratio.
3.3.1 Wavelength
Figure 9 shows a plot of launch speed and wavelength of angle of attack oscillation for both experimentally observed data, and theoretical predictions. The observed wavelength of the dart’s oscillating angle of attack was found to be independent of the launch speed. Similarly, the theoretical wavelength (40) was independent of launch speed at a con-stant 2.38 m. This compares well to the mean experimentally observed wavelength of 2.16 ± 0.35 m.
Interestingly, both the observed and predicted mean wavelengths are similar in length to the regulation throw-ing distance of 2.37 m; however, the regulation throwthrow-ing distance only relates to the location of a player’s front foot, and typically, the dart will be released closer to the scoring bed due to the player’s forearm-hand extension and forward lean. The mean experimentally observed horizonal distance from the point of dart release to the scoring bed was deter-mined to be 2.07 m (n = 225). Therefore, on average, the dart undergoes 1.04 oscillations before striking the scoring bed. The implication here is that the dart is ‘tuned’ to the throwing distance. The median initial pitch angle at the point of release was 19.4° above the horizontal, and thus after 1.04 oscillations, the dart will typically impact the scoring bed with a small positive pitch angle (the needle of the dart pointing upwards). If one were to attempt to throw a dart from a closer or further distance, the dart will impact the scoring bed with a larger pitch angle and may be more prone to bounce off the surface. This effect is commonly seen in practice.
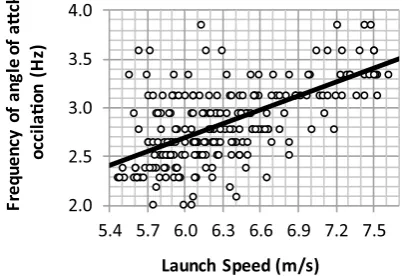
3.3.2 Frequency
Figure 10 shows a plot of launch speed and frequency of angle of attack oscillation for both experimentally observed
0.0 1.0 2.0 3.0 4.0 5.0
5.4 5.7 6.0 6.3 6.6 6.9 7.2 7.5
Wa
ve
le
ng
th
(m
)
Launch Speed (m/s)
Model Experimental data
[image:11.595.310.539.55.229.2]data, and theoretical predictions. The dynamic stability model shows generally good agreement with the experi-mentally observed data. The dart’s launch speed and the frequency of its oscillating angle of attack are strongly related (p < 0.001). This relationship was to be expected since higher launch speeds create larger angular accelera-tions due to the larger aerodynamic forces acting at the cen-tre of pressure. This relationship is key to explaining why the dart’s characteristic wavelength remains constant. A dart thrown fast will oscillate quickly to return itself to its origi-nal orientation after a specific range, whilst a dart thrown less fast will oscillate slowly and return itself to its original orientation at approximately the same range.
3.3.3 Damping ratio
Figure 11 shows a plot of launch speed and damping ratio of angle of attack oscillation for both experimentally observed data, and theoretical predictions. The observed damping
ratio of the dart’s oscillating angle of attack was found to be independent of the launch speed. Similarly, the dynamic stability model predicts that damping ratio is independent of launch speed and was constant at 0.10. This compares well to the mean experimentally observed damping ratio of 0.11 ± 0.05.
3.3.4 Implications
A dynamic stability analysis of the dart flight has shown that the frequency of oscillation is linearly dependent on release speed and that the damping ratio and wavelength are inde-pendent of release speed. This is confirmed by experimental observations of dart trajectories via high-speed video track-ing. The theoretical predictions show good agreement with the experimental observations and indicate that the mod-elling approach can appropriately simulate the oscillation dynamics of the physical system.
The validated dynamic stability analysis shows that the dart oscillation dynamics are driven by the aerodynamic moment arm of the fin, and are dependent upon fin area and static margin. The frequency and damping of the oscilla-tion is strongly dependent on moment of inertia, and this is dominated by the overall mass and mass distribution of the barrel. Future work should use the dynamic stability model to perform a parametric sensitivity analysis to investigate the effect of dart design on it’s trajectory.
Like many sports, the winning margin in darts can be very small. Commentators have suggested that the pitch angle of the dart when it impacts the scoring bed is of criti-cal importance due to the assumed advantages of the ‘stack-ing technique’ [7–9]. It is, therefore, conceivable that an ideal characteristic wavelength can be determined in relation to the player’s individual throw dynamics, and the desired final pitch angle. The design of the dart could be individu-ally optimised to achieve this ideal characteristic wavelength using the aforementioned parametric sensitivity analysis.
The experimental observations are derived from a wide range of release conditions and it was assumed that all trajectories occur within the sagittal plane. Experimental observations were recorded two-dimensional trajectory data only thus introducing potential measurement uncertainty. The effect of gyroscopic stabilisation is unobtainable from the experimental data, although it is known that the dart will generally precess around the flightpath rather than oscillate in plane. Furthermore, the analytical model assumes small pitch angular rotations (≪ 1°) about a horizontal flight condi-tion; however, the trajectory is typically parabolic with much larger angle of attack amplitudes (~ 45°) in flight. Nonethe-less, the dynamic stability analysis yields close agreement to the experimental observations. Improved confidence in the aerodynamic inputs driving the dynamic stability analysis
2.0 2.5 3.0 3.5 4.0
5.4 5.7 6.0 6.3 6.6 6.9 7.2 7.5
Fr
eque
nc
y
of
a
ng
le
o
f a
ck
oc
cilao
n
(H
z)
Launch Speed (m/s)
Fig. 10 Experimental and modelled data for launch speed vs. fre-quency of angle of attack oscillation (Hz)
0.0 0.1 0.2 0.3 0.4 0.5
5.4 5.7 6.0 6.3 6.6 6.9 7.2 7.5
Da
mp
in
g
ra
o
Launch Speed (m/s)
[image:12.595.69.272.65.205.2] [image:12.595.67.271.271.423.2]could be achieved through a parametric study in fin surface area and body section geometry via wind tunnel test.
4 Conclusions
This study has provided a detailed experimental and theo-retical description on the flight of a dart including its oscil-lating behaviour during flight.
Experimental observations showed the amplitudes of the pitch angle and angle of attack oscillations to be strongly correlated to initial angular velocity in a manner that is anal-ogous to damped harmonic motion. It was also found that the darts’ oscillation frequency was strongly correlated to launch speed, whilst its characteristic wavelength was independent and apparently ‘tuned’ to the throwing distance such that the dart undergoes one full oscillation before striking the board.
A dynamic stability model was developed and validated against the experimental observations. The model shows that the dart oscillation dynamics are driven by the aerodynamic moment arm of the fin, and are dependent upon fin area and static margin. The frequency and damping of the oscilla-tion is strongly dependent on moment of inertia, and this is dominated by the overall mass and mass distribution of the barrel. Future work should use the dynamic stability model to perform a parametric sensitivity analysis to investigate the effect of dart design on its trajectory, and to explore the possibility of design optimisation for individual throw dynamics.
Acknowledgements This research received no specific grant from any funding agency in the public, commercial, or not-for-profit sectors. Thanks are given to Mr Stephan Adams and Mr Michael Pecora for their help in data collection and analysis.
Open Access This article is distributed under the terms of the Crea-tive Commons Attribution 4.0 International License (http://creat iveco mmons .org/licen ses/by/4.0/), which permits unrestricted use, distribu-tion, and reproduction in any medium, provided you give appropriate credit to the original author(s) and the source, provide a link to the Creative Commons license, and indicate if changes were made.
References
1. Taylor P, Waddell S (2004) The power: my autobiography. Harp-erCollins, London
2. Smeets JBJ, Frens MA, Brenner E (2002) Throwing darts: timing is not the limiting factor. Exp Brain Res 144:268–274
3. Cooke AJ (1999) Shuttlecock aerodynamics. Sport Eng 2:85–96 4. Chan CM, Rossmann JS (2012) Badminton shuttlecock aerody-namics: synthesizing experiment and theory. Sport Eng 15:61–71 5. Park JL (2011) Arrow behaviour in free flight. Proc Inst Mech Eng
Part P J Sport Eng Technol 225:241–252
6. Zanevskyy I (2001) Lateral deflection of archery arrows. Sport Eng 380:23–42
7. Why Taylor’s darts behave differently. http://image .guard ian. co.uk/sys-files /Guard ian/docum ents/2007/12/14/Sport Darts .pdf. Accessed 17 June 2018
8. Phil Taylor suffers Power Failure against Michael van Gerwen. http://www.theoc he.com/test-name-122/. Accessed 17 June 2018 9. Phil “The Power” Taylor, Sid Waddell, the World Darts Champi-onship. http://www.teleg raph.co.uk/sport /other sport s/darts /68272 35/Phil-The-Power -Taylo r-Sid-Wadde ll-the-World -Darts -Champ ionsh ip-it-must-be-Chris tmas.html. Accessed 17 June 2018 10. Burke DJ, Yeadon MR (2009) A comparison of compensation
for release timing and maximum hand speed in recreational and competitive darts players. 27th International Conference on Bio-mechanics in Sports, Limerick, pp 1–4
11. Lowe J (2009) The art of darts: a masterclass with three-times world darts champion. Hodder & Stoughton, London
12. Edwards B, Waterhouse J, Atkinson G, Reilly T (2007) Effects of time of day and distance upon accuracy and consistency of throwing darts. J Sports Sci 25:1531–1538
13. Darts regulation authority rule book. http://www.thedr a.co.uk/ custo m-1/DRARu lesBo ok.pdf. Accessed 17 June 2018 14. World Darts Federation playing and tournament rules. http://www.
darts wdf.com/rules -and-regul ation s/. Accessed 17 June 2018 15. Silvester J (2003) Complete book of throws. Human Kinetics,
Leeds
16. Nelson RC (1998) Flight stability and automatic control. McGraw-Hill Education, New York
17. Barrowman JS, Barrowman JA (1966) The theoretical prediction of the centre of pressure. Technical report for NARAM-8 18. Anderson JD (1984) Fundamentals of aerodynamics, 3rd edn.
McGraw-Hill Education, New York