ISSUE 2 – SEPTEMBER 2006
01 MAP OF SOUTH WEST ENGLAND
02 INTRODUCTION
03 REGIONAL ECONOMIC SUMMARY
04 OBJECTIVE 1 SUCCESSFUL AND COMPETITIVE BUSINESSES
05 PRIORITY 1A SUPPORT BUSINESS PRODUCTIVITY
07 PRIORITY 1B ENCOURAGE NEW ENTERPRISE
09 PRIORITY 1C DELIVER SKILLS FOR THE ECONOMY
11 PRIORITY 1D COMPETE IN THE GLOBAL ECONOMY
13 PRIORITY 1E PROMOTE INNOVATION
15 OBJECTIVE 2 STRONG AND INCLUSIVE COMMUNITIES 16 PRIORITY 2A IMPROVE PARTICIPATION IN THE ECONOMY
18 PRIORITY 2B REGENERATE THE MOST DISADVANTAGED AREAS
20 PRIORITY 2C PLAN SUSTAINABLE AND SUCCESSFUL COMMUNITIES
22 OBJECTIVE 3 AN EFFECTIVE AND CONFIDENT REGION
23 PRIORITY 3A IMPROVE TRANSPORT NETWORKS
25 PRIORITY 3B PROMOTE AND ENHANCE WHAT IS BEST ABOUT THE REGION
27 PRIORITY 3C IMPROVE LEADERSHIP, INFLUENCE AND PARTNERSHIP
28 ABBREVIATIONS
MAP OF SOUTH WEST ENGLAND
Penwith Kerrier Carrick
Restormel
Caradon North Cornwall Isles of Scilly
Torridge
Mid Devon
East Devon North
Devon
Taunton Deane
West Devon
Teignbridge
South Hams
West Somerset
Mendip
South Somerset
West Dorset
North Dorset
North Wiltshire
Kennet
East Dorset
Purbeck
Torbay UA Bath and North East Somerset UA
Poole UA
Weymouth & Portland
Swindon UA
Plymouth UA
Salisbury Cotswold Forest of Dean
Stroud
North Somerset UA City of Bristol UA South Gloucestershire UA
Exeter Sedgemoor
Bournemouth UA Christchurch West Wiltshire Tewkesbury
INTRODUCTION
THIS ‘PROFILE’ AIMS TO PROVIDE A SUCCINCT ANALYSIS OF
SOUTH WEST ENGLAND’S ECONOMY IN A WAY THAT CAN BE
RELATED TO THE OBJECTIVES AND PRIORITIES SET OUT IN THE
SOUTH WEST REGIONAL ECONOMIC STRATEGY (RES). IT IS
WRITTEN TO INFORM ALL SOUTH WEST ENGLAND PARTNERS
WORKING FOR THE DEVELOPMENT OF THE REGIONAL ECONOMY.
The ‘Profile’ is produced by the Business and Economy Module of the Regional Observatory with the Economics and Evidence team at the South West of England Regional Development Agency (RDA). The analysis should not be interpreted, however, as necessarily stating the views, or any other policy or commitment by the Agency.
SOUTH WEST ENGLAND REGIONAL ECONOMIC PROFILE – 2ND EDITION This is the second edition of the ‘Profile’. Building on the first, which was largely a regional overview, it provides analysis at a sub-regional level.
It measures the success of South West England’s economic performance against the three objectives and eleven priorities of the RES.
This edition provides commentary at the most appropriate level for the available data. It uses a variety of geographies including Nomenclature of Territorial Units for Statistics (NUTS) level 1, 2 and 3, local authority and Learning and Skills Council (LSC) boundaries.
The aims of the Profile are
• To celebrate South West England’s economic successes
• To benchmark South West England and its sub-regions against the three objectives and eleven priorities of the RES
• To monitor and analyse trends over time
• To identify areas where evidence is sparse and lacking
DAMIAN WHITTARD
Economist, Business and Economy Module, South West Regional Observatory
ALLISON McCAIG
South West of England Regional Development Agency
REGIONAL ECONOMIC SUMMARY
South West England benefited from the UK and global economic upturn in the first half of 2006. For example, second quarter regional trade statistics showed South West goods exports to be 29.4% higher than a year earlier. Moreover, the Labour Force Survey (ONS) for April to June showed South West employment and unemployment rates to be respectively the second highest in the United Kingdom (78.5% versus a national average of 74.6%), and the lowest (3.8% compared with 5.5% nationally). A sub-regional breakdown for the claimant count measure of unemployment reveals how recorded unemployment is concentrated in some of South West England’s urban centres but that the region generally performs better than the national average.
The latest summary of business conditions from the Bank of England’s regional agents talked of a pick up in retail sales, better housing activity and accelerated exports growth. Financial and business services continued to grow strongly, employment intentions recovered without evidence of general wage pressures and investment intentions flattened out.
The Chamber of Commerce’s latest quarterly survey was less bullish, although it did show South West England to be better than most. South West investment and confidence levels improved and were above the national averages for both
manufacturers and services companies. Similarly, recent CBI surveys have said that businesses are fairly upbeat at the moment, especially about export orders.
Sub-regionally, there has been more anecdotal evidence of the vulnerability of traditional industries in the far south west, contrasting with the relative vibrancy of the north and east. There have been positive developments across the region but, with redundancy figures creeping up, the bugbears of planning restrictions, transport deficiencies and policy discrepancies continue to be voiced often by businesses, particularly with respect to rural and SME development.
Energy cost increases are putting pressure on a wide range of South West
businesses. Immigrant labour has had an offsetting impact in some sectors but the overall squeeze between higher costs and intense competition on final prices may affect business investment. Add in the effect of repairing pension plans and the region’s historical problems with under-investment are not being helped.
We expect South West businesses to continue to perform relatively well but trading conditions are unlikely to get easy soon, especially if higher interest rates and higher input costs are faced this winter.
NIGEL F JUMP
Chief Economist, South West of England Regional Development Agency
OBJECTIVE 1
SUCCESSFUL
AND
COMPETITIVE
BUSINESSES
Total economic output, measured by Gross Value Added (GVA), in South West England was over £78 billion in 2004 and will have exceeded £80 billion in 2005, ranking it sixth largest (of twelve) amongst the UK’s regional economies.
At present, sub-regional GVA data is only available to 2003. In that year, 54% of total regional output was produced in the NUTS 2 region of Gloucestershire, Wiltshire and North Somerset (GWNS). This sub-region had the fourth highest productivity rate1of England’s thirty NUTS 2 areas.
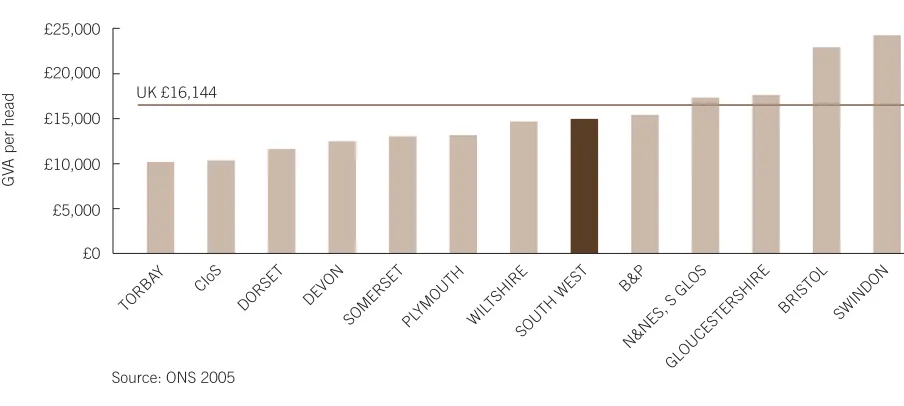
Figure 1.1 describes the average productivity rates of the NUTS 3 sub-regions of South West England2. The region tends to be most productive in the north and east, and productivity decreases towards the south and west. Swindon, Bristol,
Gloucestershire, North and North East Somerset (N&NES), and South
Gloucestershire (S GLOS) all out performed the UK average; whereas Bournemouth and Poole (B&P) were below the UK average level but above the average for South West England. At the other end of the scale, Torbay achieved only 63% of the UK average productivity rate. Cornwall and the Isles of Scilly (CIoS) also performed comparatively poorly (64%). Rural Devon and Dorset were also relatively low.
£0 £5,000 £10,000 £15,000 £20,000 £25,000
TORBA Y
CIoS
DORSET DEVO N
SOMERSET PLYMOUTH WIL TSHIRE
SOUTH WEST B&P
N&NES, S GLOS GLOUCESTER
SHIRE BRISTO
L
SWINDO N
Source: ONS 2005
UK £16,144
FIGURE 1.1 AVERAGE PRODUCTIVITY RATES (2003)
PRIORITY 1A
SUPPORT BUSINESS PRODUCTIVITY
GV
A per head
KEY FACT: FASTEST PRODUCTIVITY GROWTH IN THE NORTHERN AND SOUTHERN EDGES OF
SOUTH WEST ENGLAND
1.Productivity rate measured by GVA per head of population. 2.
[image:7.595.87.539.509.712.2]Currently unpublished research3estimates that businesses located in Cornwall and the Isles of Scilly and Devon are 28% and 25% less productive than those in Bristol, which is explained by differences in capital stock, ratio of full to part time
employment, industrial structure, qualifications, population density and travel time.
Figure 1.2 describes both short term and medium term sub-regional real4
productivity growth rates. Gloucestershire has been the most successful sub-region in both the short term and medium term, reflecting strong growth in output coupled with limited labour supply growth.
0.0
-1.0 1.0 2.0 3.0 4.0
5.0
TORBA Y
SWINDON SOMERSET DOR SET
DEVON PLYMOUTH
B&P
WIL TSHIRE
SOUTH WEST BRISTOL
N&NES, S GLOS CIoS
GLOUCESTER SHIRE
Source: ONS 2005
2002-2003 1999-2003 UK 1999-2003
FIGURE 1.2 REAL PRODUCTIVITY GROWTH RATES (2003)
Real growth rate (% per annum)
Between 1999 and 2003, real productivity rates grew strongly in Cornwall and the Isles of Scilly (4% per annum). This improved performance reflected substantial public sector investment, thanks to Objective One status and South West RDA investment. The Combined Universities in Cornwall is an example of where the Agency and its partners have invested to support long term economic structural change.
Torbay was the only part of the region to experience negative growth rates in real productivity from 1999-2003, consequently, it moved to the bottom of the productivity rankings in 2003 and is amongst the poorest regions in the United Kingdom. A key cause of this negative growth was the loss of manufacturing capacity and output.
Swindon has been a major engine of growth for the South West region but more recently has found progress difficult, suffering real negative productivity growth from 2000-2001; partly due to global pressures on the technology sector after the dot com ‘boom and bust’. Overall, Swindon had the second lowest productivity growth rates of any South West sub-region (0.3% pa) for the period 1999-2003 although, in absolute terms, its relative performance remains very strong.
3.Meeting the productivity challenge 2: update (2006). 4.
[image:8.595.88.540.284.482.2]PRIORITY 1B
ENCOURAGE NEW ENTERPRISE
South West England was home to approximately 171,000 businesses in 2004. During this period, nationally and regionally, business stocks generally stagnated, reflecting low levels of business confidence5. Just over 15,000 South West England new businesses were created in 20046. There was a similar amount of business closures and, therefore, the overall increase of business stock was just 0.2%. Although low, this was slightly better than the country as a whole (0.1%).
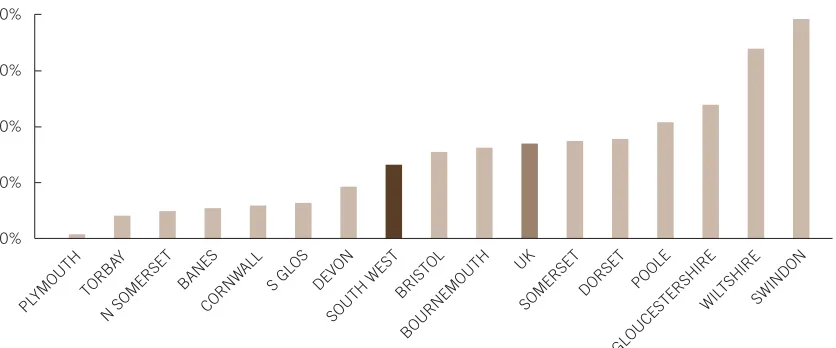
Figure 2.1 illustrates the number of company VAT registrations and deregistrations by county/unitary authority area, as a percentage of business stock at the end of 2004. Amongst the sub-regions, Plymouth, Swindon and Bournemouth benefited from the highest rate of business start ups and each sub-region experienced positive growth in its business stock. Indeed, Swindon benefited from the greatest increase of business stock of all South West sub-regions (1.4%). Bristol (1.1%) and North (N) Somerset (0.9%) also experienced substantial increases in business stock but this was largely due to relatively low levels of business de-registrations. This low ‘churn’ rate
sometimes warns of a sub-regional economy unexposed to competitive forces. This is not the case, however, for the Bristol area.
KEY FACT: PLYMOUTH LEADS THE WAY, AS URBAN AREAS BENEFIT FROM HIGHEST RATES OF BUSINESS REGISTRATION 8% 6% 10% 12% 14%
DEVON CIoS DORSET BAN ES SOMERSETWIL TSH IRE SOUTH WEST S GLOS N SOMERSET GLOUCESTERSHIRE TORBA Y POOLE BRI STOL BOURNEMOUT H
SWINDONPLYMOUTH
Source: Small Business Services 2005
Registrations as % stock Deregistrations as % stock UK Registrations UK Deregistrations
FIGURE 2.1 BUSINESS VAT REGISTRATIONS AND DE-REGISTRATIONS AS A PERCENTAGE OF BUSINESS STOCK (2004)
5.As reported in SME Trends Survey CBI October 2004. 6.
As measured by businesses registered for VAT. The true figure is well in advance of this figure as businesses under the VAT threshold are not included. The South West is likely to have a proportionately higher number of companies that come into this category due to its high propensity towards micro businesses.
[image:9.595.122.540.449.632.2]Size of business can reflect successful entrepreneurship; businesses grow as a result of being competitive. For larger companies, productivity is further advanced by the exploitation of ‘economies of scale’. Therefore, higher proportions of larger
businesses are generally a sign of greater benefit to an economy’s value added, although small, young businesses can be relatively more flexible. Figure 2.1 describes the size of industry within the sub-regions.
South West England has a relatively higher proportion of micro and small and medium sized enterprises (SMEs)8
compared with the UK average. Intra-regionally, the principal urban areas in South West England have comparatively low levels of micro businesses and SMEs compared with the more rural counties. This reflects the difference in the factors of production affecting the industrial make up of these sub-regions. Urban areas benefit from a relative abundance of labour and access to capital. In turn, this fuels growth in the larger scale employment industries, such as business services, wholesale and retail, and public sector. Some rural counties suffer from ‘peripherality,’ which negatively impacts on access to labour and capital but provides them with land based advantages. As such, they have a larger proportion of typically land based and industries with small businesses such as agriculture and tourism. Poole recorded the highest share of businesses with 250 or more employees (1%) whilst Cornwall and the Isles of Scilly reported the smallest share (0.3%).
REGION 1-9 10-19 20-49 50-249 250+
Bristol 86.1 7.2 4.1 1.2 0.8
Plymouth 86.1 7.6 4.1 1.1 0.6
Swindon 86.5 6.4 3.6 1.5 0.9
Poole 87.5 6.6 3.2 1.2 1.0
Bournemouth 88.7 5.9 3.2 1.1 0.7
Torbay 88.9 6.3 3.1 0.9 0.7
BANES 89.1 5.8 3.2 1.0 0.5
Gloucestershire 89.1 5.8 3.2 1.0 0.5
S Glos 89.7 5.7 2.8 1.0 0.5
N Somerset 89.8 5.9 2.7 0.8 0.4
Dorset 89.9 5.7 3.0 0.8 0.4
CIoS 90.1 5.6 2.9 0.8 0.3
Wiltshire 90.1 5.4 2.9 0.7 0.5
Somerset 90.4 5.4 2.8 0.7 0.5
Devon 91.0 5.1 2.6 0.7 0.4
South West 89.5 5.7 3.0 0.9 0.5
[image:10.595.141.547.217.533.2]UK 88.4 6.1 3.4 1.0 0.6
TABLE 2.1 PERCENTAGE OF ENTERPRISES BY EMPLOYEE SIZE BAND (2005)7
Source: ONS 2005
7.
Percentages do not add up to 100% as they do not include the percentage for owner only businesses.
8.
PRIORITY 1C
DELIVER SKILLS FOR THE ECONOMY
Comparatively low educational attainment and skills levels are often cited as one of the principal reasons for the productivity gap between the United Kingdom and other leading economies. Internationally, the United Kingdom comes 25th out of 29
industrial countries for the percentage of 17 year olds in full time education and training. “Meeting the Productivity Challenge” (2005) reported that increasing high level skills by 10% could reduce South West England’s productivity gap with London by 0.7%. Figure 3.1 describes relative national, regional and sub-regional education rates.
KEY FACT: BATH AND NORTH EAST SOMERSET (BANES), BRISTOL AND SOUTH
GLOUCESTERSHIRE HAVE THE HIGHEST QUALIFIED SUB-REGIONAL WORKFORCE (NVQ3+)
0% 20% 40% 60%
80% 100%
PLYMOUTH TORBA Y
POOLE CIoSDORSET SOMERSET
DEVO N
SWINDON
BOURNEMOUTH UK
SOUTH WESTN SOMERSET
GLOUCESTERSHIRE S GLOS
WILTSHIREBRISTOL BANES
Source: Annual Population Survey, ONS 2006
NVQ 4+ NVQ 3 NVQ 2 NVQ 1 Trade apprenticeships Other qualifications No qualifications
FIGURE 3.1 EDUCATION RATES (2004)
In a national context, South West England has a comparatively high share of its adult population with qualifications at NVQ level 3 and 4+. The region also has a relatively low share of its population without qualification or with highest qualification at level 1.
[image:11.595.119.550.334.547.2]Although South West England has a comparatively well qualified workforce, the continued existence of the productivity gap infers a mismatch between individuals’ abilities and jobs undertaken within the economy. There are also mismatches at particular levels and places between employer demand and available supply. For example, whilst Bristol has high skills levels in its overall population, businesses complain of deficiencies at the lower end, particularly with the output from the state schools. Optimising skilled labour for the economy is not only about formal
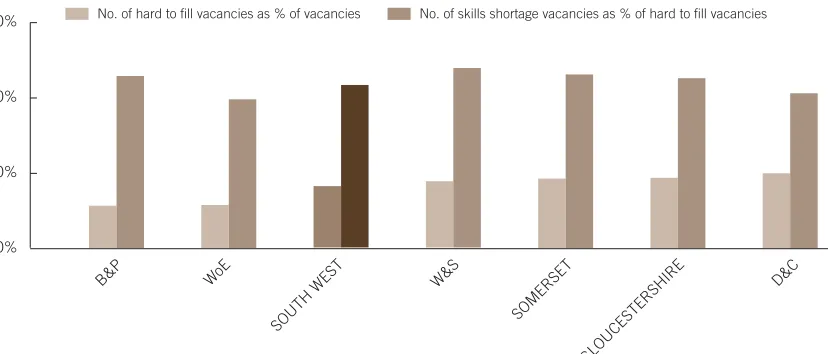
qualifications. It is also about matching skills for the job with job opportunities. Figure 3.2 attempts to capture an element of this by recording sub-regions’ hard to fill and skills shortages vacancies in 2005.
20% 40% 60%
80%
B&P WoE
SOUTH WEST
W&S
SOM ERSET
GLOUCES TERSHIRE
D&C
Source: National Employers Skills Survey, Learningand Skills Council 2006
No. of hard to fill vacancies as % of vacancies No. of skills shortage vacancies as % of hard to fill vacancies
FIGURE 3.2 HARD TO FILL VACANCIES (2005)
The National Employers Skills Survey 2005 reveals that within South West England Bournemouth, Dorset and Poole (BD&P) recorded the lowest level of hard to fill vacancies (31.4%), with Devon and Cornwall (D&C) recording the highest (40%). Of Bournemouth, Dorset and Poole’s hard to fill vacancies, 65.8% of them were due to skill shortages whereas only 61.2% were due to skill shortages in Devon and
Cornwall. This suggests that Bournemouth, Dorset and Poole’s problem is more with the quality of the labour force rather than the quantity: the data on comparatively low educational attainment supports this. For Devon and Cornwall, the hard to fill
vacancies data infer that the problem is less about quality and more about quantity, which may partially reflect its periherality and house price affordability.
The West of England (WoE) area9reported a comparatively low level of hard to fill vacancies (31.6%) and the lowest level of skill shortages (59.5%). This sub-region benefits from hosting three universities and a large pool of labour available in its relatively wide travel to work area.
9.
[image:12.595.127.541.287.464.2]Trading internationally exposes companies to the forces of competition and makes them more competitive and productive. Excluding the ‘machinery and transport equipment’ sector, South West England has a relatively low level of output traded internationally10. South West England’s SMEs in 2005, which accounted for 99.5% of all companies, were less likely to export than comparable businesses nationwide11
. Figure 4.1 describes the percentage of SME businesses estimated as trading internationally in 2005.
PRIORITY 1D
COMPETE IN THE GLOBAL ECONOMY
KEY FACT: SWINDON’S SMEs ARE TWICE AS LIKELY TO EXPORT AS UK COMPANIES; GENERALLY SOUTH WEST ENGLAND’S EXPORT PERFORMANCE IS MODEST
0% 10% 20% 30% 40%
PLYMOUTH TORBA Y
N SOMERSET BANES
CORNW ALL
S GLOS DEVO N
SOUTH WEST BRISTO
L
BOURNEMOUTH UK
SOMERSETDORSET POOLE
GLOUCESTER SHIRE
WIL TSHIRE
SWINDO N
Source: Small Business Survey, 2005, SBS 2006
FIGURE 4.1 PROPORTION OF SMEs EXPORTING (2005)
Only 13% of South West England ‘small businesses’ exported to foreign markets compared to 17% nationally. Sub-regionally the picture was more varied. A higher proportion of businesses in six of the fifteen sub-regions exported more than the national average. Generally businesses located in northern and eastern areas of the region were more likely to export. Wiltshire and Swindon (W&S) small businesses were almost twice as likely to export as the UK average business. This was due in part to the sub-region’s manufacturing sector and its proximity to London, the UK’s gateway to the world.
10.
RES Evidence Base (2005) Nigel Jump et al.
11.Results from this section come from the Annual Survey of Small Business (2005) and is based on a sample of 8,640 UK
[image:13.595.125.543.321.495.2]The noticeable exception to the northern bias was the West of England. The West of England sub-region is critical to the South West England’s economic success but has a below average proportion of businesses exporting. SMEs in North Somerset and Bath and North East Somerset, although strategically well located, were a third less likely to export than the average UK small business. This may be explained by the local sector composition and the clustering of small businesses around the dominant large businesses in the sub-region. Services which, in general, are traded less internationally than manufactured goods, contributed 77% of GVA in the West of England. Indirectly, however, small businesses in the West of England may be acting globally, as they are supplying goods and services to a few large West of England exporting businesses; particularly within the aerospace dominated ‘machine and transport’ sector. The varying patterns of trade data, reported in Figure 4.2, reinforce the ‘local’ nature of South West England’s economy.
0% 20% 40% 60%
80% 100%
N SOMERSET
SWINDONWILTSHIRE UK
GLOUCESTER
SHIRE BANES POOLEDORSET
SOUTH WESTCORNW ALL
BRISTO L
SOMERSETPLYMOUTH S G
LOS DEVON
BOURNEMOUTH TORBA
Y
Source: Small Business Survey, 2005, SBS 2006
Mostly within the local town or county Mostly within the region Mostly within the UK Mostly within the EU Mostly outside the EU Donít know
FIGURE 4.2 DESTINATION OF TRADE (2005)
In South West England, 8% more businesses service mostly local markets, compared with the national average. Only three northern based sub-regions (North Somerset, Swindon and Wiltshire) had a higher proportion of businesses mostly servicing markets outside their locality. However, after combining local and regional markets, all three sub-regions fall below the UK average. Bournemouth and Gloucestershire were the only sub-regions which had a greater proportion of businesses mainly servicing markets outside of local and regional markets, probably reflecting their proximity to regional borders. The interpretation of Bournemouth’s results should be treated with care, however, due to high levels of ‘don’t knows’. Four sub-regions (Bournemouth 10.1%, Swindon 8.5%, Somerset 6.9% and Bristol 5.3%) had comparatively higher levels of business trading mainly outside of the United
[image:14.595.118.542.310.522.2]Government recognises innovation as one of the five drivers in reducing regional and national productivity gaps. Innovation is about ‘the successful exploitation of new ideas’ which includes developing new processes as well as products.
Within its Innovation theme, the Agency is promoting the DTI Technology
Programme; part of the government’s Science and Innovation Investment Framework to support companies by sharing the financial risk of medium to long-term
technology investments. South West England is punching above its weight in terms of investment secured through the Technology Programme. To date, there are 83 separate projects supported involving 126 organisations (47 from West of England, 28 Devon, 17 Gloucestershire, 13 Somerset, 11 Wiltshire, 6 Dorset, and 4 Cornwall). The total project value exceeds £157 million. The level of investment in the
Technology Programme in South West England is over two and a half times the national average per head of population.
Sub-regional data on ‘Innovation’ is limited. Patent applications are often used as a proxy to measure at least some aspect of Innovation. Figure 5.1 shows regional and sub-regional comparative performance in total patent applications.
PRIORITY 1E
PROMOTE INNOVATION
0 20 40 60
80 100 120 140
CIoS
DEVON D&S
SOUTH WEST
GWNS
UK
Source: Eurostat 2005
FIGURE 5.1 PATENT APPLICATIONS PER MILLION LABOUR FORCE (2003)
Patents per million labour force
KEY FACT: GLOUCESTERSHIRE, WILTSHIRE AND NORTH SOMERSET EXCEL IN HIGH-TECH PATENT APPLICATIONS
In 2003, South West England produced approximately 75 patent applications per million employees; the national average was 121 although that figure is heavily biased upwards by results from the ‘Greater South East’ region. Businesses in the Gloucestershire, Wiltshire and North Somerset NUTS 2 sub-region, recorded the most patents per labour force. Patent applications per population becomes
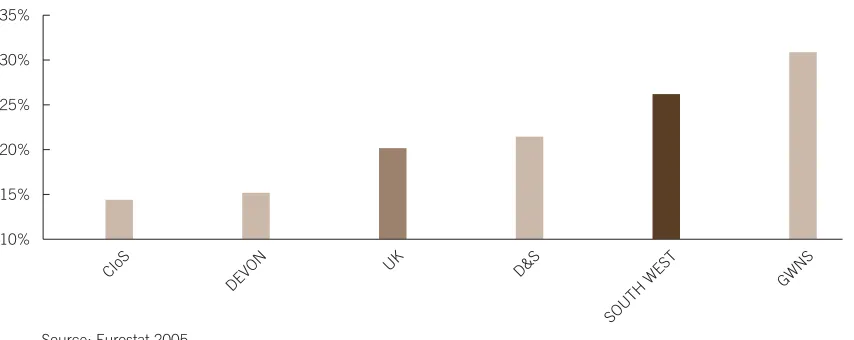
[image:15.595.110.542.444.624.2]South West England, although behind the national average in patent applications per employee, had a higher proportion of its patent applications in high-tech sectors. Figure 5.2 details the percentage of high-tech patent applications per total applications.
FIGURE 5.2 HIGH-TECH PATENT APPLICATIONS AS PROPORTION OF TOTAL (2003)
Gloucestershire, Wiltshire and North Somerset, and Dorset and Somerset (D&S) had higher proportions of high-tech applications than the UK average. This specialisation in high-tech patents can create and reinforce regional and sub-regional comparative advantages. Of all high-tech patent applications, Gloucestershire, Wiltshire and North Somerset had a higher propensity to apply for ‘communications technology’ patents (54%). Dorset and Somerset specialised in ‘computer and automated business equipment’ patent applications (63%).
Cornwall and the Isles of Scilly, and Devon had relatively low levels of high-tech patent applications, both in total numbers and as a proportion of all patent
applications. However, of all high-tech applications within each sub-region, Cornwall and Devon both specialised in ‘communications technology’ patent applications (73% and 48% respectively).
10% 15% 20% 25% 30% 35%
CIoS
DEVON
UK D&S
SOUTH WEST
GWN S
Source: Eurostat 2005
12.
[image:16.595.120.547.199.369.2]STRONG AND
INCLUSIVE
COMMUNITIES
0 4 8 12 16 0 1 2 3 4 POOLE N SOMERSET DORSET WIL TSHIRE BRISTOLTORBA Y GLOUCESTERSHIRE PLYMOUTH BAN ES SOMERSET
S GLOS DEVO N CORNW ALL SOUTH WEST BOURNEMOUT H UK SWI NDON
Source: ONS 2006
% Cl a imin g lon g er th a
n 12 months
Cl a im a nts a
s % workin
g
ag
e popul
a
tion
% of claimants claiming for over 12 months Claimant rate as % population
FIGURE 6.1 AVERAGE CLAIMANT COUNTS (JULY 2005-JUNE 2006)
South West England has comparatively high economic activity rates and low
unemployment rates; although levels vary across the sub-regions. Figure 6.1 records the average unemployment rates, as measured by claimant count, including the percentage of long term unemployed for the period July 2005-June 2006.
PRIORITY 2A
IMPROVE PARTICIPATION IN THE ECONOMY
TORBAY HAS THE HIGHEST RATE OF UNEMPLOYMENT. POOLE HAS THE LOWEST LEVELS OF LONG TERM UNEMPLOYED13
KEY FACT:
Over 45,000 people claimed unemployment related benefit in South West England during this period; 4,700 were rated as long term unemployed. South West England’s claimant rate and long term unemployment rate (1.5% and 10.3%) compare
favourably with the UK average (2.5% and 14.4%). Sub-regionally all regions except Torbay had a claimant rate below the UK average although the urban areas of Bristol, Plymouth and Swindon were considerably above South West England’s average. South Gloucestershire, Wiltshire and Dorset had the lowest rates of overall unemployment.
Claimant counts over time generally increased fastest in the rural sub-regions which had low claimant counts and slowest in urban sub-regions which had higher rates. The overall effect is to reduce the disparities between the sub-regions. The one region to buck this trend is Torbay and is symbolic of the need for wider economic restructuring in this area.
Flexible labour markets are necessary to grow economies and as such low levels of overall unemployment are not regarded as important a challenge as long term unemployment rates. Long term unemployment rates are much more problematic; the individuals concerned tend to experience higher levels of deprivation, and the
13.
[image:18.595.107.550.272.463.2]economy suffers from less than optimal levels of resource allocation. Poole, North Somerset and Dorset had the lowest percentage of long term claimants. All sub-regions except Swindon had lower long term claimant rates than the UK average, although seven of the fifteen sub-regions had rates in excess of 10%.
South West England has a growing and ageing population. Projections produced by the Business and Economy Module14estimate that the working age employment rate of persons of age 50+ will rise by approximately 5% between 2005 and 2024.
Figure 6.2 describes employment rates, reporting that South West England had a higher employment rate for the 50+ age group than the UK average. This rate is due to a more buoyant labour market in general rather than any structural differences.
60 65 70 75 90 85 80 POOLE N SOMERSET DORSET WIL TSHIRE BRISTOL TORBA Y UK GLOUCES TERSHIRE PLYMOUTH BAN ES SOMERSET DEVO N CORNW ALL SOUTH WEST BOURNEMOUTH
SWINDON S GLOS
Source: Annual Population Survey ONS 2006
Employment r
a
te %
Employment rate:50 to 59/64 Employment rate: workingage
FIGURE 6.2 WORKING AGE EMPLOYMENT RATE (OCT 2004 - SEP 2005)
Sub-regionally, the highest total 50+ employment rates were in the northern end of the region where the overall employment rates were high. The opposite was true in the southern areas of the region; lowest 50+ employment rates combined with lower rates of total employment. The degree of difference between the 50+ and total employment rates were smaller in Plymouth, Bristol and Wiltshire than the national average; five other sub-regions had broadly similar variations. Plymouth is unique: its employment rates for the 50+ age group is equal to the overall employment rate. This may be due in part, to relatively high levels of employment in traditional manufacturing industries.
14.
[image:19.595.111.539.310.491.2]20
50
40
30
Source: Small Business Service 2006
Re
g
istr
a
tion r
a
te
Most deprived 20% Least deprived 20% All
ENGLAND
2000 2004 2000 2004
SOUTH WEST FIGURE 7.1 VAT REGISTRATIONS PER 10,000 ADULTS
These figures reveal that South West England had a higher than average number of business start ups per adult population in the 20% most deprived areas. In 2004, the most deprived areas in South West England would create three additional
businesses per 10,000 of adult population than the corresponding UK average. Over the period 2000-2004, the number of South West England businesses created in the 20% most deprived areas changed little (from 32 to 31 businesses per 10,000 adult population). The number of businesses created in the least deprived areas also dropped very slightly (from 36 to 35), resulting in no overall change in the difference between the business start up rates in the least and most deprived areas (only 4 businesses per 10,000 population). By comparison, in 2004, the difference in English businesses created in most and least disadvantaged areas was 14 businesses per head of population. This suggests there is less disparity between SOAs in South West England.
PRIORITY 2B
REGENERATE THE MOST DISADVANTAGED AREAS
Disadvantaged areas, as measured by the Index of Multiple Deprivation, are
determined from a range of individual indicators15. On average, South West England cannot be considered particularly deprived, although many local, persistent pockets exist. South West England has 278 low level Super Output Areas (SOAs) in the top 20% of most deprived areas in England; 8.6% of the South West England total SOAs. West of England has the highest proportion, with 12.9% of its SOAs rated in the top 20% of most deprived regions; Somerset has the lowest (4%).
Figure 7.1 measures the number of businesses registering for VAT by level of deprivation in 2000 and 200416.
MORE BUSINESSES CREATED IN DEPRIVED AREAS ACROSS THE SOUTH WEST THAN IN OTHER PARTS OF ENGLAND
KEY FACT:
15.
Includes income, employment, health, education, crime, housing and living environment.
[image:20.595.109.544.328.494.2]Cornwall and the Isles of Scilly had the lowest median income of any county at £14,000 and Wiltshire the highest, £17,300. They were also the two counties with least difference in median incomes between districts; Wiltshire (£1,000) and
Cornwall and the Isles of Scilly (£1,400). This alignment of income rates within these local districts may reflect the cost of living in each of these sub-regions. Therefore, the disparity between the sub-regions may not be as challenging as income rate disparities within more local areas. Counties that experienced the largest variations were Gloucestershire (£3,100) and Dorset (£2,900).
Personal incomes are a key measure of living standards. Incomes analysis is based on median estimates to avoid the skewing effects of extreme values. The South West England median income was £15,600, ranging from a high of £18,400 in
[image:21.595.142.523.234.532.2]Tewkesbury to a low of £12,900 in Torridge. Figure 7.1 charts the median level of personal incomes of tax payers at district level. Incomes were generally higher in the north and eastern areas of the region than in the south and west.
FIGURE 7.2 SUB-REGIONAL INCOMES (2003-04)
Source: HM Revenue and Customs 2006
Median personal incomes of taxpayers, 2003-4
100 120 140 160 220
200
180
POOLE
N SOMERSET
DORSET WIL
TSHIRE BRISTO
L
TORBA Y
ENG LAND
GLOUCESTERSHI RE
PLYMOUTH
BANES SOMERSET
DEVON
SOUTH
WEST CIOS
BOURNEMOUT H
SWINDON
Source: DCLG (based on Land Registry figures) 2006
£000s
FIGURE 8.1 AVERAGE HOUSE PRICES (2005)
Of the fifteen sub-regions in South West England, only four urban unitary authorities had house prices below the English average (Plymouth, Swindon, Bristol and Torbay). The most expensive prices were paid in Poole, Bath and North East Somerset, and Dorset. The average costs of housing in these areas were between 22%-28% more expensive than the average for England.
In 2005, the median house price: earnings ratio in England was 7:1. In South West England, this was inflated to 8:1. Figure 8.2 illustrates the cost of housing compared to average wage rates.
PRIORITY 2C
PLAN SUSTAINABLE AND SUCCESSFUL COMMUNITIES
Policies about sustainable communities concern the provision of high quality environments in diverse communities where people can both live and work. A key element of building sustainable communities is the availability of affordable housing. A house in South West England costs approximately 6% more than the English average whilst regional average earnings are 6% below the national average. Figure 8.1 illustrates the average cost of housing by county and unitary authority.
MOST EXPENSIVE HOUSES ARE IN DORSET
[image:22.595.109.543.301.478.2]The map illustrates that housing often becomes less affordable the further one travels south and west across the South West England peninsula. This trend indicates that many aspects of the regional economy, generally most buoyant in the north and east and least in the south and west, are reversed somewhat in the housing market.
The most affordable housing as measured by house price to income ratios were in the urban unitary authorities of Swindon, South Gloucestershire, Plymouth, North Somerset, Gloucester and Bristol (all under 7:1). Commuters work in the urban areas but live outside in the suburbs or satellite towns and villages. Relatively cheap house prices in the cities are a local example of the economy and housing market
disconnect rather than examples of sustainable communities.
The areas with highest earnings to house ratios were Penwith (11:1), Carrick, North Devon, and Christchurch (over 10:1). Penwith and North Devon have the lowest gross weekly pay of all South West England districts but inflated house prices due to an increase in inward migration; and second home owners. The high ratio in
Christchurch also reflects the buoyancy of the housing market because of a
continuous inward flow of relatively wealthy retirees rather than any weakness in sub-regional pay amongst the workforce.
FIGURE 8.2 HOUSE PRICE TO EARNINGS RATIO (2005)
Source: DCLG (based on Land Registry figures) and ONS 2006 10.1-11.0
9.1-10.0
[image:23.595.145.526.116.412.2]OBJECTIVE 3
AN EFFECTIVE
AND
CONFIDENT
REGION
BOURNEMOUTH
-20% 0% 20% 40%
80%
60%
NEW
QUA
Y
PENZANCE ST JUST ST MAR
YS UK
PLYMOUTH
EXETER
TRESCO BRISTOL
SOUTH WEST
Source: Civil Aviation Authority 2006
FIGURE 9.1 GROWTH RATE IN AIRPORT PASSENGER NUMBERS (2004-2005)
As part of the Regional Funding Allocation, South West England partners including the South West RDA, the Regional Assembly, and the Government Office for the South West advised central government on regional priorities for transport. As a result, £951 million was secured for transport projects across the region. Examples of sub-regional projects planned for the next three years include the Weymouth relief road, Newquay Airport, Greater Bristol Bus Network and the A419 Blunsdon bypass.
Given its geography, improving South West England’s communications is critical to the region’s economic success, improving access to markets and competitiveness. To ensure long term sustainability, improvement of regional infrastructure needs to proceed in a way that limits impact on the environment. Growth in air travel is an example of the types of trade-off involved; within the region, between regions and internationally. The higher than average growth seen in regional air travel (see figure 9.1) is in line with the government’s diversification policy for the sector. In continuing to grow, the region’s air related industries (ports, travel and production) will be under competitive and other pressures to improve their relative environmental performance.
In 2004-5, UK airport passenger numbers grew by 5.8% compared with 19.1% regionally. Bournemouth experienced the largest increase in passenger numbers; 68% from 2004-05 and 210% since 2001. Exeter and Newquay are expanding rapidly too. Approximately 70% of all regional air passengers, however, fly from Bristol International Airport. Its traveller numbers grew by 13% between 2004 and 2005 and 94% since 2001. The smaller regional airports of Penzance Heliport, St Just, St Marys and Tresco all experienced negative growth rates in 2004-05.
PRIORITY 3A
IMPROVE TRANSPORT NETWORKS
BOURNEMOUTH INTERNATIONAL AIRPORT LEAD MAIN REGIONAL AIRPORTS IN STRONG GROWTH
[image:25.595.115.548.461.632.2]Figure 9.2 uses 2001 Census data to explore sub-regional travel to work patterns.
BOURNEMOUT H
0% 20% 40% 60% 100%
80%
CIoS
DORSET WIL
TSHIRE SWI
NDON
GLOUCESTERSHIRE N SOMERSET SOMERSET
POOLE BANES
ENGLAND TORBA Y
PLYMOUTH
S GLOS DEVON
BRISTOL
SOUTH WEST
Source: Census 2001, ONS
Private (Motorised) Private other Public
FIGURE 9.2 USUAL METHOD OF TRAVEL TO WORK (2001)
Workers in South West England were twice as likely to use motorised private transport rather than any alternative method. Only 6% of South West England residents use public transport to travel to work and just over 1 in 4 people use other methods17. The average English worker is less likely to use motorised private
transport than the South West England worker and twice as likely to use public transport. This partly reflects the region’s relative lack of urban concentration.
The figures may suggest that a higher proportion of workers in South West England either work from home or live close to their work; and integrated public transport networks are incomplete, particularly for those living in rural areas. The sub-regional data reinforces this picture. Residents of rural counties were less likely to use public transport and more likely to use other private modes of transport. This suggests that rural commuters use private modes of transport when travelling to work but a larger proportion of work is located in close proximity to home. Residents of urban areas were much more likely to use a developed public transport system. Workers from the commuter belts of South Gloucestershire and North Somerset, however, were most likely to use private motorised transport and least likely to use other forms of private transport.
17.
[image:26.595.119.542.158.351.2]-10 0 10 20 40
50 60
30
DOR SET
WIL TSHIRE
CORNW ALL
GLOUCESTERSHIRE
SOMERSET
DEVON WoE
Source: ONS 2006
000s
[image:27.595.112.543.352.562.2]0-15 16-24 25-44 45-64 65+
FIGURE 10.1 NET INTERNAL MIGRATION BY AGE, 1999- 2003
Net inward migration can be seen as a measure of success and what is best about the region. A strong economy combined with high quality of life has fuelled South West England’s net inward migration. In 2005, the population was approximately 5.1 million with over 100,000 more people living in South West England in 2005 than in 2002. The majority of this net inward migration occurred in rural areas. This
perception of South West England as providing a ‘high quality of life’ to its residents was backed up in a recent league table of regional well-being18. It placed South West England as top of all nine English regions, emphasising low stress levels and high contentment at work and home. Figure 10.1 shows net migration flows from 1999-2003 and confirms that all sub-regional populations grew during this period.
The West of England sub-region, which had the second largest population, experienced the lowest level of net inward migration (7,400) and, therefore, the lowest level of growth (0.7%). Devon hosted the largest increase in actual numbers (51,300 or 4.7%). Cornwall had the second highest growth in numbers (31,600) and fastest growth rates (6.1%). Dorset and Somerset were also buoyant.
PRIORITY 3B
PROMOTE AND ENHANCE WHAT IS BEST ABOUT THE REGION
DEVON IS THE MOST POPULAR DESTINATION IN A REGION THAT EXPERIENCED HIGH NET INWARD MIGRATION
KEY FACT:
The age patterns of inward migration infer different motivations. West of England had negative growth rates19of age groups 45+, stable population of 25-44 and positive growth rates of 16-24. The increase in the numbers of 16-24 year olds was equivalent to growing the overall population by 1.5%.
The growth in size of young age groups was in part due to high levels of students, retained graduates and economic migrants. By contrast, all other sub-regions had a net loss of this age group. Somerset lost the largest amount in total (7,500)
accounting for a decline of 1.5% of their total population. Devon and Cornwall experienced high levels of inward migration in the two adult age groups 25-44 and 45-64 as well as the under 16s. This suggests that families of working age and those approaching retirement age may be relocating as a lifestyle choice to the rural and coastal areas of Devon and Cornwall. The increased labour brought to these markets can fuel the economy but may pose challenges in the future as the trend to aging demographics continues.
Tourism numbers also reflect positive external perception of the region. In 2003, nearly one in every five UK tourist trips were taken to South West England and one in every four visitor nights spent in a bed in the region. Table 10.1 details visitor
numbers of overseas visitors to the region broken down by sub-region.
REGION STAYING VISITS (THOUSANDS) NIGHTS (MILLIONS) SPEND (MILLIONS)
Bristol 350 2.4 113
Gloucestershire 270 1.7 98
CIoS 260 1.7 72
Devon 400 3.0 109
Somerset 450 3.0 123
Dorset 320 3.3 128
Wiltshire 280 1.7 70
TABLE 10.1 SHARE OF OVERSEAS TOURISM BY SUB-REGION (2004)
Source: International Passenger Service 2005
Overseas visitors were spread right across the region. Somerset, including Bath, was the most popular destination, accounting for approximately 19% of visits. Dorset was the most popular in terms of visitor nights accounting for approximately 20% of South West England’s total. Gloucestershire, although only accounting for 10% of visitor nights, accounted for the largest ratio of spend to visitor nights. In 2004, overseas visitors in Gloucestershire spent on average £58 per night.
[image:28.595.141.546.399.544.2]REVIEW OF THE SUB-REGIONAL ECONOMIC PARTNERSHIPS (SRPs):
BACKGROUND
When created in 1999, the South West RDA was a relatively small organisation covering a very large region. In its first year, the Agency set one of its three strategic objectives as ‘Improving Regional Coherence’ – a strategy to align local players with the implementation of the RES. The SRPs, therefore, offered the Agency a practical way of communicating and engaging with a large number of players.
The SRPs in South West England are based on seven administrative areas:
• Bournemouth, Poole and Dorset Economic Partnership • Cornwall and Isles of Scilly Economic Forum
• Devon SRP (as a federation of partnerships)
• Gloucestershire First (initially as Gloucestershire Development Agency) • Somerset Economic Leaders (initially as Somerset Strategic Partnership) • West of England Partnership (initially as West of England Strategic Partnership) • Wiltshire and Swindon Economic Partnership
The SRPs are all different. They do not share the same genesis, physical and economic geography, political conditions or resources. The role of the SRPs is to provide clear, coherent and co-ordinated views on problems and issues in the sub-regions primarily for the Agency and, to a lesser extent, key strategic partners, such as Government Office for the South West (GOSW) and South West Regional Assembly (SWRA).
SRPs are supported primarily as a means of strengthening engagement and dialogue in a large and diverse region. In some cases, the SRPs have taken on, or
co-ordinated, delivery activity. Examples of such activity include Investor Support in Gloucestershire, or Rural Renaissance and Connecting South West.
Since 1999, the SRPs have undertaken the role of developing, producing and maintaining a sub-regional economic strategy that nests within the RES. The Agency commissioned an impact evaluation of the SRPs in the spring 2006 which engaged a wide audience, including:
• The Chairman of each SRP • GOSW
• SWRA
• South West Observatory • SRP Members and Forums
The SRPs worked hard as sub-regional influencers and all have a good understanding of the requirements of partnership and the need to engage stakeholders. The SRP Chairs Forum – a relatively new group – has been making an impact in terms of raising the profile and strengthening the strategic voice of SRPs in the region.
OUTLOOK:
The Agency is currently reviewing its approach to sub-regional partnership working, taking account of wider local and sub-regional partnerships and developments with respect to governance policy. It will press the need for the South West RDA, SWRA and GOSW to agree a joint approach to sub-regional strategic economic engagement.
The Agency’s review of SRPs will also be looking at the role and structure of the partnerships in response to the developing central government agenda around Local Strategic Partnerships, Local Area Agreements, the Cities and Regions debate, and the Way Ahead.
ABBREVIATIONS
BANES Bath and North East Somerset
BD&P Bournemouth, Dorset and Poole
B&P Bournemouth and Poole
CIoS Cornwall and the Isles of Scilly
DCLG Department for Communities and Local Government
D&C Devon and Cornwall
D&S Dorset and Somerset
GOSW Government Office for the South West
GVA Gross Value Added
GWNS Gloucestershire, Wiltshire and North Somerset
LSC Learning and Skills Council
N&NES North and North East Somerset
N Somerset North Somerset
NUTS Nomenclature of Territorial Units for Statistics
NVQ National Vocational Qualification
ONS The Office for National Statistics
RDA Regional Development Agency
RES Regional Economic Strategy
S Glos South Gloucestershire
SME Small and Medium Sized Enterprise
SOA Super Output Area
SRP Sub-Regional Partnership
SW South West
SWRA South West Regional Assembly
UK United Kingdom
VAT Value Added Tax
WoE West of England
SOUTH WEST ENGLAND REGIONAL ECONOMIC PROFILE (REP)
The REP is published by email and on www.swbem.org.uk and
www.southwestrda.org.uk twice a year to provide a ‘snapshot’ of the economy of
South West England.
To subscribe: email: [email protected]or write to
Business and Economy Module, 100 Temple Street, Bristol, BS1 6AE. You can get a
summary of this document on audio tape from us. Translated versions will also be produced on request. Please contact the South West RDA Marketing team on
01392 229573.
The Business and Economy Module of the South West Observatory provides a dynamic source of economic and business research and intelligence, with comprehensive data and analysis to support regional development and evidence based decision making. To improve the availability of regional data the Business and Economy Module has developed a set of Regional Accounts which are freely
available to all. For further information please visit the Business and Economy Module website (www.swbem.org.uk).
The South West Regional Observatory’s Business and Economy Module and the South West RDA use a wide range of information and data sourced from third party suppliers within its analysis and reports. Neither body can be held responsible for the accuracy or timeliness of this information.
Neither the Business and Economy Module nor the South West RDA will be liable for any losses suffered or liabilities incurred by third parties’ use or reliance, in any way, on the information contained in this publication.
This document has been printed on Revive uncoated, 100% recycled from 80% de-inked post consumer waste and 20% mill broke. All papers are elemental chlorine free.