A multi-tier adaptive grid algorithm for the evolutionary
multi-objective optimisation of complex problems
ROSTAMI, Shahin and SHENFIELD, Alex
<http://orcid.org/0000-0002-2931-8077>
Available from Sheffield Hallam University Research Archive (SHURA) at:
http://shura.shu.ac.uk/12686/
This document is the author deposited version. You are advised to consult the
publisher's version if you wish to cite from it.
Published version
ROSTAMI, Shahin and SHENFIELD, Alex (2017). A multi-tier adaptive grid algorithm
for the evolutionary multi-objective optimisation of complex problems. Soft
Computing - A Fusion of Foundations, Methodologies and Applications, 21 (17),
4963-4979.
Copyright and re-use policy
DOI 10.1007/s00500-016-2227-6
F O U N DAT I O N S
A multi-tier adaptive grid algorithm for the evolutionary
multi-objective optimisation of complex problems
Shahin Rostami1 · Alex Shenfield2
© The Author(s) 2016. This article is published with open access at Springerlink.com
Abstract The multi-tier Covariance Matrix Adaptation Pareto Archived Evolution Strategy (m-CMA-PAES) is an evolutionary multi-objective optimisation (EMO) algorithm for real-valued optimisation problems. It combines a non-elitist adaptive grid based selection scheme with the efficient strategy parameter adaptation of the elitist Covariance Matrix Adaptation Evolution Strategy (CMA-ES). In the original CMA-PAES, a solution is selected as a parent for the next population using an elitist adaptive grid archiving (AGA) scheme derived from the Pareto Archived Evolution Strategy (PAES). In contrast, a multi-tiered AGA scheme to pop-ulate the archive using an adaptive grid for each level of non-dominated solutions in the considered candidate popu-lation is proposed. The new selection scheme improves the performance of the CMA-PAES as shown using benchmark functions from the ZDT, CEC09, and DTLZ test suite in
a comparison against the(μ+λ)Multi-Objective
Covari-ance Matrix Adaptation Evolution Strategy (MO-CMA-ES). In comparison with MO-CMA-ES, the experimental results show that the proposed algorithm offers up to a 69 % per-formance increase according to the Inverse Generational Distance (IGD) metric.
Keywords Multi-objective optimisation·Evolutionary
algorithms· Evolution strategies· Covariance matrix
adaptation·Adaptive grid archiving
Communicated by A. Di Nola.
B
Shahin Rostami1 Department of Computing and Informatics, Bournemouth
University, Bournemouth BH12 5BB, UK
2 Department of Engineering and Mathematics, Sheffield
Hallam University, Sheffield S1 1WB, UK
1 Introduction
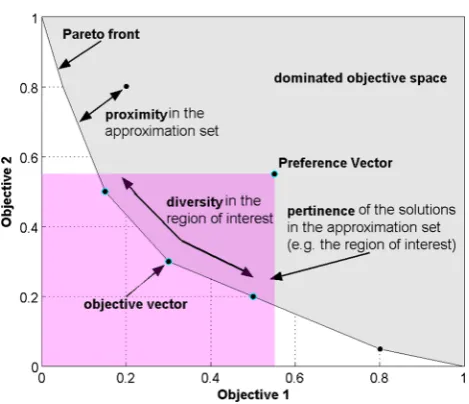
The quality of the set of candidate solutions to a multi-objective optimisation problem can be assessed using three criteria: proximity to the true Pareto front (i.e. how close the set of candidate solutions is to the true global solution set), diversity (i.e. how well distributed the set of candidate solu-tions is over the true Pareto optimal front) and pertinency (i.e. how relevant the set of candidate solutions is to a deci-sion maker). An ideal approximation set should be uniformly
spread across the true Pareto optimal front (Deb 2001), or—
in real-world problems at least–that part of it that represents
a useful subset of solutions to the problem1(Purshouse and
Fleming 2007).
The vast majority of the current state-of-the-art Evolution-ary Multi-objective Optimisation (EMO) algorithms employ elitism to enhance convergence to the true Pareto optimal front. Elitism ensures some or all of the fittest individuals in a
population at generationgare inserted into generationg+1.
Using this method, it is possible to prevent the loss of the fittest individuals which are considered to have some of the most valuable chromosomes in the population. However, in many multi-objective optimisation problems, solutions exist which may not be considered elite due to their objective value in regard to the population, but may contain useful genetic information. This genetic information can be utilised later in the search to move into unexplored areas of the objective space, but due to elitism and non-dominated sorting schemes it may be abandoned in the early stages of the search.
1 For example, in the design of automotive engines, there is typically a
The aim of this study is to counter the potential nega-tive effects resulting from elitist approaches to selection (for example, the bounded Pareto archive used in the Covari-ance Matrix Adaption—Pareto Archived Evolution Strategy (CMA-PAES)) by not only preserving elite solutions but also focusing part of the function evaluation budget on non-elitist solutions that have the potential to contribute useful genetic information in the future. To achieve this, a novel multi-tier adaptive grid selection scheme is developed and combined with the existing CMA-PAES algorithm, in a new augmented algorithm named the Multi-tier Covariance Matrix Adaptation Pareto Archived Evolution Strategy. This novel algorithm sacrifices a portion of the function evalu-ation budget in favour of producing diverse approximevalu-ation sets consisting of solutions from areas of the objective space which are difficult or impossible to obtain with an elitism approach. With this feature, the final approximation set offers a better representation of the trade-off surface, therefore allowing the decision maker to make a more informed selec-tion. The performance of this new algorithm is then evaluated on several benchmarking test suites from the literature.
The paper is organised as follows: Sect.2introduces the
field of evolutionary multi-objective optimisation and its
per-formance characteristics, Sect.3introduces the CMA-PAES
algorithm and novel multi-tier adaptive grid algorithm, Sect.
4contains the experimental set-up and methods of
perfor-mance assessment, Sect.5presents and discusses the results,
and Sect.6 draws some conclusions as well as suggesting
future research direction.
2 Background
2.1 Evolutionary algorithms
Evolutionary algorithms (EAs) are an optimisation technique inspired by some of the concepts behind natural selection and population genetics and are capable of iteratively evolving a
population of candidate solutions to a problem (Goldberg
1989). They both explore the solution space of a problem
(by using variation operators such as mutation and recom-bination) and exploit valuable information present in the previous generation of candidate solutions (by using a selec-tion operator which gives preference to the best soluselec-tions in the population when creating the next generation of solutions to be evaluated).
One of the main reasons evolutionary algorithms are applicable across many different problem domains (includ-ing those where conventional optimisation techniques strug-gle) is their direct use of evaluation function information, rather than derivative information or other auxiliary knowl-edge. Derivative information (for example) can be extremely difficult to calculate in many real-world problems because
the evaluation of candidate solutions can be expensive. Evo-lutionary algorithms are also robust to noisy solution spaces because of their population-based nature. This means that each generation contains more information about the shape of the fitness landscape than would be available to conventional,
non-population-based optimisation methods (Michalewicz
and Fogel 2000).
Evolutionary algorithms have also been used in combina-tion with other approaches to optimisacombina-tion to form hybrid algorithms which have been applied successfully to
real-world problems (Sfrent and Pop 2015). Hyperheuristics are
a methodology in search and optimisation which are con-cerned with choosing an appropriate heuristic or algorithm in
any given optimisation context (Burke et al. 2003), and can
operate on meta-heuristics. Hybrid algorithms indicate the benefits of using an approach which aim to combine existing algorithms and heuristics such that a more general approach can be taken to optimisation.
2.2 Evolutionary multi-objective optimisation
Many real-world optimisation problems involve the satisfac-tion of several objectives which, in a general form, can be
described by a vector of objective functionsf and a
corre-sponding set of decision variablesv, as illustrated in Eq.1.
min
f (v)=(f1(v),f2(v), . . . , fM(v)) (1) In many problems, conflicts occur between objectives such that it is not possible to find a single ideal solution to the problem. In this case, the solution consists of a set of Pareto optimal points—where any improvement in one objective will lead to a deterioration in one or more of the other objectives.
The quality of the set of non-dominated solutions (known
as theapproximation set) can be characterised by considering
three main measures (Purshouse 2003):
– Theproximityof the approximation set to the true Pareto
front.
– The diversity of the distribution of solutions in the
approximation set.
– Thepertinenceof the solutions in the approximation set
to the decision maker.
These concepts are illustrated graphically in Fig.1, where
a single-objective value is defined asxmand an objective
vec-tor ofMobjectives can be defined as X= x1,x2, . . . ,xM. A preference vector can be defined as P= ρ1, ρ2, . . . , ρM,
where every entryρmrefers to the goal which the
correspond-ing objective valuesxmmust satisfy.
Fig. 1 Characterising the approximation set for a bi-objective problem
goodproximity) and provide a uniform spread of solutions across the region of interest of the decision maker (i.e. having adiverseset of candidate solutions that arepertinentto the decision maker).
Conventional multi-objective optimisation methods often fail to satisfy all these requirements, with methods such as
the weighted sum method (Hwang and Masud 1979) and the
goal attainment method (Gembicki 1974) only capable of
finding a single point from the approximation set rather than a diverse distribution of potential solutions. This means that such algorithms do not fully capture the shape of the trade-off space without running the optimisation routine many times. In contrast, evolutionary algorithms (EAs) iteratively evolve a population of candidate solutions to a problem in paral-lel and are thus capable of finding multiple non-dominated solutions. This results in a diverse set of potential solutions to choose from, rather than a single solution that may not meet the required performance criteria.
2.3 Obtaining good proximity
The primary goal in evolutionary multi-objective optimisa-tion is finding an approximaoptimisa-tion set that has good proximity to the Pareto front. This ensures that the candidate solu-tions in this approximation set represent optimal trade-offs between objectives. The early approaches to evolutionary multi-objective optimisation were primarily concerned with guiding the search towards the Pareto front, reflecting the importance of this goal.
Convergence to the Pareto front is mainly driven by selec-tion for variaselec-tion, where the best candidate soluselec-tions are assigned the highest fitness (and thus have the best chance of contributing to the next generation). Several techniques have been proposed to solve the problem of assigning scalar fitness
values to individuals in the presence of multiple objectives— with Pareto-based methods generally being considered the best. Several variants of Pareto-based fitness assignment
methods exist (seeZitzler et al. 2004for more information),
but the general procedure is to rank individuals in the approx-imation set according to some dominance criterion, and then map fitness values to these ranks (often via a linear transfor-mation). Mating selection then proceeds using these fitness values.
The proximity of the approximation set to the true Pareto
front can be enhanced by the use ofelitism. Elitism aims to
address the problem of losing good solutions during the
opti-misation process (Zitzler et al. 2004), either by maintaining
an external population of non-dominated solutions
(com-monly referred to as anarchive), or by using a(μ+λ)type
environmental selection mechanism. Studies have shown that elitist MOEAs perform favourably when compared to their
non-elitist counterparts (Zitzler and Thiele 1999;Zitzler et al.
2000a). Elitism has also been shown to be a theoretical requirement to guarantee convergence of an MOEA in the
limit condition (Rudolph and Agapie 2000).
In archive-based elitism, the archive can be used either just to store good solutions generated by the MOEA or can be integrated into the algorithm with individuals from the archive participating in the selection process. Some mecha-nism is often needed to control the number of non-dominated solutions in the archive, since the archive is usually a finite size and the number of non-dominated individuals can potentially be infinite. Density-based measures to preserve diversity are commonly used in this archive reduction—for
example, the Pareto Archived Evolution Strategy (Knowles
and Corne 2000a) uses an adaptive crowding procedure to preserve diversity (see later).
An alternative elitist strategy is the(μ+λ)population
reduction scheme, where the parent population and the child population compete against each other for selection. This scheme originated in Evolution Strategies and forms the basis of the environmental selection scheme used in algorithms
such as NSGA-II (Deb et al. 2002a) and, more recently,
the Multi-Objective Covariance Matrix Adaptation
Evolu-tionary Strategy (MO-CMA-ES) (Igel et al. 2007). In both
these algorithms, a two level sorting process is used, with Pareto dominance as the primary sorting criteria and pop-ulation density as a secondary sorting criteria (used as a tiebreaker amongst individuals having the same level of non-dominance).
MO-CMA-ES is a state-of-the-art elitist multi-objective evolutionary optimisation technique that builds upon the powerful covariance matrix adaptation evolution strategy
(CMA-ES) real-valued single-objective optimiser (Hansen
[image:4.595.53.288.50.252.2]broad spectrum of problems in the continuous domain (Auger and Hansen 2005), and is robust to the initial choice of para-meters (due to its advanced self-adaptation strategy). These make the CMA-ES algorithm an excellent choice to base a multi-objective evolutionary optimisation on.
Two variants of MO-CMA-ES exist in the literature: the
s-MO-CMA-ES which achieves diversity using the
con-tributing hypervolume measure (ors-metric) introduced by
(Zitzler and Thiele 1998), and the c-MO-CMA-ES which achieves diversity using the crowding-distance measure introduced in NSGA-II. Whilst initial results have shown that MO-CMA-ES is extremely promising, it is as yet mostly untested on real-world engineering problems. Some results show that MO-CMA-ES struggles to converge to good solu-tions on problems with many deceptive locally Pareto optimal fronts—a feature that can be common in real-world problems (Voß et al. 2010).
In the original MO-CMA-ES, a mutated offspring solu-tion is considered to be successful if it dominates its parent.
In contrast, (Voß et al. 2010) introduces a new MO-CMA-ES
variant which considers a solution successful if it is selected to be in the next parent population, introduces a new update rule for the self-adaptive strategy, and conducts a compar-ison of MO-CMA-ES variants on synthetic test functions consisting of up to three objectives. MO-CMA-ES with the improved update rule is shown to perform substantially better than the original algorithm and thus is used for comparison
in Sect.5of this paper.
2.4 Obtaining good diversity
Most EMO algorithms use density information in the selec-tion process to maintain diversity in the approximaselec-tion set. However, diversity preservation has often been seen as a secondary consideration (after obtaining good proximity to
the Pareto front). This is because, asBosman and Thierens
(2003) state:
“…since the goal is to preserve diversity along an
approximation set that is as close as possible to the Pareto optimal front, rather than to preserve diversity in general, the exploitation of diversity should not pre-cede the exploitation of proximity”.
Goldberg(1989) initially suggested the use of aniching
strategy in EMO to maintain diversity, with most of the first generation of Pareto-based EMO algorithms using the concept of fitness sharing from single-objective EA theory (Fonseca and Fleming 1993;Horn et al. 1994;Srinivas and Deb 1994). However, the success of fitness sharing is strongly dependent on the choice of an appropriate niche size
para-meter,σshare. Whilst several authors proposed guidelines for
choosingσshare(Deb and Goldberg 1989;Fonseca and
Flem-ing 1993), Fonseca and Fleming (1995) were the first to
note the similarity between fitness sharing and kernel density estimation in statistics which then provided the EMO com-munity with a set of established techniques for automatically
selecting the niche size parameter, such as theEpanechnikov
estimator(Silverman 1986).
A large number of the second generation of Pareto-based MOEAs include advanced methods of estimating the pop-ulation density, inspired by statistical density estimation
techniques. These can be mainly classified into histogram
techniques(such as that used in PAES (Knowles and Corne 2000a)) ornearest neighbour density estimators(such as that
used in SPEA2 (Zitzler et al. 2001) and NSGA-II (Deb et al.
2002a)). Other approaches to diversity preservation include the use of hybrid algorithms, such as the Hybrid Immune
Genetic Algorithm (HIGA) Istin et al.(2011), which uses
an immune component to continuously evolve new solutions and then inject them back into the population of an EA. These estimates of population density can be used in both mating selection and environmental selection. In mating selection, these density estimates are commonly used to discriminate between individuals of the same rank. Individuals from a less dense part of the population are assigned higher fitness and thus have a higher chance of contributing to the next gener-ation.
Density estimation in environmental selection is co-mmonly used when there exists more locally non-dominated solutions than can be retained in the population. For example, in archive-based elitism, density-based clustering methods are often used to reduce the archive to the required size. Non-dominated solutions from sparser regions of the search space are again preferred over those from regions with higher population densities, with the aim being to ensure that the external population contains a diverse set of candidate solu-tions in close proximity to the Pareto front.
The Pareto Archived Evolution Strategy (Knowles and
Corne 2000a) uses an adaptive crowding procedure to pre-serve diversity that recursively divides up the objective space into grid segments. This bounded Pareto archiving technique then uses this adaptive grid to keep track of the density of
solutions within sections of the objective space (Knowles and
Corne 1999). Since it is adaptive, this crowding procedure does not require the critical setting of a niche size parameter which was a common problem with traditional kernel-based methods of diversity preservation. This adaptive grid archiv-ing (AGA) scheme uses a grid with a preconfigured number of divisions to divide the objective space, and when a solu-tion is generated, its grid locasolu-tion is identified and associated with it. Each grid location is considered to contain its own sub-population, and information on how many solutions in the archive are located within a certain grid location is
avail-able during the optimisation process. Figure2illustrates this
Objective 1
0 0.2 0.4 0.6 0.8 1
Objective 2
0 0.2 0.4 0.6 0.8 1
11 12 13 14 15 16 17 18 19 20
1 2 3 4 5 6 7 8 9 10
21 22 23 24 25 26 27 28 29 30 31 32 33 34 35 36 37 38 39 40 41 42 43 44 45 46 47 48 49 50 51 52 53 54 55 56 57 58 59 60 61 62 63 64 65 66 67 68 69 70 71 72 73 74 75 76 77 78 79 80 81 82 83 84 85 86 87 88 89 90 91 92 93 94 95 96 97 98 99 100
Fig. 2 An example plot of a population and visualisation of grid divi-sions managed by an AGA
holds a single solution, whereas the sub-population at grid location 62 contains many more. With this additional infor-mation, it is possible to discard a solution from one of the more densely populated sub-populations in favour of a can-didate solution which will be located in a sparsely populated sub-population, e.g., the one located at grid location 91.
When an archive has reached capacity and a new candidate solution is to be archived, the information tracked by the AGA is used to replace a solution in the grid location containing the highest number of solutions. When a candidate solution is non-dominated in regard to the current solution and the archive, the grid information is used to select the solution from the least populated grid location as the current (and parent) solution.
The AGA concept used in PAES later inspired several researchers and was altered and deployed in multiple EMO algorithms such as the Pareto Envelope-based Selection Algorithm (PESA) (a population-based version of PAES) (Corne et al. 2000), the Micro Genetic Algorithm (Coello Coello and Pulido 2001), and the Domination Based
Multi-Objective Evolutionary Algorithm (-MOEA) (Deb et al.
2005).
2.5 Issues with elitism
Whilst elitism has been almost universally adopted in the current state of the art for evolutionary multi-objective optimisers, in many multi-objective optimisation problems solutions may exist which are not considered elite due to their objective value in regard to the population but may still
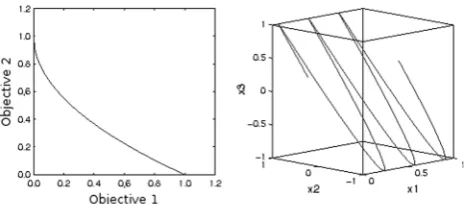
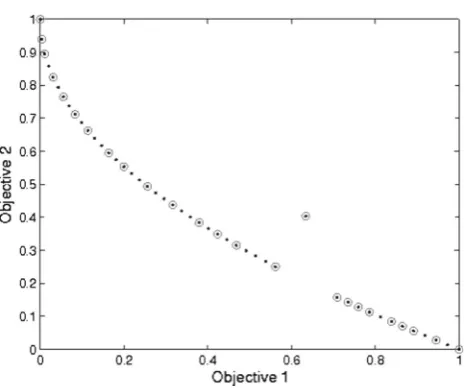
con-Fig. 3 An approximation set found using an elitist EMO algorithm after 300,000 function evaluations on CEC09 UF1
Fig. 4 True Pareto optimal front (left) and Pareto optimal set (right) for CEC09 UF1
tain useful genetic information. This genetic information can be utilised later in the search to move into unexplored areas of the objective space but, due to elitism and non-dominated sorting schemes, it may be abandoned in the early stages of the search.
The consequences of elitism and non-dominated sorting
can be seen in Fig. 3, where an elitist EMO algorithm has
produced an approximation set for the CEC09 UF1 (Zhang
et al. 2008b) test function with a budget of 300,000 func-tion evaluafunc-tions (in compliance with the CEC09 competifunc-tion rules).
By observing this two-objective plot of the approxima-tion set, it can be seen that the elitist EMO algorithm has converged to an approximation set which is missing three dis-tinct areas containing solutions in comparison with the true
Pareto optimal front plotted in Fig.4. The genetic
[image:6.595.307.544.49.244.2] [image:6.595.53.285.52.289.2] [image:6.595.309.542.287.389.2]algo-Fig. 5 Example of elitist and non-dominated selection, circled points indicate a selected individual
rithms will focus selection on these more dominant solutions and converge further into that area of the Pareto optimal set, discarding individuals which may have been only a few gen-erations away from producing non-dominated solutions in unexplored areas of the objective space.
Figure 5 illustrates an example of elitist and
non-dominated selection discarding an individual that may con-tain valuable genetic information, which could have been exploited to produce a better quality approximation set. In this example, a Pareto AGA selection scheme has been used to select parent individuals for the next generation. Because of the scheme’s elitist nature, the individual between 0.6 and 0.7 on the x-axis has not been selected for reproduction, and therefore, the scheme has discarded genetic informa-tion which may have ultimately produced soluinforma-tions towards the missing area of the approximation set. This behaviour over many generations can lead to convergence to incom-plete approximation sets.
3 CMA-PAES
The Covariance Matrix Adaptation Pareto Archived Evolu-tion Strategy is an extensible EMO algorithm framework (Rostami and Shenfield 2012) inspired by the simplicity of
PAES (Knowles and Corne 2000b). As a result, the
execu-tion life cycle of the optimisaexecu-tion process does not have a high computational cost in regard to algorithm overhead. The modular structure of the algorithm has allowed for the Covariance Matrix Adaptation (CMA) operator to be easily incorporated in order to achieve fast convergence through the powerful variation of population solutions. To manage these populations at each generational iteration, an Adaptive Grid Algorithm (AGA) approach is used in conjunction with
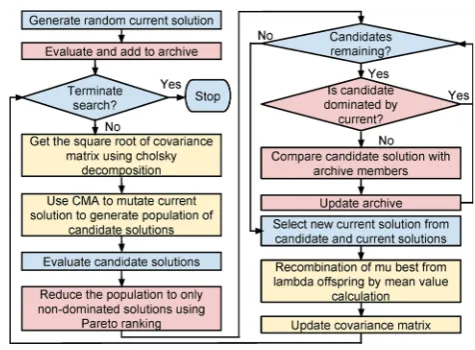
Fig. 6 Execution life cycle for the CMA-PAES algorithm
bounded Pareto archiving with the aim of diversity preserva-tion.
The algorithm execution life cycle for CMA-PAES has
been illustrated in Fig. 6. CMA-PAES begins by
initialis-ing the algorithm variables and parameters; these include the number of grid divisions used in the AGA, the archive for
storing Pareto optimal solutions, the parent vectorY, and the
covariance matrix. An initial current solution is then gen-erated at random, which is evaluated and then the first to be archived (without being subjected to the PAES archiv-ing procedure). The generational loop then begins, and the square root of the covariance matrix is resolved using
Chol-sky decomposition (as recommended byBeyer and Sendhoff
2008) which offers a less computationally demanding
alter-native to spectral decomposition. Theλcandidate solutions
are then generated using copies of the current solution and the CMA-ES procedure for mutation before being evaluated. The archive is then merged with the newly generated off-spring and subjected to Pareto ranking, and this assigns a rank of zero to all non-dominated solutions, and a rank reflecting the number of solutions that dominate the inferior solutions. The population is then purged of the inferior solutions so that only non-dominated solutions remain before being fed into the PAES archiving procedure. After the candidate solutions have been subjected to the archiving procedure and the grid has been adapted to the new solution coverage of objective space, the archive is scanned to identify the grid location with the smallest population, this is considered the lowest
density grid population (ldgp). The solutions from the
low-est density grid population are then spliced onto the end of
the firstμ−ldgpof the Pareto rank-ordered population to
[image:7.595.54.291.48.245.2] [image:7.595.304.542.51.226.2]continues onto its next iteration until the termination criteria is satisfied (maximum number of generations).
CMA-PAES has been benchmarked against NSGA-II and
PAES inRostami and Shenfield (2012) on the ZDT
syn-thetic test suite. Two performance metrics were used to compare the performance in terms of proximity (using the generational distance metric) and diversity (using the spread metric). CMA-PAES displayed superior performance (the significance of which was supported with randomisation test-ing) in returning an approximation set close to or on the true Pareto optimal front as well as maintaining diversity amongst solutions in the set.
CMA-PAES has also been benchmarked against the
MO-CMA-ES algorithm inRostami(2014), using the
hyper-volume indicator as a measure of performance. In this study, both the algorithms considered demonstrated comparable performance across multiple test problems. The significance of which was supported by the use of nonparametric testing.
3.1 A novel multi-tier adaptive grid algorithm
The new multi-tier AGA aims to prevent a population from prematurely converging as a result of following only the dom-inant (i.e. elite) solutions which may be discovered early in the optimisation process. This common optimisation sce-nario often results in genetic drift and consequently a final approximation set with solutions clustered around these elite solutions. This prevention is achieved by dividing an optimi-sation function evaluation budget and investing a percentage of this budget in to non-elite solutions. These solutions which appear non-elite early on in the optimisation process may potentially contain genetic information that would contribute to finding undiscovered areas of the objective space later in the search.
The algorithm pseudo-code for this new multi-tier
approach is listed in Algorithm1, which is executed from
line 14 of the Multi-tier Covariance Matrix Adaptation Pareto Archived Evolution Strategy (m-CMA-PAES) execution life
cycle presented in Algorithm2. This new optimisation
algo-rithm which builds upon the algoalgo-rithmic components (AGA
and CMA) outlined in Fig. 6 is referred to as the
m-CMA-PAES. First, the candidate population is divided into sub-populations based on their non-dominated rank using NSGA-II’s fast non-dominated sort. If the size of any
sub-population exceeds μ, then the standard AGA scheme is
applied to it with a maximum archive capacity ofμ, resulting
in a number of rank-ordered archives each with a maximum
capacity ofμ. Then, a single population of sizeμplus the
budget for non-elite individualsβ is produced, for example,
ifβis set as 10 % for aμpopulation of 100, then a
popula-tion of size 100×1.10 is to be produced. Next, the multi-tier
archives containing the firstμ×βsolutions are merged with
no size restriction (meaning the merged archive size can be
Fig. 7 Example of the multi-tiered grid selection, circled points indi-cate a selected individual
greater thanμ×β). This merged archive is then subjected to a
non-elite AGA (ensuring non-elite solutions are not instantly
discarded) with an archive capacity ofμ, producing a
pop-ulation of individuals to be selected as parents for the next generation.
The configuration ofβis important to the convergence of
the algorithm—if it is too high (for example, if it is greater
than half of μ), then the majority of the function
evalua-tion budget is spent on soluevalua-tions which are dominated and the search does not progress in a positive direction, and may instead move away from the Pareto optimal front. However, if
βis too small, the benefits of investing in non-elite solutions
are not exploited to an extent which will significantly impact the performance of the optimisation process. The result of this new grid selection scheme has been illustrated in Fig.
7, where the solution which may potentially contain
valu-able genetic information is selected, in contrast to it being
discarded in Fig.5.
Algorithm 1Pseudo-code of Multi-Tier Adaptive Grid Algo-rithm: multiTierSelect()
1: nonDominatedFronts = nonDominatedSort(population) 2: spaceRemaining =μ×β
3:for allnonDominatedFront in nonDominatedFrontsdo
4: ifspace Remai ni ng>0then
5: tierArchive = adaptiveGridSelection(nonDominatedFront,
μ)
6: archive = archive + tierArchive
7: spaceRemaining = spaceRemaining - size(archive)
8: end if
parentPopulation = adaptiveGridSelection(archive,μ) 9:end for
In m-CMA-PAES, a population of candidate solution indi-vidualsai(g) are initialised as the structure
[image:8.595.309.543.49.243.2]
σi(g),pi(,gc),C(
g)
i
, where each individual is assigned a
ran-domly generated problem variablexi(g) ∈ Rn between the
lower (x(L)) and upper (x(U)) variable boundaries, p¯(succg) ,i ∈ [0,1]is the smoothed success probability,σi(g)∈R+0 is the global step size,pi(,gc)∈Rnis the cumulative evolution path,
andC(ig) ∈Rn×nis the covariance matrix of the search
dis-tribution.
Algorithm 2m-CMA-PAES life cycle
1:g←0
2: initialise parent populationQg
3:whiletermination criteria not metdo
4: fork=1, ..., λdo
5: ik←k;
6: a(kg+1)←ai(kg)
7: xk(g+1)∼xi(kg)+σi(kg)N0,Ci(kg);
8: ifx(L)x(g+1)
k x(U)then
9: x(kg+1)=
x(U) ifx(g+1) k >x(U) x(L) otherwise
10: end if
11: Q(μg+)k←a(kg+1);
12: end for
13:end while
14: Qg+1=multi T i er Select(Qg)(Executes Algorithm1)
15:updat e Par amet er s()(Executes CMA Algorithm) 16:g←g+1
4 Experimental design and performance
assessment
4.1 Experimental set-up
In order to evaluate the performance of m-CMA-PAES on multi-objective test problems, a pairwise comparison between m-CMA-PAES and MO-CMA-ES on selected benchmark problems from the literature (consisting of upto 3 objectives) has been conducted. MO-CMA-ES (as outlined
in Sect.2.3) is a state-of-the-art algorithm which uses the
CMA operator for variance much like m-CMA-PAES. Both m-CMA-PAES and MO-CMA-ES have been
con-figured with a budget of 300,000 function evaluations per
algorithm execution and were executed 30 times per test function as per the CEC2009 competition guidelines. The
algorithm configurations are presented in Table1, and the
finer configurations for the CMA operator and MO-CMA-ES
have been taken fromVoß et al.(2010), where the version
of MO-CMA-ES used incorporates the improved step-size adaptation.
The ZDT, DTLZ and CEC2009 test suites have been selected for the benchmarking and comparison of
m-CMA-Table 1 Algorithm configurations used when benchmarking MO-CMA-ES and m-MA-PAES
Parameter MO-CMA-ES m-CMA-PAES
μ 2D(100), 3D(300) 2D(100), 3D(300)
λ 2D(100), 3D(300) 2D(100), 3D(300)
Archive capacity – 2D(100), 3D(300)
Multi-tier budget – 10 %
Divisions – 10
PAES and MO-CMA-ES (see Sect.4.2). These test suites
will pose both MOEAs with difficulties which are likely to be encountered in many real-world multi-objective optimisation problems, in both two-dimensional and three-dimensional objective spaces (allowing for feasible comparison with MO-CMA-ES which relies on the hypervolume indicator for secondary sorting and is thus computationally expensive in high-dimensional search spaces).
The metric used for performance assessment is the popular Inverted Generational Distance (IGD) indicator described in
Sect.4.3. The IGD indicator will be used at each generation
in order to assess performance and compare both algorithms on not just the IGD quality of the final approximation set, but also the IGD quality over time. In order to comply with
the CEC2009 competition rules (as described inZhang et al.
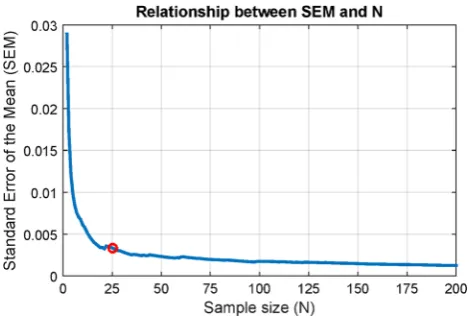
2008b), both m-CMA-PAES and MO-CMA-ES have been executed 30 times on each test function to reduce stochastic noise. This sample size is seen as sufficient because of the limited benefit of producing more than 25 samples (discussed in Sect.4.1.1).
4.1.1 Sample size sufficiency
Selecting a sufficient number of samples when comparing optimisers is critical. The sample size of 25, in order to reduce stochastic noise, is reoccurring in the evolutionary
compu-tation literature (e.g.Yang et al. 2008;Zamuda et al. 2007;
Falco et al. 2012;García et al. 2009;Wang et al. 2011). To prove the sufficiency of this sample size, a large number of hypervolume indicator value samples have been produced by executing m-CMA-PAES 200 times on the DTLZ1 synthetic test problem.
These 200 samples were then used to identify the relation-ship between the standard error of the mean (SEM) and the sample size using:
SEM= √S D
N (2)
This relationship has been illustrated in Fig. 8, which
[image:9.595.305.546.80.168.2]Fig. 8 Relationship between standard error of the mean (SEM) and the sample size of hypervolume indicator values from 200 executions of m-CMA-PAES on the DTLZ1 synthetic test problem
sizes, evolution paths and covariance matrices of the suc-cessful solutions are updated.
4.2 Multi-objective test suites
The performance of the novel m-CMA-PAES algorithm is compared to MO-CMA-ES across three different real-valued, synthetic, test suites: the widely used ZDT
bi-objective test suite proposed in Zitzler et al. (2000b), the
scalable DTLZ multi-objective test suite proposed inDeb
et al. (2002b) and the unconstrained functions from the CEC2009 multi-objective competition test suite proposed in
Zhang et al.(2008b). The configurations used for these test problems and some of their salient features are shown in
Table2
Each of these test suites incorporates a different bal-ance of features that MOEAs may find difficult to overcome during the optimisation process (for example, multi-modal search landscapes, deceptive local Pareto-fronts, non-convex Pareto-fronts). The ZDT and DTLZ test suites provide well-defined Pareto optimal fronts that have been widely used in the literature—thus allowing easy comparison with previous work. The CEC2009 multi-objective optimisation compe-tition test suite is more recent and is predominantly made up of problems with solution sets that consist of complex curves through decision variable space. These test problems contain variable linkages and present many difficulties for multi-objective optimisation routines.
4.3 Performance assessment
As the EMO process is stochastic by nature, each algorithm was executed 30 times against each test function, in an effort to minimise stochastic noise and increase the integrity of the
[image:10.595.52.287.54.212.2]comparison between the algorithms (see Sect.4.1.1). The
Table 2 Parameter configurations used for the ZDT, DTLZ and CEC09 test suites
Problem # Var # Obj Salient features
ZDT1 30 2 Convex front
ZDT2 30 2 Concave front
ZDT3 30 2 Disconnected front
ZDT4 10 2 Convex front, many local
optima
ZDT6 10 2 Concave front, non-uniform
distribution
DTLZ1 7 3 Linear front
DTLZ2 12 3 Spherical front
DTLZ3 12 3 Spherical front, many local
optima
DTLZ4 12 3 Spherical front,
non-uniform distribution
DTLZ5 12 3 Spherical front, difficult to
find true front
DTLZ6 12 3 Disconnected front
DTLZ7 22 3 Disconnected front
UF1 30 2 Nonlinear decision space
UF2 30 2 Nonlinear decision space
UF3 30 2 Many local fronts
UF4 30 2 Non-convex front
UF5 30 2 Discrete points on a linear
hyperplane
UF6 30 2 Disconnected front
UF7 30 2 Linear hyperplane front
UF8 30 3 Spherical front
UF9 30 3 Disconnected front
UF10 30 3 Spherical front
performance of each algorithm execution was then measured using the inverted generational distance (IGD) performance metric to assess the quality of the approximation set, in terms of proximity to the true Pareto optimal front and the diversity of solutions in the population.
The IGD metric measures how well the obtained approx-imation set represents the true Pareto optimal front which is provided as a large reference set. This is calculated by finding the minimum Euclidean distance of each point of the approximation set to points in the reference set. Lower IGD values indicate a better quality approximation set with IGD values of 0, indicating all the solutions in the approx-imation set are in the reference set and cover all the Pareto front.
The IGD was introduced in Coello Coello and Cortés
(2005) as an enhancement to the generational distance
[image:10.595.306.544.81.447.2]Table 3 IGD results from 30 executions of m-CMA-PAES and MO-CMA-ES on the ZDT and CEC09 test suites with two problem objectives
2D m-CMA-PAES MO-CMA-ES
Best Mean Worst Best Mean Worst pvalue %IGD
ZDT1 0.00628 0.00657 0.00686 0.00813 0.00936 0.01031 1.4e−09 69.23 +
ZDT2 0.00592 0.00614 0.00639 0.00989 0.01172 0.01511 1.4e−09 60.72 +
ZDT3 0.00574 0.00609 0.00676 0.00552 0.00594 0.00643 0.0625 −12.10 =
ZDT4 1.80044 6.17983 11.44563 2.85512 8.35397 14.56593 0.0232 17.03 +
ZDT6 0.01132 0.01279 0.01406 0.04788 0.08938 0.20901 1.4e−09 38.74 +
UF1 0.03762 0.05824 0.06579 0.05044 0.07228 0.12375 1.1e−06 17.00 +
UF2 0.01359 0.02006 0.02687 0.02117 0.03496 0.05235 5.5e−08 38.44 +
UF3 0.04869 0.07992 0.12647 0.06044 0.08129 0.10133 0.7269 1.76 =
UF4 0.05925 0.06431 0.06942 0.07661 0.08261 0.09722 1.4e−09 48.20 +
UF5 0.49880 0.72982 1.04816 0.87997 1.04873 1.26644 8.3e−09 41.54 +
UF6 0.08817 0.12736 0.22802 0.09314 0.11268 0.22469 0.010432 −10.50 –
UF7 0.01791 0.02431 0.03226 0.03306 0.06434 0.12773 1.4e−09 36.45 +
The boldface results indicate better performance
Table 4 IGD results from 30 executions of m-CMA-PAES and MO-CMA-ES on the DTLZ and CEC09 test suites with three problem objectives
3D m-CMA-PAES MO-CMA-ES
Best Mean Worst Best Mean Worst pvalue %IGD
UF8 0.13308 0.18188 0.23023 0.16091 0.23432 0.24924 3.6e−08 45.14 +
UF9 0.07381 0.07877 0.08795 0.06755 0.07440 0.07911 5.4e−05 −21.45 –
UF10 0.64046 0.97907 1.34102 1.33073 1.90805 2.89107 1.6e−09 41.28 +
DTLZ1 0.60928 3.11971 5.72913 2.11988 10.1829 20.9531 1.2e−06 34.72 +
DTLZ2 0.03919 0.04005 0.04077 0.04207 0.04491 0.04939 1.4e−09 7.06 +
DTLZ3 22.4023 50.7571 102.51 171.175 188.531 229.147 1.4e−09 66.64 +
DTLZ4 0.02459 0.03090 0.04093 0.03181 0.04411 0.07016 5.5e−08 28.99 +
DTLZ5 0.00152 0.00174 0.00201 0.00190 0.00213 0.00259 8.3e−09 11.21 +
DTLZ6 0.11059 0.32162 0.65582 0.19705 0.42455 0.71631 0.01701 16.99 +
DTLZ7 0.05268 0.05783 0.06449 0.05824 0.06653 0.07449 2.9e−08 39.89 +
The boldface results indicate better performance
IGD=
n
i=1di2
n (3)
wherenis the number of solutions in the reference set andd
is the Euclidean distance (in objective space) between each solution in the reference set and the nearest solution in the approximation set. A GD value equal to zero indicates that all members of the approximation set are on the true Pareto optimal front, and any other value indicates the magnitude of the deviation of the approximation set from the true Pareto optimal front. This implementation of the GD solves an issue in its predecessor so that it will not rate an approximation set with a single solution on the reference set as better than an approximation set which has more non-dominated solutions that are close in proximity to the reference set.
Much like the GD measure, knowledge regarding the true Pareto optimal front is required in order to form a reference set. The selection of solutions for the reference set will have an impact on the results obtained from the IGD, and therefore, the reference set must be diverse. The calculation of the IGD
can be computational expensive when working with large reference sets or a high number of objectives.
The IGD measure has been employed in the performance assessment of algorithms in much of the multi-objective
opti-misation and evolutionary computation literature (e.g.Zhang
et al. 2008a,2010;Tiwari et al. 2009;Chen et al. 2009;Nasir et al. 2011).
4.4 Statistical comparison of stochastic optimisers
Statistical comparison of the performance of the algorithms
was conducted by computing thet values2of the IGD metric
produced by both the algorithms. However, when analysing stochastic systems (such as EAs), the initial conditions that ensure the reliability of parametric tests cannot be satisfied (Li et al. 2012)—therefore a nonparametric test (encouraged byDerrac et al. 2011;Epitropakis et al. 2012) for pairwise sta-tistical comparison must be used to evaluate the significance
2 Thetvalue is the difference between the means of the datasets divided
[image:11.595.178.546.277.441.2]500 1000 1500 2000 2500 3000 0.00
0.20 0.40
IGD
Generation
m−CMA−PAES mean MO−CMA−ES mean
(a)ZDT1
500 1000 1500 2000 2500 3000 0.00
0.50 1.00 1.50 2.00
IGD
Generation
m−CMA−PAES mean MO−CMA−ES mean
(b) ZDT2
500 1000 1500 2000 2500 3000 0.00
0.20 0.40
IGD
Generation
m−CMA−PAES mean MO−CMA−ES mean
(c)ZDT3
500 1000 1500 2000 2500 3000 0.00
10.00 20.00
IGD
Generation
m−CMA−PAES mean MO−CMA−ES mean
(d) ZDT4
500 1000 1500 2000 2500 3000 0.00
1.00 2.00 3.00 4.00
IGD
Generation
m−CMA−PAES mean MO−CMA−ES mean
(e)ZDT6
500 1000 1500 2000 2500 3000 0.00
0.20 0.40 0.60 0.80 1.00
IGD
Generation
m−CMA−PAES mean MO−CMA−ES mean
(f)UF1
500 1000 1500 2000 2500 3000 0.00
0.10 0.20 0.30 0.40 0.50
IGD
Generation
m−CMA−PAES mean MO−CMA−ES mean
(g) UF2
500 1000 1500 2000 2500 3000 0.00
0.20 0.40 0.60 0.80
IGD
Generation
m−CMA−PAES mean MO−CMA−ES mean
(h) UF3
Fig. 9 IGD results at each generation visualising performance of m-CMA-PAES and MO-CMA-ES over 300,000 function evaluations on two-objective test problems, 30 runs
of results. The Wilcoxon signed-ranks (Wilcoxon 1945)
non-parametric test (counterpart of the pairedttest) can be used
with the statistical significance value (α=0.05) to rank the
difference in performance between two algorithms over each approximation set.
Nonparametric testing is becoming more commonly used in the literature to statistically contrast the performance of
evolutionary algorithms in many experiments (García et al.
2010; Derrac et al. 2012;Li et al. 2012;Epitropakis et al. 2012;Hatamlou 2013;Civicioglu 2013).
5 Results
The results from the experiments described in Sect.4have
been produced and presented in a number of formats in order to allow for a better assessment of each algorithms perfor-mance.
The worst, mean and best IGD indicator results for the final approximation set of each algorithm are presented in
Table3for the two-objective test functions and in Table4for
[image:12.595.80.508.50.548.2]500 1000 1500 2000 2500 3000 0.04
0.06 0.08 0.10 0.12 0.14
IGD
Generation
m−CMA−PAES mean MO−CMA−ES mean
(a)UF4
500 1000 1500 2000 2500 3000 0.50
1.00 1.50 2.00
IGD
Generation
m−CMA−PAES mean MO−CMA−ES mean
(b) UF5
500 1000 1500 2000 2500 3000 0.00
1.00 2.00 3.00 4.00
IGD
Generation
m−CMA−PAES mean MO−CMA−ES mean
(c)UF6
500 1000 1500 2000 2500 3000 0.00
0.20 0.40 0.60 0.80 1.00
IGD
Generation
m−CMA−PAES mean MO−CMA−ES mean
[image:13.595.80.512.48.300.2](d) UF7
Fig. 10 IGD results at each generation visualising performance of m-CMA-PAES and MO-CMA-ES over 300,000 function evaluations on two-objective test problems, 30 runs
information regarding thepvalue resolved by the Wilcoxon
signed-ranks nonparametric test for the final approximation sets of the considered synthetic test problems, and a
sym-bol indicating the observation of the null hypothesis. A ‘+’
symbol indicates that the null hypothesis was rejected, and m-CMA-PAES displayed statistically superior performance
at the 95 % significance level (α= 0.05) on the considered
synthetic test function. A ‘−’ symbol indicates that the null
hypothesis was rejected, and m-CMA-PAES displayed
sta-tistically inferior performance. An ‘=’ symbol indicates that
there was no statistically significant difference between both of the considered algorithms on the synthetic test problem. The table column ‘%IGD’ indicates the difference in per-formance between m-CMA-PAES and MO-CMA-ES using m-CMA-PAES as the benchmark. This percentage can be calculated by finding the normalised mean performance of each algorithm:
%IGD=100×
meana−wor st
best−wor st −
meanb−wor st
best−wor st
(4)
wheremeana is the mean performance for m-CMA-PAES
meanbis the mean performance for MO-CMA-ES,wor stis
the highest IGD achieved by either algorithm, andbestis the
lowest IGD achieved by either algorithm. A positive %IGD indicates the percentage of which m-CMA-PAES outper-formed MO-CMA-ES, whereas a negative %IGD indicates the percentage of which m-CMA-PAES was outperformed by MO-CMA-ES.
Overall, m-CMA-PAES outperformed MO-CMA-ES on all but 3 (ZDT3, UF6 and UF9) of the 22 test functions, producing better performing worst, mean and best approxi-mation sets.
The mean of the IGD metric at each generation has been
plotted and presented in Figs.9and10for the two-objective
test functions and Figs.11and12for the three-objective test
functions. These plots illustrate the rate of IGD convergence from the initial population to the final population.
m-CMA-PAES significantly outperforms the MO-CMA-ES on most of the test functions used in this comparison. However, as a consequence of investing a percentage of the maximum number of function evaluations in non-elite
solutions, it can be observed in Figs.9,10,11,12that the
convergence of the algorithm is slower in most cases (more so in the two-objective test functions). This suggests that in experiments where the number of function evaluations is not constrained to a low number, the m-CMA-PAES will outper-form MO-CMA-ES.
It can be observed in Figs.9,10,11,12that the mean IGD
250 500 750 1000 0.50
1.00 1.50 2.00 2.50
Generation
IGD
m−CMA−PAES mean MO−CMA−ES mean
(a) UF8
250 500 750 1000 0.50
1.00 1.50 2.00 2.50
Generation
IGD
CMA−PAES mean MO−CMA−ES mean
(b) UF9
250 500 750 1000 2.00
4.00 6.00 8.00 10.00 12.00 14.00
Generation
IGD
m−CMA−PAES mean MO−CMA−ES mean
(c)UF10
250 500 750 1000 5.00
10.00 15.00 20.00 25.00
Generation
IGD
m−CMA−PAES mean MO−CMA−ES mean
(d)DTLZ1
250 500 750 1000 0.05
0.10 0.15
Generation
IGD
m−CMA−PAES mean MO−CMA−ES mean
(e)DTLZ2
250 500 750 1000 60.00
80.00 100.00 120.00
Generation
IGD
m−CMA−PAES mean MO−CMA−ES mean
(f)DTLZ3
250 500 750 1000 0.05
0.10 0.15 0.20
Generation
IGD
m−CMA−PAES mean MO−CMA−ES mean
(g)DTLZ4
250 500 750 1000 0.05
0.10 0.15 0.20 0.25 0.30
Generation
IGD
m−CMA−PAES mean MO−CMA−ES mean
(h) DTLZ5
[image:14.595.79.516.50.564.2]m−CMA−PAES mean
Fig. 11 IGD results at each generation visualising performance of m-CMA-PAES and MO-CMA-ES over 300,000 function evaluations on three-objective test problems, 30 runs
quality of an approximation set once a difficult area of the search space is encountered.
The results presented in Tables3 and4, as well as the
box plots presented in Figs.13and14, show that on 18 of
the 22 considered test functions m-CMA-PAES significantly outperformed MO-CMA-ES in regard to the achieved mean and median IGD. The box plots show that the interquar-tile ranges for the m-CMA-PAES results are significantly better than the interquartile ranges for the MO-CMA-ES
results. Across all test functions m-CMA-PAES produces fewer outliers—indicating a more reliable and robust algo-rithm than MO-CMA-ES on the considered test functions.
On the UF3 test function, it can be observed (in Fig.13)
250 500 750 1000 0.50 1.00 1.50 Generation IGD m−CMA−PAES mean MO−CMA−ES mean
(a)DTLZ6
[image:15.595.79.523.50.172.2]250 500 750 1000 1.00 2.00 3.00 4.00 5.00 6.00 Generation IGD m−CMA−PAES mean MO−CMA−ES mean (b) DTLZ7
Fig. 12 IGD results at each generation visualising performance of m-CMA-PAES and MO-CMA-ES over 300,000 function evaluations on three-objective test problems, 30 runs
7 8 9 10
x 10−3
1 2 ZDT1 0.006 0.008 0.01 0.012 0.014 1 2 ZDT2 5.5 6 6.5
x 10−3
[image:15.595.310.543.219.396.2]1 2 ZDT3 5 10 15 1 2 ZDT4 0.05 0.1 0.15 0.2 1 2 ZDT6 0.04 0.06 0.08 0.1 0.12 1 2 UF1 0.02 0.03 0.04 0.05 1 2 UF2 0.06 0.08 0.1 0.12 1 2 UF3 0.06 0.07 0.08 0.09 1 2 UF4 0.6 0.8 1 1.2 1 2 UF5 0.1 0.15 0.2 1 2 UF6 0.02 0.04 0.06 0.08 0.1 0.12 1 2 UF7
Fig. 13 Box plots of IGD indicator results for two-objective test problems (1: m-CMA-PAES; 2: MO-CMA-ES) 300,000 function eval-uations, 30 runs
also achieves the best approximation set but is outperformed by MO-CMA-ES on the median values of the IGD results.
The MO-CMA-ES significantly outperforms the m-CMA-PAES on UF9. This function (as well as ZDT3 and UF6) consists of disjoint true Pareto optimal fronts as shown in
Fig.15. The comparison in performance on these problems
shows that the m-CMA-PAES has performance issues on some problems consisting of multiple parts in their Pareto optimal fronts.
6 Conclusion
In this paper, a multi-tier AGA scheme has been introduced and incorporated into the CMA-PAES algorithm to create m-CMA-PAES. m-CMA-PAES improves the quality of the produced final approximation set by investing a percent-age of the allowed function evaluation budget in non-elite but potentially successfully solutions. With this approach, m-CMA-PAES is able to find portions of the Pareto opti-mal front which remain unexplored by elitist approaches.
0.15 0.2 0.25 1 2 UF8 0.07 0.075 0.08 0.085 1 2 UF9 1 1.5 2 2.5 3 1 2 UF10 0 5 10 15 20 1 2 DTLZ1 0.04 0.042 0.044 0.046 0.048 1 2 DTLZ2 50 100 150 200 1 2 DTLZ3 0.03 0.04 0.05 0.06 0.07 1 2 DTLZ4 1.5 2 2.5
x 10−3
1 2 DTLZ5 0.2 0.4 0.6 1 2 DTLZ6 0.055 0.06 0.065 0.07 0.075 1 2 DTLZ7
Fig. 14 Box plots of IGD indicator results for three-objective test problems (1: m-CMA-PAES; 2: MO-CMA-ES) 300,000 function eval-uations, 30 runs
Experiments and statistical analysis presented in this study show that with CEC09 competition compliant benchmark-ing configurations, m-CMA-PAES significantly outperforms MO-CMA-ES on all but 4 of the 22 considered synthetic test problems, and out of these 4, MO-CMA-ES only performs statistically significantly better on 2 test functions.
When observing the IGD values at each generation, it can be seen that in some cases the IGD of the final population is higher than some of the generations before it, this is due to the non-elite solutions invested in at each generation being a factor right to the end of the algorithm. This suggests that in further work the algorithm may benefit from either an offline archive which the algorithm selects from at the end of the optimisation process or a final approximation set selection scheme which uses the last two generations of the optimisa-tion process, including non-dominated soluoptimisa-tions only.
[image:15.595.55.289.220.400.2]Fig. 15 True Pareto optimal fronts plotted for problems ZDT3 (left), UF6 (middle) and UF9 (right)
optimisation process, with steady improvement until the end of the function evaluation budget. Unlike MO-CMA-ES, m-CMA-PAES does not subject the entire non-dominated population to the contributing hypervolume indicator. By not doing so, m-CMA-PAES remains computationally light-weight, unlike MO-CMA-ES which becomes computation-ally infeasible as the number of problem objectives increase. By investing a portion of the function evaluation budget in non-elite solutions, areas of the Pareto optimal front which are difficult to obtain can be discovered later on in the opti-misation process. This results in improved diversity and coverage in the produced approximation sets.
Future works will further investigate the possibility for self-adaptation of the m-CMA-PAES algorithm parameter
which defines the budget for non-elite individuals (β). A
current limitation of m-CMA-PAES requires the manual
con-figuration of theβparameter, which may result in inefficient
usage of the function evaluation budget when parameters such as the population size and the number of problem objec-tives change.
Compliance with ethical standards
Conflict of interestThe authors declare that they have no conflict of interest.
Ethical approval This article does not contain any studies with human participants or animals performed by any of the authors.
Open Access This article is distributed under the terms of the Creative Commons Attribution 4.0 International License (http://creativecomm ons.org/licenses/by/4.0/), which permits unrestricted use, distribution, and reproduction in any medium, provided you give appropriate credit to the original author(s) and the source, provide a link to the Creative Commons license, and indicate if changes were made.
References
Auger A, Hansen N (2005) A restart CMA evolution strategy with increasing population size. In: The 2005 IEEE congress on evolu-tionary computation, 2005, IEEE, vol 2, pp 1769–1776
Beyer H, Sendhoff B (2008) Covariance matrix adaptation revisited–the cmsa evolution strategy. In: Parallel problem solving from nature– PPSN X. Springer, Berlin, pp 123–132
Bosman PAN, Thierens D (2003) The balance between proximity and diversity in multiobjective evolutionary algorithms. IEEE Trans Evol Comput 7(2):174–188
Burke E, Kendall G, Newall J, Hart E, Ross P, Schulenburg S (2003) Hyper-heuristics: An emerging direction in modern search technology. In: International series in operations research and man-agement science, pp 457–474
Chen CM, Chen YP, Zhang Q, (2009) Enhancing moea, d with guided mutation and priority update for multi-objective optimization. In: IEEE congress on evolutionary computation, (2009) CEC’09, IEEE, pp 209–216
Civicioglu P (2013) Backtracking search optimization algorithm for numerical optimization problems. Appl Math Comput 219(15):8121–8144
Coello Coello CA, Cortés NC (2005) Solving multiobjective optimiza-tion problems using an artificial immune system. Genet Program Evol Mach 6(2):163–190
Coello Coello CA, Pulido GT (2001) A micro-genetic algorithm for multiobjective optimization. In: Evolutionary multi-criterion opti-mization. Springer, Berlin, pp 126–140
Corne DW, Knowles JD, Oates MJ (2000) The Pareto envelope-based selection algorithm for multiobjective optimization. In: Parallel problem solving from nature PPSN VI. Springer, Berlin, pp 839– 848
De Falco I, Della Cioppa A, Maisto D, Scafuri U, Tarantino E (2012) Biological invasion-inspired migration in distributed evolutionary algorithms. Inf Sci 207:50–65
Deb K (2001) Multi-objective optimization. Multi-objective optimiza-tion using evoluoptimiza-tionary algorithms, pp 13–46
Deb K, Pratap A, Agarwel S, Meyarivan T (2002a) A fast and elitist mul-tiobjective genetic algorithm: NSGA-II. IEEE Trans Evol Comput 6(2):182–197
Deb K, Mohan M, Mishra S (2005) Evaluating theε-domination based multi-objective evolutionary algorithm for a quick computation of Pareto-optimal solutions. Evol Comput 13(4):501–525
Deb K, Goldberg DE (1989) An investigation of niche and species formation in genetic function optimization. In: Schaffer JD (ed) Proceedings of the third international conference on genetic algo-rithms, Morgan Kaufmann, New York, pp 42–50
Deb K, Thiele L, Laumanns M, Zitzler E (2002b) Scalable multi-objective optimization test problems. In: Proceedings of the congress on evolutionary computation (CEC-2002), Honolulu, pp 825–830
compar-ing evolutionary and swarm intelligence algorithms. Swarm Evol Comput 1(1):3–18
Derrac J, Cornelis C, García S, Herrera F (2012) Enhancing evolutionary instance selection algorithms by means of fuzzy rough set based feature selection. Inf Sci 186(1):73–92
Epitropakis M, Plagianakos V, Vrahatis M (2012) Evolving cognitive and social experience in particle swarm optimization through dif-ferential evolution: A hybrid approach. Inf Sci Int J 216:50–92 Fonseca CM, Fleming PJ (1993) Genetic algorithms for multi-objective
optimization: Formulation, discussion and generalization. In: For-rest S (ed) Proceedings of the fifth international conference on genetic algorithms. Morgan Kaufmann, New York, pp 416–423 Fonseca CM, Fleming PJ (1995) Multiobjective genetic algorithms
made easy: Selection, sharing, and mating restriction. In: Zalzala AMS (ed) Proceedings of the first international conference on genetic algorithms in engineering systems: innovations and appli-cations (GALESIA), pp 42–52
García S, Molina D, Lozano M, Herrera F (2009) A study on the use of non-parametric tests for analyzing the evolutionary algorithms behaviour: a case study on the cec2005 special session on real parameter optimization. J Heuristics 15(6):617–644
García S, Fernández A, Luengo J, Herrera F (2010) Advanced nonpara-metric tests for multiple comparisons in the design of experiments in computational intelligence and data mining: Experimental analysis of power. Inf Sci 180(10):2044–2064
Gembicki FW (1974) Vector optimization for control with performance and parameter sensitive indices. PhD thesis, Case Western Reserve University, Cleveland
Goldberg DE (1989) Genetic algorithms in search, optimization and machine learning. Addison-Wesley, Reading
Hansen N, Müller SD, Koumoutsakos P (2003) Reducing the time com-plexity of the derandomized evolution strategy with covariance matrix adaptation (cma-es). Evol Comput 11(1):1–18
Hansen N, Ostermeier A (2001) Completely derandomized self-adaptation in evolution strategies. Evol Comput 9(2):159–195 Hatamlou A (2013) Black hole: a new heuristic optimization approach
for data clustering. Inf Sci 222:175–184
Horn J, Nafpliotis N, Goldberg DE (1994) A niched Pareto genetic algorithm for multiobjective optimization. In: Proceedings of the congress on evolutionary computation (CEC) 1994. IEEE Press, New York, pp 82–87
Hwang CL, Masud ASM (1979) Multiple objective decision making— methods and applications, vol 164, Lecture notes in economics and mathematical systems. Springer, Berlin
Igel C, Hansen N, Roth S (2007) Covariance matrix adaptation for multi-objective optimization. Evol Comput 15(1):1–28
Istin M, Pop F, Cristea V (2011) Higa: Hybrid immune-genetic algo-rithm for dependent task scheduling in large scale distributed systems. In: 10th international symposium on parallel and dis-tributed computing (ISPDC), 2011, IEEE, pp 282–287
Knowles J, Corne D (1999) The pareto archived evolution strategy: A new baseline algorithm for pareto multiobjective optimisation. In: Proceedings of the 1999 congress on evolutionary computation, 1999, CEC 99, IEEE, vol 1
Knowles JD, Corne DW (2000a) Approximating the nondominated front using the Pareto archived evolution strategy. Evol Comput 8(2):149–172
Knowles JD, Corne DW (2000b) Approximating the nondominated front using the Pareto archived evolution strategy. Evol Comput 8(2):149–172
Li K, Kwong S, Cao J, Li M, Zheng J, Shen R (2012) Achieving balance between proximity and diversity in multi-objective evolutionary algorithm. Inf Sci 182(1):220–242
Michalewicz Z, Fogel DB (2000) How to solve it: modern heuristics. Springer, Berlin
Nasir M, Mondal AK, Sengupta S, Das S, Abraham A (2011) An improved multiobjective evolutionary algorithm based on decom-position with fuzzy dominance. In: IEEE congress on evolutionary computation (CEC), 2011, IEEE, pp 765–772
Purshouse RC (2003) On the evolutionary optimisation of many objec-tives. PhD thesis, Department of Automatic Control and Systems Engineering, University of Sheffield, Sheffield, UK, S1 3JD Purshouse RC, Fleming PJ (2007) On the evolutionary optimization of
many conflicting objectives. IEEE Trans Evol Comput 11(6):770– 784
Rostami S (2014) Preference focussed many-objective evolutionary computation. PhD thesis, Manchester Metropolitan University, Manchester
Rostami S, Shenfield A (2012) Cma-paes: Pareto archived evolution strategy using covariance matrix adaptation for multi-objective optimisation. In: Computational intelligence (UKCI), 2012, IEEE, pp 1–8
Rudolph G, Agapie A (2000) Convergence properties of some multi-objective evolutionary algorithms. In: Proceedings of the congress on evolutionary computation (CEC) 2000, IEEE Press, pp 1010– 1016
Sfrent A, Pop F (2015) Asymptotic scheduling for many task computing in big data platforms. Inf Sci 319:71–91
Silverman BW (1986) Density estimation for statistics and data analysis. Chapman and Hall, London
Srinivas N, Deb K (1994) Multiobjective optimization using nondomi-nated sorting in genetic algorithms. Evol Comput 2(3):221–248 Tiwari S, Fadel G, Koch P, Deb K (2009) Performance assessment of
the hybrid archive-based micro genetic algorithm (amga) on the cec09 test problems. In: IEEE congress on evolutionary computa-tion (2009) CEC’09, IEEE, pp 1935–1942
Voß T, Hansen N, Igel C (2010) Improved step size adaptation for the mo-cma-es. In: Proceedings of the 12th annual conference on genetic and evolutionary computation. ACM, New York, pp 487–494
Wang Y, Cai Z, Zhang Q (2011) Differential evolution with compos-ite trial vector generation strategies and control parameters. IEEE Trans Evol Comput 15(1):55–66
Wilcoxon F (1945) Individual comparisons by ranking methods. Bio-metrics Bull 1(6):80–83
Yang Z, Tang K, Yao X (2008) Large scale evolutionary optimization using cooperative coevolution. Inf Sci 178(15):2985–2999 Zamuda A, Brest J, Boskovic B, Zumer V (2007) Differential
evolu-tion for multiobjective optimizaevolu-tion with self adaptaevolu-tion. In: IEEE congress on evolutionary computation, pp 3617–3624
Zhang Q, Zhou A, Jin Y (2008a) Rm-meda: a regularity model-based multiobjective estimation of distribution algorithm. IEEE Trans Evol Comput 12(1):41–63
Zhang Q, Liu W, Tsang E, Virginas B (2010) Expensive multiobjective optimization by moea/d with Gaussian process model. IEEE Trans Evol Comput 14(3):456–474
Zhang Q, Zhou A, Zhao S, Suganthan PN, Liu W, Tiwari S (2008b) Multiobjective optimization test instances for the CEC 2009 spe-cial session and competition. University of Essex, Colchester, UK and Nanyang Technological University, Singapore, Special Ses-sion on Performance Assessment of Multi-Objective Optimization Algorithms, Technical Report
Zitzler E, Laumanns M, Thiele L (2001) SPEA2: improving the strength Pareto evolutionary algorithm. TIK Report 103, TIK Institut fur Technische Informatik und Kommunikationsnetze, Computer Engineering and Networks Laboratory, ETH, Swiss Federal Insti-tute of Technology, Gloriastrasse 35, 8092 Zurich
Zitzler E, Thiele L (1998) An evolutionary algorithm for multiobjective optimization: the strength pareto approach. Citeseer