Probabilistic classification of quality of service in wireless
computer networks
SALAMA, Abdussalam and SAATCHI, Reza
<http://orcid.org/0000-0002-2266-0187>
Available from Sheffield Hallam University Research Archive (SHURA) at:
http://shura.shu.ac.uk/22739/
This document is the author deposited version. You are advised to consult the
publisher's version if you wish to cite from it.
Published version
SALAMA, Abdussalam and SAATCHI, Reza (2018). Probabilistic classification of
quality of service in wireless computer networks. ICT Express.
Copyright and re-use policy
See
http://shura.shu.ac.uk/information.html
Available online at www.sciencedirect.com
ScienceDirect
ICT Express * (2018) 1-4
www.elsevier.com/locate/icte
Probabilistic Classification of Quality of Service in Wireless
Computer Networks
Abdussalam Salama, Reza Saatchi
Materials and Engineering Research Institute, Sheffield Hallam University, Sheffield, UK.
Abstract
There is an increasing reliance on wireless computer networks for communicating various types of time sensitive applications such as voice over internet protocol (VoIP). Quality of service (QoS) can play an important role in wireless computer networks as it can facilitate evaluation of their performance and can provide mechanisms to improve their operation. In this study probabilistic neural network (PNN) and Bayesian classification were developed to process delay, jitter and percentage packet loss ratio for VoIP traffic. Both methods successfully categorized the transmission of VoIP packets into low, medium and high QoS categories but overall the Bayesian approach performed more accurately than PNN. By accurately determining the network's QoS, an improved understanding of its performance is obtained.
Keywords: Quality of service, wireless computer networks, Bayesian classification, probabilistic neural network
1. Introduction
Quality of service (QoS) provides mechanisms to improve the performance of computer networks by facilitating traffic prioritization, resource reservation, traffic shaping and policing, packet scheduling and queue management operations. These operations are increasingly important for effective communication of multimedia traffic. The time sensitive nature of multimedia applications means that when their traffic parameters like delay, jitter and packet loss exceed their bounds, users' experience can become unsatisfactory. Therefore assessing the QoS provided by networks is important to both network users and network service providers for determining how well the transmission requirements of various applications are met and in utilizing approaches to improve network performance. There are however challenges in assessing QoS in multimedia networks. These include high traffic throughput, dynamic behavior of the network, limited resources (such as bandwidth), diversity in applications' transmission requirements and computational requirements of collecting and processing traffic information [1][2][3][4][5][6].
A Voice over Internet Protocol (VoIP) QoS evaluation method that assessed the connection characteristics based on active measurement and Mean Opinion Score (MOS) approach has been reported [7]. The study examined network's performance using the users' opinions of the applications'
quality. Other studies reported effective evaluation of QoS for multimedia services using artificial intelligence. They reported that measured QoS is a good indicator of network operation and resource (e.g. bandwidth) availability [8][9][10].
QoS assessment based on analyzing traffic parameters is quantitative but requires tools to process and interpret end-to-end transmission measurements for the packets [11]. An example of such a tool that showed potential for QoS assessment in wired and wireless networks is artificial neural network (ANN). An advanced QoS assessment approach that used ANNs for real time protocol (RTP) traffic analysis has been reported [10][12]. In these studies communication networks were simulated using a package called NS2. The parameters of the network traffic were initially classified into multiple QoS classes by an unsupervised learning Kohonen neural network. The classified information was then further processed to measure the network's overall QoS by a supervised learning multilayer perceptron (MLP). The overall QoS assessed by the approach correlated well with other QoS assessment techniques that used fuzzy logic and regression analysis [10][12].
A comparison of Kohonen neural network, fuzzy c-means (FCM) clustering and MLP and fuzzy inference system (FIS) for QoS evaluation has been carried out, demonstrating they provide comparable results [8]. QoS assessments methods reported in studies [8][9][10][12] were based on either Kohonen neural network, FCM, MLP or fuzzy inference system (FIS). In FCM a piece of data can simultaneously belong to multiple clusters with different degrees of
https://doi.org/10.1016/j.icte.2018.01.001
2405-9595/ c 2017 The Korean Institute of Communications and Information Sciences. Publishing Services by Elsevier B.V. This is an open access article under the CC BY-NC-ND license (http://creativecommons.org/lice*nses/by-nc-nd/4.0/).
*A. Salama [email protected]. [email protected]
memberships rather than exclusively to a single cluster. A limitation of FCM is that its operation (and thus its results) can be affected by its initial start-up conditions and parameters. Its training is also iterative and this can be an issue in real-time operations. FIS based approach requires the user to develop the rules for its knowledge base and to determine the types and parameters of the membership functions for its inputs and outputs. The rules and membership functions' parameters are specific to the applications. MLP and Kohonen network based QoS assessment approaches need much iteration to train (1000 iterations in Ref. [8]). MLP design requires a careful determination of the number of neurons in its hidden layer to avoid overfitting and to ensure proper generalization. Kohonen output is a map that requires interpretation by the user to determine groupings. Linear regression assumes the interrelationships between the inputs and outputs are linear.
Probabilistic approaches have been applied to a number of classification related network operations [11]. Some of these approaches used the information extracted from packet-header that may not be sufficient to allow for an accurate QoS analysis. A number of Bayesian techniques were developed to classify internet traffic [11] and to assess QoS for Web services [13][14]. A Bayesian approach that gathered information about malicious users has been reported [15]. A Bayesian decision-theoretic mechanism for modelling Quality of Experience (QoE) has been reported that addressed the measurement and prediction issues related to network traffic [16]. The parameters used for determining QoE included location, packet loss ratio, delay, jitter and the user satisfaction. The technique was context-aware and predicted QoE with an overall accuracy of 98.9%. An intelligent adaptive prioritization has proved effective for QoS differentiation in wireless local area networks [17]. Bayesian network classifiers as predictive models were proposed for network intrusion detection but they showed some downsides [18]. The training data for Bayesian network classifiers often use heuristic methods. Bayesian network classifiers are typically trained using large datasets thus making their training time consuming. However, when the training data size is small, the performance of a single Bayesian network classifier could significantly reduce due to its inability to adequately represent the input data probability distribution. A method to deal with the limitations of Bayesian networks has been developed [18]. The method was referred to as Bayesian Network Model Averaging (BNMA) classifier. The training data used to evaluate BNMA classifier were from the NSL-KDD dataset. Their results showed that BNMA classifier performed considerably better in detection accuracy than the Naive Bayes and Bayesian network classifiers. The work showed that the BNMA classifier using a smaller training dataset outperformed the two other classifiers. Bayesian approaches for monitoring and predicting mobile network abnormality [19] and ANNs for network intrusion detection [20] were reported.
In this study Bayesian and probabilistic neural network (PNN) based approaches were developed to classify QoS for transmission of VoIP packets into low, medium and high
categories. These QoS assessment approaches only need a single iteration to train or calibrate. They have minimal parameters as part of their operation, e.g. PNN only needs the smoothing parameter and the Bayesian approach requires the prior probability value. They were adapted to assess QoS for VoIP with minimal development constraints.
In the following sections, a brief description of Bayesian classification and PNN are provided, the methodology is explained and the results are presented and discussed.
2. Bayesian classification
Bayesian classification is a supervised learning method that deals with uncertainty through probabilities with applications such as classification, prediction and modelling. Bayesian classification allows apriori information about data to be used as part of classification [21][22][23]. Bayes' theorem uses the knowledge of prior events as part of determining future events, i.e.
( ) ( ) ( )
( ) p e h p h p h e
p e
(1)
where p(h) is the prior probability of hypothesis h, p(e) is the prior probability of evidence e, p(h|e) is the probability of h
given e, p(e|h) is the probability of e given h. Using Bayes' theorem the probability that a feature vector X with parameter vector θ is assigned to a type t1 is given by
1 1 1 ( ) ( , ) ( , ) ( )
p t p t p t p X X X (2)
where p(t1) is the prior probability of type t1, p(X|t1,θ) is the
probability density function of X for a given type t1 and n is
number of types. The total probability is
1
( )
t tn(
, ) ( )
t t
p
p
t
p t
X
X
(3)
Equation 2 can then be written as
1 1 1 1 ( ) ( , ) ( , ) ( , ) ( ) n t t t t
p t p t p t
p t p t X X X (4)
θ is unknown but the calibration data set (Z) is known and so p(X|t,θ) can be replaced by q(X|t,Z) [24], where
( , ) ( , ) ( )
q X t
p X t p Z d
(5)
So Equation 4 becomes
1 1 1 1 ( ) ( , ) ( , ) ( , ) ( ) n t t t t
Equation 6 is the predictive density function for an observation X on a case of type t measured on the calibration data Z. The right-hand side of Equation 5 can be rewritten by [24]
1 ( , ) d t, t, 1 t
t
q t t v
n
X S m S
(7)
where there are nt cases of type t with observation vectors x1, x2..., xnt; vt is the degrees of freedom (given by nt - 1), mtis the
vector of the means of the input features and St the covariance
matrix of the inputs. Std is a d-dimensional student-type
density function defined by
0.5 1 0.5( 1)
0.5 ( , , )
[0.5( 1)] 1
[1 ( ) ( ) ( ) [0.5( 1)] d T v d t v v v v d v
S b c
X b c X b
c (8)
where Γ is the gamma function. Thus using Equation 8 the required values of p(X|t,θ) can be computed for the case of known type. To compute the probabilities for the test or evaluation data set, Equation 8 uses the observation vector X
for the cases of known type but retains the mean and covariance matrices (i.e. calibration information) for the classification of cases whose types are not known.
In order to further interpret the Bayesian classification results, the atypicality index can be calculated. High value of this index for a case indicates that the case is not typical of that type. The atypicality index for a type t and an observation vector X is given by [24] as
2 ( ) ( ) , ; 1 2 2 ( ) t t t t t
n d w
d A t n w n X X
(9)
where
𝑤𝑡(𝑿) = (𝑿 − 𝒎𝑡)𝑇𝑺𝑡−1 (𝑿 − 𝒎𝑡) (10)
β indicates the incomplete beta function measured according to the algorithm of [25] and nt is the number of individuals of
type t.
3. Probabilistic neural network
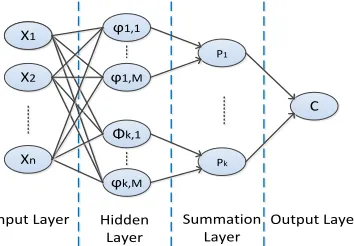
PNN maps an input feature vector to a number of predefined classification types. It does not have any local minima issue. PNN is a supervised learning feedforward artificial neural network introduced by Specht [20]. It is predominantly a classifier based on a statistical algorithm called kernel discriminate analysis. PNN training requires examples of known types in order for it to infer the approximated functions that best describe its input data [26]. The main advantages of PNN are: its fast training, an essentially parallel structure and convergence to optimal classifiers by increasing training examples.
PNN is related to Bayes classification rules [20] and Parzen nonparametric probability density function estimation theory [26]. As shown in Figure 1, PNN has four layers; input, pattern (also referred to as hidden), summation layer and output. X1 X1 X2 Xn ϕ1,1 ϕ1,M Φk,1 ϕk,M P1 Pk C
Input Layer Hidden Layer
Summation Layer
[image:4.596.353.530.120.243.2]Output Layer
Figure 1. A probabilistic artificial neural network
An input feature vector is fed to the n input neurons. The input layer forwards these to the neurons in the pattern layer where they are divided into k classification types. The neurons in the pattern layer compute the outputs of an input pattern x
from the input layer by using a Gaussian kernel of the form:
2 ,
, 2 / 2 2
1 exp
2 2
k i
k i n
x x
(11)
where
x
ki
R
n is the center of the kernel, and
is known as the smoothing (spread) parameter which specifies the size of the kernel's receptive field. The next layer (the summation layer) sums the outputs individually for each group and provides the probabilities for the input to belong to the predefined groups by combining the previously added densities as,𝑝𝑘(𝑥) = ∑𝑀𝑖=1𝑘𝑤𝑘𝑖𝜑𝑘𝑖(𝑥) 𝑘 = 1, … , 𝑛𝑢𝑚𝑏𝑒𝑟 𝑜𝑓 𝑔𝑟𝑜𝑢𝑝𝑠 (12)
where Mk is the number of neurons in the pattern layer of type k and wki are positive coefficients satisfying ∑ 𝑤𝑘𝑖
𝑀𝑘
𝑖=1 = 1.
The neuron at the output layer determines the category or type of the input vector (x) based on Bayes' decision rule and using the information from the neurons in the summation layer, i.e.
( ) arg ( k)
C x max1 k K p (13)
The smoothing parameter needs to be specified as part of PNN's training.
4. Methodology
AIR-AP1852 that had four external dual-band antennae. Cisco© catalyst 3560 switch connected the APs, Wide Area Network Emulator (WANem) and the Session Initiation Protocol (SIP) server via 1 Giga bits per second (Gbps) wired cables.
AP-1 AP-2
switch
SIP Server PC-1
WANem
PC-2
[image:5.596.54.274.119.233.2]PPP links GE link
Figure 2. Network topology
The arrangement established point-to-point protocol (PPP) link between the PC-1 that connected to AP-1 and PC-2 that connected to AP-2. Wide Area Network Emulator (WANem) was installed at the center of the PPP connection to facilitate control over the traffic parameters i.e. delay, jitter and %PLR and thus to provide good, medium and poor QoS conditions for measurements. The traffic was sent over this PPP link in such a way that traffic from PC-1 transmitted to PC-2 through WANem server and vice versa. The traffic contained high definition (HD) video, VoIP and TCP traffic. Different traffic to represent practical scenarios was included but VoIP and the Real-Time Transport Protocol (RTP) packets were analyzed.
VoIP transmission was established by the Session Initiation Protocol (SIP) server and used the RTP. X-Lite Softphones software ran over the Microsoft Windows© providing SIP VoIP using G711a coder-decoder (CODEC) format. Packet size for RTP was 160 bytes and the transmission duration was about 10 minutes.
[image:5.596.324.544.189.405.2]Wireshark© [27] network monitoring software was used to capture network packets by considering their protocols. Wireshark© was configured on two computers, PC-1 connected to AP-1 and on PC-2 connected to AP-2. These Wireshark captured packets were used to measure end-to-end delay, jitter and percentage packet loss ratio for VoIP RTP packets (by using their sequence numbers and timestamps). The results were then processed by the QoS classification methods (PNN and Bayesian). For both Bayesian and PNN approaches, example patterns consisted of 300 entries that were extracted from recorded data based on ITU recommendations indicated in Table 1.
Table 1. VoIP QoS requirements [7]
QoS range Delay (ms) Jitter (ms) %PLR High <150 <1 <2 Medium 150-400 1-3 2-4 Low >400 >3 >4
Both Bayesian and PNN approaches provided the probability of transmitted packet to belong to low, medium
and high QoS. The implementations of these approaches are described next.
4.1Bayesian Approach
The Bayesian approach processed input vectors containing the values for delay, jitter and %PLR for transmitted packets and produced an output indicating the QoS category. The algorithm for the Bayesian approach consisted of three parallel paths that were associated with low, medium and high QoS categories as shown in Figure 3.
Start
Start
BC-1. Bayesian classifier for Low QoS
BC-1. Bayesian
classifier for Low QoS classifier, Medium QoS BC-2. Bayesian
BC-2. Bayesian classifier, Medium QoS
Measure delay, jitter and %PLR
Measure delay, jitter and %PLR
Classify packets based on the largest probability value
Classify packets based on the largest probability value
End
End
Transmission end ?
Transmission end ?
Capture traffic packets
Capture traffic packets
Examples of Low/ not Low QoS
Examples of High/ not High QoS
Map the probability value low: 0-0.33, medium: 0.34-0.65, high: 0.66-1
Map the probability value low: 0-0.33, medium: 0.34-0.65, high: 0.66-1
Determine probabilities to low, medium and high QoS
Determine probabilities to low, medium and high QoS
No
No
Yes
Yes
Calibration
{
Calibration
{
BC-3. Bayesian classifier for High QoS Examples of Medium/
not Medium QoS
Figure 3. Flow chart for the Bayesian approach
Three lists of calibration examples were prepared based on Table 1 which included 300 entries for training file. These represented different delay, jitter and %PLR values characterizing low, medium high QoS categories. Figure 3 indicates the manner traffic measures were associated to each QoS type. When a packet strongly belonged to a category (e.g. low QoS, represented by BC-1 route) then the associated probability was close to 1. The same operations are followed for BC-2 (medium QoS) and BC-3 (high QoS). BC-1 used the examples from the low and not low QoS list, BC-2 used the examples from the medium and not medium QoS list and BC-3 used the examples from the high and not high QoS list. Each path provided a probability value between 0 and 1. High values of probability indicated QoS associated with that path. In order to have a continuous range between 0 and 1 for the three paths combined, the outputs from the paths were mapped as: 0 to 0.33 for low QoS packets classified through BC-1 path, 0.34 to 0.65 for medium QoS packets classified through BC-2 path and 0.66 to 1 for high QoS packets classified through BC-3 path.
The test file contained VoIP transmission parameters
X=(x1=delay, x2=jitter, x3=%PLR) in Equations in section 2
for traffic that lasted for about 10 minutes.
[image:5.596.78.244.664.708.2]The PNN structure shown in Figure 1 was used with three inputs; delay, jitter and %PLR. The training (calibration) contained 300 examples that characterized a range of delay, jitter and %PLR for different QoS categories. As PNN is a supervised learning classifier for each example in the training file the corresponding QoS type (1=low, 2=medium and 3=high) were specified. When the value of the parameter (spread) was near zero, the PNN acted as a nearest neighbor classifier. In this study the value of spread (
) in Equation 11 was chosen 0.01 by experimenting with different values and considering the PNN classifying performance on examples from the training file.The test file contained VoIP transmission parameters
X=(x1=delay, x2=jitter, x3=%PLR) in Equations 11-13 for
traffic that lasted for about 10 minutes.
5. Results and discussion
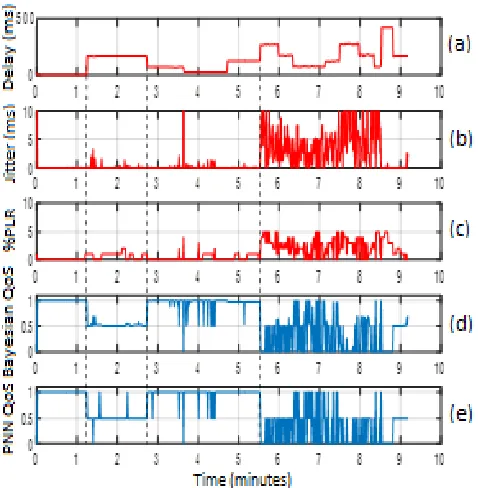
Figures 4 a, b and c show the measurements from the network, i.e. actual delay, jitter and %PLR, for VoIP RTP traffic. The related traffic was produced by using WANem. Figures 4d and e show the QoS outputs for the Bayesian and PNN approaches respectively. At the beginning the QoS was high as delay, jitter and %PLR were small. This is then followed by medium QoS at minute 1.2. At minute 2.8, the QoS started to become high again. From minute 5.5, the QoS fluctuated between high, medium and low in relation to the changes in the delay, jitter and %PLR.
Figure 4. (a) delay, (b) jitter, (c) %PLR, (d) QoS classification by Bayesian and (e) QoS classification by PNN.
Figures 5a and b show the QoS classification boxplots for the Bayesian and PNN approaches. The median values (shown by the bar inside each box), for the three types of QoS for the two approaches are close. The median value for the high QoS
is at minute 3.5, the median for the medium QoS is at minute 4.2 and the median for the low QoS is at minute 7.8. Both methods have outlier packets for the low QoS between 0 and 4 minutes.
[image:6.596.326.547.106.256.2](a) (b)
Figure 5. QoS boxplot for (a) Bayesian (b) PNN
Figures 6 a and b provide further details about the classification of packets for the Bayesian and PNN approaches. The two methods provide consistent results however there are some differences, e.g. between 1.5 and 2.5 minutes, PNN has classified some packets into high QoS while Bayesian has classified them as Medium QoS.
[image:6.596.325.564.368.564.2](a) (b)
Figure 6. Packet classification (a) Bayesian (b) PNN
[image:6.596.54.293.401.645.2](a) (b)
Figure 7. Relationship between delay and QoS classification for (a) Bayesian (b) PNN approaches
[image:7.596.88.233.396.446.2]Table 2 shows the percentage of packets classed as low, medium and high QoS by the Bayesian and PNN approaches using ITU recommendations as reference. The results show that the Bayesian approach has a higher accuracy for QoS classification as compared to PNN. The reasons for this could partly be due to the predefined paths associated with the Bayesian approach facilitating more specific examples during its training (as indicated in Figure 3).
Table 2. Percentage of packets classed as high, medium and low QoS by PNN and Bayesian methods
QoS category %Classification accuracy Bayesian PNN High 99.7 97.9 Medium 98.6 97.3 Low 100 94.9
Figures 8 a-c show the atypicality index (obtained using Equation 9) for the Bayesian classifier for the packets in the test file associated with paths BC-1, BC-2 and BC-3 respectively. These also correspond to the flow chart shown in Figure 3. This index indicates the extent a traffic vector represented by delay, jitter, and %PLR, and characterizes a QoS type, i.e. low, medium and high. A high atypicality index value indicates the traffic vector is not typical of that QoS category and so a misclassification could then be attributed not to the classifier but to the appropriateness of the input. The blue colored circles in Figure 8a-c represents packets that belong to BC-1, BC-2 and BC-3 respectively, i.e. low, medium and high QoS. These packets have high probability and low atypicality index indicating correct classification. The red colored circles in Figure 8a-c represents packets that do not belong to BC-1, BC-2 and BC-3 respectively. They have low probability and high atypicality index. The black colored circles in Figure 8a-c represents packets that are misclassified. These have high probability and high atypicality index. Combining the blue colored circles in Figures 8 a-c in a single figure with their associated times, will provide consistent results to those in Figures 4 d and e.
(a) (b)
(c)
Figures 8 Atypicality index plots for the Bayesian classifier for (a) low (BC-1), (b) medium (BC-2) and (c) high QoS (BC-3). Blue colored points represent packets with high probabilities and low atypicality indices. Red colored points represent packets with low
probabilities and high atypicality indices, black colored points represent packets with high probability and are not typical to this
class.
6.Conclusion
Bayesian and PNN based QoS classification approaches for VoIP (RTP) traffic were developed and their performance was evaluated. The methods were applied to a laboratory based wireless network. Experimental results illustrated that both classification approaches are effective in categorizing VoIP related packets into high, medium or low QoS. However, the Bayesian approach gave a higher accuracy for classifying packets than PNN. The effectiveness of the developed methods was further tested using an atypicality index that confirmed the classified packet belonged to the suggested categories.
Conflict of interest
The authors declare that there is no conflict of interest in this paper.
References
[1] H. Nourikhah and K. A. Mohammad, "Impact of service quality on user satisfaction: Modeling and estimating distribution of quality of experience using Bayesian data analysis," Electronic Commerce Research and Applications 17: 112-122, 2016.
[2] A. Kazem, A. Pourhaji, H. Pedram, and H. Abolhassani, "BNQM: a Bayesian network based QoS model for grid service composition," Expert Systems with Applications 42(20): 6828-6843, 2015.
regression model'', In: 2017 4th International Conference on Mathematics and Computers in Science in Industry, MCSI 2017, Island, Greece, August. IEEE.(In Press), 24-26, 2017.
[4] A. Salama, R. Saatchi and D. Burke, ''Adaptive sampling technique using regression modelling and fuzzy inference system for network traffic'', In: CUDD, Peter and DE WITTE, Luc, (eds.) Harnessing the power of technology to improve lives. Studies in Health Technology and Informatics (242).IOS Press, 592-599, 2017.
[5] A. Salama, R. Saatchi, and Derek Burke, "Adaptive sampling for QoS traffic parameters using fuzzy system and regression model."Mathematical Models and Methods in Applied Sciences, 2017.
[6] A. Salama, R. Saatchi, and Derek Burke, "Fuzzy Logic and Regression Approaches for Adaptive Sampling of Multimedia Traffic in Wireless Computer Networks", Technologies 6(1). 24, 1-17, (2018).
[7] T. Mansouri, A. Nabavi, A. Z. Ravasan, and H. Ahangarbahan, ''A practical model for ensemble estimation of QoS and QoE in VoIP services via fuzzy inference systems and fuzzy evidence theory,'' Telecommunication Systems, 61(4), 861-873, 2016.
[8] A. Salama, R. Saatchi, and D.k Burke, "Quality of Service Evaluation and Assessment Methods in Wireless Networks," In 4th International Conference on Information and Communication Technologies for Disaster Management, ICT-DM, Munster, Germany, December, IEEE, 11-13, 2017.
[9] A. Dogman, R. Saatchi, and S. Al-Khayatt, ''Quality of service using a combination of fuzzy c-means and regression model,'' International Journal of Electronics and Electrical Engineering, 6, 58-65, 2012.
[10] A. Dogman and R. Saatchi, ''Multimedia traffic quality of service management using statistical and artificial intelligence techniques,'' IET Circuits Devices & Systems, 8(5), 367-377, 2014.
[11] A. W. Moore and D. Zuev, "Internet traffic classification using Bayesian analysis techniques," ACM SIGMETRICS Performance Evaluation Review. 33(1), ACM, 2005.
[12] A. Dogman, R. Saatchi, and S. Al-Khayatt, ''Evaluation of computer network quality of service using neural networks,'' In Business, Engineering and Industrial Applications (ISBEIA), IEEE Symposium on, 217-222, 2012. [13] K. Xu, "Web service QoS measure approach based on Bayesian networks," Uncertainty Reasoning and Knowledge Engineering (URKE), 2012 2nd International Conference on. IEEE, 2012.
[14] Z. Z. Liu, Z. P. Jia, X. Xue, and J. Y. An, ''Reliable Web service
composition based on QoS dynamic prediction,'' Soft Computing, 19(5), 1409-1425, 2015.
[15] A. K. Chorppath, T. Alpcan, and H. Boche, "Bayesian mechanisms and detection methods for wireless network with malicious users," IEEE Transactions on Mobile Computing, 15(10), 2452-2465, 2016.
[16] K. Mitra, A. Zaslavsky, and C. Åhlund, "Context-aware QoE modelling, measurement, and prediction in mobile computing systems," IEEE Transactions on Mobile Computing 14(5), 920-936, 2015.
[17] Z. Yuan, ''Quality of service differentiation for multimedia delivery in wireless LANs,'' Doctoral dissertation, Dublin City University, 2012. [18] L. Xiao, Y. Chen, and C. K. Chang, ''Bayesian model averaging of Bayesian network classifiers for intrusion detection,'' In Computer Software and Applications Conference Workshops (COMPSACW), IEEE 38th International,128-133. IEEE, 2014.
[19] Y. Lai, Y. Chen, Z. Liu, Z. Yang, and X. Li, ''On monitoring and predicting mobile network traffic abnormality,'' Simulation Modelling Practice and Theory, 50, 176-188, 2015.
[20] M. G. Raman, N. Somu, K. Kirthivasan, and V. S. Sriram, ''A hypergraph and arithmetic residue-based probabilistic neural network for classification in intrusion detection systems,'' Neural Networks, 92, 89-97, 2015.
[21] I. Ben-Gal, F. Ruggeri, F. Faltin, and R. Kenett,''Bayesian networks, encyclopedia of statistics in quality and reliability,'' 2007.
[22] F. Taroni, C. G. Aitken, P. Garbolino, and A. Biedermann, ''Bayesian networks and probabilistic inference in forensic science'' (p. 372), Chichester: Wiley, 2007.
[23] F. V. Jensen, ''An introduction to Bayesian networks,'' Vol. (210), London: UCL press, 1996.
[24] M.R. Saatchi, S. Oke, E. M. Allen, B. W. Jervis, and N. Hudson, ''Signal processing of the contingent negative variation in schizophrenia using multilayer perceptrons and predictive statistical diagnosis,'' IEE Proceedings-Science, Measurement and Technology, 142(4), 269-276, 1995.
[25] K. L. Majumder and G. P. Bhattacharjee, "Algorithm AS 63: The incomplete beta integral," Journal of the Royal Statistical Society, Series C (Applied Statistics) 22(3), 409-411, 1973.
[26] D. F. Specht, "Probabilistic neural networks," Neural networks 3(1), 109-118, 1990.