Fermented liquid feed for weaned piglets: impact
of sedimentation in the feed slurry on performance
and gut parameters
J.A.M. Missotten
1, J. Michiels
1,2, A. Ovyn
1, S. De Smet
1, N.A. Dierick
11Laboratory for Animal Nutrition and Animal Product Quality, Department of Animal
Production, Ghent University, Melle, Belgium
2Department of Applied Biosciences, Ghent University, Ghent, Belgium
ABSTRACT: In two experiments with weaned piglets, the effects of fermented liquid feed (FLF) (produced with probiotic strain Pediococcus acidilactici, Bactocell®, Lallemand S.A.S.) on performance and some
bacte-riological and morpho-histological parameters of the gut were investigated, and the impact of sedimentation of the solids in the FLF thereon. In experiment I, FLF or the same dry feed (DRY) was offered ad libitum for 28 days to two groups of 15 weaned piglets (28 days of age) each (3 replicates of 5 pigs). Performance was nega-tively affected by feeding FLF and concomitant with that the group fed the FLF diet showed shorter villi (501 vs 550 µm) and smaller crypts (264 vs 289 µm) in the small intestine at 3 m proximal to the caecum (P < 0.05). It was assumed that these poorer results were due to sedimentation of the solids in the FLF and therefore a second experiment was conducted with sepiolite (10 g/kg) added to the feeds. Sepiolite tends to slow down the segregation of particles in slurry. The three feeding groups (weaned piglets, 27 days of age) in this experiment were DRY, DRY with probiotic (DRY+), and FLF. The group fed FLF (body weight gain (BWG) 254 g/piglet/day; feed : gain ratio 1.38) did now perform better (P < 0.05) than the groups fed the DRY (BWG 184 g/piglet/day; feed : gain ratio 1.52) and DRY+ (BWG 185 g/piglet/day; feed : gain ratio 1.48) diets, which did not differ. Villus length in the small intestine at 3 m proximal to the caecum was also higher for the group fed FLF (558 µm) compared with the group fed the DRY+ diet (490 µm; P < 0.05). It was concluded that feeding FLF is beneficial to freshly weaned piglets on condition that sedimentation of the solids in the feed slurry can be controlled.
Keywords: probiotic; wet feed; pig; sepiolite; performance; gut flora; gut morpho-histology
INTRODUCTION
The use of fermented liquid feed (FLF) for weaned piglets has two intrinsic advantages. First, the simul-taneous provision of feed and water may improve the transition from the sow milk to solid feed and may also reduce the time spent to find both sources of nutrients (Brooks and Tsourgiannis 2003). Sec-ondly, offering FLF with a low pH may increase the potential of the stomach as the first line of defence against possible pathogenic infections. This is impor-tant since the gastric acid production and immune system of the young pig is not fully mature (Jensen and Mikkelsen 1998; Brooks et al. 2001; Brooks 2008; Plumed-Ferrer and Von Wright 2009).
In recent reviews the potential of FLF has been discussed (Brooks 2008; Niba et al. 2009; Plumed-Ferrer and Von Wright 2009; Missotten et al. 2010; Canibe and Jensen 2012). While FLF is often stated as an ideal feed for weaned piglets (Scholten et al. 1999), the results obtained so far are rather variable, but in general show a better body weight gain and worse feed/gain ratio for the piglets (Jen-sen and Mikkel(Jen-sen 1998; Plumed-Ferrer and Von Wright 2009).
Results from two experiments with freshly weaned piglets fed FLF, inoculated with a probiotic Bactocell®, compared with dry feed, supplemented
FLF slurry occurred in the trough, resulting in a proportional higher uptake of water from the FLF and poor performances of the piglets, in Experi-ment II sediExperi-mentation was hindered by adding 10 g/kg sepiolite to the feed. The currently au-thorized maximum content for sepiolite in animal feed in the European Union is 20 g/kg complete feed and is considered safe for all animal species. However, up to now it has not been authorized as a food or feed additive (European Food Safety Authority 2013). In addition to performance of the animals, physiological, bacteriological, and morpho-histological parameters measured in the gut were investigated.
MATERIAL AND METHODS
Experimental design: animals, feed, and sam-pling of the FLF.The animal experiments were conducted according to the guidelines of the Ethical Committee of the Faculty of Veterinary Sciences and Bioscience Engineering of Ghent University.
In Experiment I, thirty piglets from a commercial farm (weaned at 28 days of age, initial BW 7.9 ± 1.0 kg) were allocated to 6 pens (2.32 m²) per 5 bar-rows each according to live weight. Piglets were fed the weaner diet (DRY, 3 pens) or fermented liquid feed (FLF, 3 pens). In Experiment II, forty-five piglets from the same commercial farm (weaned at 27 days of age, initial BW 6.3 ± 1.2 kg) were allocated to 9 pens per 5 barrows each according to live weight. Piglets received the same weaner diet as in Experiment I (DRY, 3 pens), or DRY + Bactocell® (DRY+, 3 pens)
or FLF produced with DRY+ diet (3 pens). All groups had free access to water from water nipple drink-ers and were fed ad libitum twice daily (at 9.00 and 17.00 h). Feed refusals were removed and weighed every morning for the groups fed FLF and weekly for the groups fed DRY or DRY+.
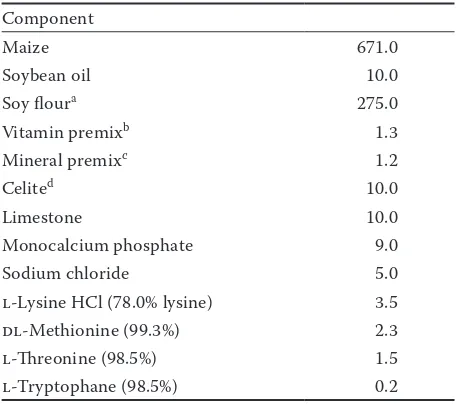
A complete weaner diet, consisting mainly of maize and soybean meal (67.1 and 27.5%, respec-tively – Table 1), free of organic acids and with no Cu or Zn added beyond requirements, was used. In Experiment I, the FLF was inoculated on days 0, 1, 2, 24, 25, and 26 with 2.88 g Bacto-cell® (Batch 6412075, Lallemand S.A.S., Toulouse,
France), providing a concentration of 5.5 log10 CFU
Pediococcus acidilactici (CNCM MA 18/5M)/ml FLF. In this way, Bactocell® was applied at the
level of 9 log10 CFU/kg dry feed, as recommended for the use in pigs (Commission Regulation (EC)
No. 2036/2005). This inoculation was not necessary for Experiment II, where the FLF was produced with the DRY+ feed which already contained Bactocell®
(Batch 6413013) at the recommended use level for pigs in the EU.
In both experiments, the FLF was produced in a 1 : 2.5 ratio of feed : water in a Batch Pasteur (150 l, Packo Inox n.v., Zedelgem, Belgium) kept at 30 ± 0.8°C and continuously stirred at 29 rpm. The fermentation was started by mixing the water with the feed, together with the Bactocell® product for
Experiment I, at 9.00 h the day before the arrival of the piglets. Every morning, half of the content was withdrawn and replenished (“backslopping”) with the remainder serving as inoculant for the freshly added feed plus water.
[image:2.595.304.532.125.327.2]In Experiment II, 10 g/kg sepiolite (SPLF, Grupo Tolsa S.A., Madrid, Spain) was included in the same weaner feed at the expense of maize. Sepiolite is a clay mineral that increases the fluidity and ho-mogeneity of the liquid feed slurry.
Table 1. Ingredient composition of the experimental diet (g/kg)
Component
Maize 671.0
Soybean oil 10.0
Soy floura 275.0
Vitamin premixb 1.3
Mineral premixc 1.2
Celited 10.0
Limestone 10.0
Monocalcium phosphate 9.0
Sodium chloride 5.0
l-Lysine HCl (78.0% lysine) 3.5
dl-Methionine (99.3%) 2.3
l-Threonine (98.5%) 1.5
l-Tryptophane (98.5%) 0.2
aProvasoy flour (Cerestar,Brussek, Belgium)
bconcentration of major components per kg feed:
vita-mins: A 17 355.0 IU/kg, D3 2314.0 IU/kg, E 55.250 mg/kg (60 647.6 IU/kg), K3 1.8876 mg/kg, B1 1.7394 mg/kg, B2 6.2399 mg/kg, B3 20.7675 mg/kg, B6 3.380 mg/kg, B12 49.6353 mg/kg; niacine 32.4999 mg/kg, ethoxyquine 7.800 mg/kg, BHT 11.6999 mg/kg
cconcentration of minerals per kg feed (in mg/kg): Fe 122.424,
Cu 10.0044, Zn 99.9552, Mn 80.0544, I 0.9672, Co 1.008, Se 0.3504
Samples from the FLF tank were taken on day 0 at 0.00, 4.00, and 8.00 h, and on days 1, 2, 3, 4, 8, 15, 22, and 27. Each sample was taken before replenishment of the FLF. Samples for plate count-ings were taken, together with samples for mea-suring the content of alcohol, volatile fatty acids (VFA) and lactic acid, which were acidified with 2% 6 mol/l H2SO4. The pH was measured daily, with a calibrated pH-electrode (pH 315i-meter with a SenTix 41 electrode; WTW Wissenschaftlich, Welheim, Germany) before and after replenishing.
Performance parameters. On days 0, 8, 15, 22, and 28 of both experiments the piglets were weighed individually and feed intake was recorded at the pen level for the past period. For the piglets fed the dry diets (DRY and DRY+), feed intake was expressed as dry matter (DM) intake by taking into account the DM content of the feed. For the piglets fed FLF, the DM intake was determined by taking into ac-count the weight and DM content of the FLF given and of the feed left (in the morning) in the trough. In this way, the DM intake, body weight gain, and feed : gain ratio (calculated with DM intake) could be calculated for the different time periods. The DM was determined by freeze drying the samples.
Sampling during trial and at slaughter
Sampling of faeces during trial. On days 8, 15, and 22, pooled faeces samples were collected from the pens and used for bacteriological analysis and DM determination. The consistency of the fae-ces was recorded every day during the trial on a 3-point scale (1 = normal, 2 = soft, 3 = diarrhoea) for each piglet.
Sampling of the gastro-intestinal tract at slaugh-ter. On day 28 of the experiments, three piglets (non-fasted) per pen were sacrificed (the lightest, heaviest, and the middle one by weight, as meas-ured in the morning). Their gastrointestinal tract (GIT) was completely removed and the contents of the stomach, the first 3 m and the last 3 m of the small intestine (segments denominated as SI1 and SI2, respectively), the caecum and the colon (last 25 cm) were sampled. The weights and the pH of the different contents were recorded, with the exception of the pH of the colon content. The contents were divided in a subsample of 10 g (acidi-fied with 2% 6 mol/l H2SO4) for fatty acid analy-sis, a subsample of 1 g for determining microbial counts, and the rest was used for determination of the DM content. For the morpho-histological parameters, the small intestine was sampled at
3 m distally from the stomach (SI1 site) and at 3 m proximally to the caecum (SI2 site).
Bacteriological measurements. Plate counts were performed according to the ring-plate tech-nique described by Van der Heyde and Henderickx (1963). Plates of Reinforced Clostridial agar (RCM, total anaerobes), Rogosa (Lactobacillus spp.), and de Man, Rogosa, Sharpe agar (MRS, total lactic acid bacteria (LAB) population) were incubat-ed with 90% N2 and 10% CO2 for 48 h at 37°C. Plates of Slanetz & Bartley (S&B, Streptococcus spp.) were incubated for 48 h at 37°C. Plates of Eosin Methylene Blue agar (EMB, coliforms) and Triptone Bile X-glucuronide (TBX, E. coli) were incubated for 24 h at 37°C. For yeasts, Rose-Bengal Chloramphenicol agar (RBCA) was incubated for 4 days at room temperature. Bifidobacteria were plated on Tryptone Peptone Yeast extract agar (TPY) to which mupirocine (GlaxoSmithKline, Brentford, UK) and acetic acid (Merck Eurolab, Leuven, Belgium) were added as stipulated by Rada and Petr (2002), plates were incubated with 90% N2 and 10% CO2 for 3 days at 37°C. For Experi-ment II, Pediococcus spp. were plated on a MRS-NaCl-TTC-Vancomycine agar (PED) prepared and incubated as stated by the probiotic producer (48 h at 45°C). All media were obtained from Oxoid (Basinstoke, UK) except TPY (Scharlau Chemie S.A., Barcelona, Spain).
Samples (1 g) of the FLF from both experiments were plated on MRS, Rogosa, TBX, RBCA, PED, and TPY. The contents of the different GIT parts (1 g) were plated on RCM, Rogosa, S&B, EMB, RBCA, and TPY. The pooled faeces samples (1 g) taken during the experiment were plated onto EMB and Rogosa.
Determination of organic acids and ethanol.
The concentrations of lactate and VFA (mmol/l) were determined according to a slight modifica-tion of the gas chromatography (GC) method of Jensen et al. (1995) as described in Missotten et al. (2009). The ethanol concentration (mmol/l) was determined with an in-house GC method. In short, a sample of 10 ml FLF was acidified with 2% 6 mol/l H2SO4 and centrifuged at 2000 g for 10 min. The supernatant was filtered (Rotilabo®,
was kept for 4 min. The injector and detector temperatures were 160°C and 150°C, respectively.
Gut morpho-histological parameters. After fixation for 24 h in neutral-buffered formalin, intestinal tissue samples (from SI1 and SI2) were processed under standard conditions in an au-tomatic tissue processor Citadel 2000 (Shandon, Pittsburgh, USA) according to the method of Van Nevel et al. (2003). Well-oriented villi and adjacent crypts (15–20) were measured and the average villus length (V), crypt depth (C), V/C ratio, and total length V+C was calculated per piglet. Intra-epithelial lymphocytes (IELs), expressed as IELs per 100 enterocytes, were determined according to Dierick et al. (2009). This resulted in nine ob-servations per diet group in both experiments.
Statistical analysis.The statistical analysis was performed on treatment means, at the same time point, using Student’s t-test for Experiment I and one-way ANOVA, followed by post hoc comparison of means with Tukey’s test in case of significance, for Experiment II. A P-value below 0.05 was con-sidered significant. For performance parameters and bacterial counts of pooled faeces the pen was used as the experimental unit (3 observations per dietary group). Prior to statistical analysis, the bac-terial counts were log transformed to fit a normal distribution. For the other parameters the pig was used as experimental unit (9 observations per dietary group). The statistical program used was Tibco Spotfire S+ (Version 8.2, 2010) for MS Windows.
RESULTS
Fermentation characteristics of the FLF. In both experiments, the fermentation characteristics of the FLF showed good acidification during the
first 24 h of fermentation and reached steady state conditions thereafter. The lactic acid concentration was above 100 mmol/l FLF on day 1 in Experiment I (112 mmol/l FLF). On day 1 of Experiment II, the lactic acid level in the FLF was 92 mmol/l, but also reached a level higher than 100 mmol/l on day 2 (132 mmol/l FLF), which resulted in a pH below 4.5 (Figure 1A, B). The acetic acid level in Experiment I fluctuated around 45 mmol/l FLF, with a maximum value of 52 mmol/l FLF on day 15 (Figure 1A). In Experiment II, the acetic acid level remained below 25 mmol/l (Figure 1B). The ethanol level in Experiment I remained low with a maximal concentration of 14 mmol/l FLF measured on day 27 (Figure 1A). In Experiment II, the ethanol concentration reached values as high as 267 mmol/l on day 4 and fluctuated around 150 mmol/l FLF on the other days (Figure 1B), most probably related to the 100 fold higher yeast count in the FLF in Experiment II compared with that in Experiment I (Table 2).
After an initial bloom, the coliform population started to decline since day 1 and became unde-tectable on day 4 of the fermentation (Table 2). In both experiments, the Lactobacillus population rose to levels higher than 9 log10 CFU/ml FLF. The count of Pediococcus spp. in Experiment II showed that it was not the dominant strain during the fermentation process. In the beginning of the fermentation it was almost the only LAB strain present, but after 24 h, the level of Pediococcus
spp. was already by 2 log10 lower than showed the Lactobacillus spp. count. At the end of the trial, the Pediococcus strain was only present at a level of 3.1 log10 CFU/ml FLF, which is by ca. 2 log10 lower than the amount present at the start (5.1 log10 CFU/ml FLF).
3.0 3.5 4.0 4.5 5.0 5.5 6.0 6.5 0 50 100 150 200 250 300
0 0.17 0.33 1 2 3 8 15 22 27
pH -v alue (mmol/ lF LF ) Time (day) 3.0 3.5 4.0 4.5 5.0 5.5 6.0 6.5 0 50 100 150 200 250 300 350 400
0 0.17 0.33 1 2 3 4 8 15 22 27
[image:4.595.67.531.588.710.2]pH -v alu e (mmol/ lF LF ) Time (day)
Figure 1. Ethanol (×), lactic acid (■), and acetic acid (□) concentrations (mmol/l FLF) and pH-values (▲) for the fermentation profiles of fermented liquid feed (FLF) in Experiment I (A) and Experiment II (B). In both experiments the FLF was fermented at 30°C with continuous stirring and with a backslopping of 50% every day
Animal performances.In both experiments, no mortality or major health issues occurred. In Experi-ment I, the DM percentage taken up by the piglets in the first 6 days of the experiment was much lower than the average DM content of the FLF during the experiment (Figure 2A). In Experiment II, after changing the sedimentation characteristics of the FLF with sepiolite, this was only the case for the first day of the experiment. In that experiment, the piglets consumed FLF with a feed : water ratio more close to that of the FLF in the stirred tank even in the beginning of the experiment (Figure 2B). In both experiments, all piglets on FLF started to eat on the day of arrival, while the piglets on the other diets started to eat 1 day later on the average.
In Experiment I, the piglets on the DRY diet had, although not statistically significant, a bet-ter feed : gain ratio (F/G) than the piglets on FLF
(Table 3). The only significant difference was noted in week 4 for body weight gain (BWG), with the piglets on the DRY diet growing faster than those on FLF. In Experiment II, the piglets on FLF had a better F/G ratio (P < 0.05), higher DM intake (P < 0.05), and higher BWG (P < 0.05) than the piglets on the DRY or DRY+ diet (Table 4). The differences in dry matter (DM) intake and BWG were most notable in week 4 (P < 0.05) (Table 3).
Faecal flora and consistency. There were no significant treatment effects on faecal coliform counts in either experiment. In Experiment I, there were also no differences in the Lactobacillus
[image:5.595.64.531.127.326.2]spp. count. However, on day 8 of Experiment II, the group fed the DRY+ diet showed a slightly higher Lactobacillus spp. count than the group fed FLF, while the group fed the DRY diet showed an intermediate count (Table 4).
Table 2.Bacterial counts (log10 CFU/ml) in fermented liquid feed (FLF) for Experiment I and Experiment II. In both experiments FLF was fermented at 30°C with continuous stirring and with a backslopping of 50% each day
0 h 4 h 8 h Day 1 Day 2 Day 3 Day 4 Day 8 Day 15 Day 22 Day 27 Experiment I
Lactic acid bacteria 6.3 6.7 8.6 8.9 9.6 9.4 – 9.4 8.8 9.3 9.3
Lactobacillus spp. 6.5 6.5 8.2 8.9 9.7 9.6 9.8 9.3 8.7 9.7 9.3 Bifidobacteria spp. 3.4 3.1 4.0 5.5 5.3 5.2 – 6.0 5.4 4.0 4.0
E. coli 2.7 3.2 3.6 7.7 6.0 4.0 nd nd nd 2.2 nd
Yeasts 3.4 4.0 4.3 5.9 5.5 5.0 – 6.1 5.5 5.3 4.6
Experiment II
Lactic acid bacteria 5.3 6.0 7.4 9.1 9.1 9.1 9.2 9.2 9.3 9.3 8.9
Lactobacillus spp. 5.2 6.2 7.4 8.8 8.5 9.0 9.3 9.2 9.3 9.1 8.9 Pediococcus spp. 5.1 5.8 6.9 7.4 6.3 6.6 6.8 4.9 3.3 3.1 3.1 Bifidobacteria spp. 3.1 4.3 4.6 5.3 6.9 6.8 7.0 6.9 7.5 6.7 7.1
E. coli nd nd 3.4 5.5 4.7 3.3 nd nd nd nd nd
Yeasts 3.6 3.6 4.5 5.4 7.0 7.2 7.1 7.1 7.1 7.8 7.1
nd = below detection limit of 2 log10 CFU/ml FLF
0 5 10 15 20 25 30
0.0 0.5 1.0 1.5 2.0 2.5 3.0
1 3 5 7 9 11 13 15 17 19 21 23 25 27
D
M
(%)
Amou
nt
F
LF
in
ta
ke
(kg/pigl
et
)
Time (day)
0 5 10 15 20 25 30
0.0 0.5 1.0 1.5 2.0 2.5 3.0 3.5
1 3 5 7 9 11 13 15 17 19 21 23 25 27
D
M
(%)
Amou
nt
F
LF
in
ta
ke
(kg/pigl
et
)
Time (day)
Figure 2. Average fermented liquid feed (FLF) ingested (kg, ■) and dry matter (DM) intake (%,▲) compared with DM content (%, ×) in the FLF fed to the piglets in Experiment I (A) and in Experiment II (B) (n = 3)
[image:5.595.66.533.603.731.2]No significant differences were noted during both experiments in faecal scores. In both groups of Experiment I, 8 piglets showed signs of loose stools, although one piglet in the group fed FLF showed signs of loose stools from day 6 until the end of the experiment. In Experiment II, 8 piglets fed the DRY, 4 piglets fed the DRY+, and 5 piglets fed the FLF showed signs of loose stools during the trial.
Physiological characteristics and microbiologi-cal counts of the gut contents.In both experiments, the piglets fed FLF showed the highest gastric content (fresh weight), but it was only statistically significant between the groups fed the DRY+ diet and FLF in Experiment II. In both experiments
and in all GIT compartments, the group fed FLF showed, although statistically significant only for the colon content in Experiment II, the lowest DM percentage (Table 5).
[image:6.595.62.532.134.536.2]The pH of the gastric content was the lowest for the group fed FLF in both experiments, but again these differences were not statistically different (Table 6). In the small intestine, however, the pH became lower for the groups fed the DRY or DRY+ diet. In Experiment I, this was the case in the first 3 m of the small intestine (SI1) and in Experi-ment II, this was the case in the last 3 m of the small intestine (SI2). In Experiment I, the content of all the different GIT compartments contained mainly acetic and lactic acid (results not shown).
Table 3. Average (± standard deviation) dry matter (DM) intake (g/piglet/day), body weight gain (BWG; g/piglet/day), and feed : gain ratio (F/G) for DRY and FLF fed groups in Experiment I (n = 3; start weight at 28 days of age 7.9 ± 1.0 kg) and Experiment II (n = 3; start weight at 27 days of age 6.3 ± 1.2 kg)
Week Group DM-intake BWG F/G
Experiment I
1 DRYFLF 113 ± 28 91 ± 26aa 18 ± 74 35 ± 55aa 1.61 ± 3.060.23 ± 2.43aa
2 DRYFLF 243 ± 55217 ± 18aa 166 ± 42139 ± 19aa 1.47 ± 0.061.57 ± 0.10aa
3 DRYFLF 513 ± 87468 ± 51aa 383 ± 133 254 ± 32aa 1.39 ± 0.271.86 ± 0.30aa
4 DRYFLF 627 ± 111524 ± 34aa 414 ± 55277 ± 35ab 1.51 ± 0.091.91 ± 0.27aa
1–4 DRYFLF 388 ±71337 ± 30aa 254 ± 78183 ± 18aa 1.57 ± 0.201.85 ± 0.12aa
Experiment II
1
DRY 93 ± 12a 31 ± 14a 3.24 ± 1.00a
DRY+ 97 ± 17a 45 ± 28a 2.82 ± 1.75a
FLF 95 ± 5a 43 ± 17a 2.39 ± 0.71a
2
DRY 225 ± 14a 169 ± 30a 1.36 ± 0.20a
DRY+ 238 ± 30a 182 ± 10a 1.31 ± 0.17a
FLF 263 ± 40a 279 ± 52b 0.95 ± 0.11a
3
DRY 343 ± 27a 226 ± 39a 1.54 ± 0.30a
DRY+ 321 ± 25a 191 ± 39a 1.72 ± 0.29a
FLF 385 ± 61a 242 ± 12a 1.59 ± 0.21a
4
DRY 413 ± 61a 282 ± 37a 1.46 ± 0.04a
DRY+ 400 ± 29a 294 ± 45a 1.37 ± 0.14a
FLF 557 ± 37b 414 ± 34b 1.35 ± 0.02a
1–4
DRY 278 ± 19a 184 ± 11a 1.52 ± 0.09a
DRY+ 274 ± 1a 185 ± 4a 1.48 ± 0.03a
FLF 337 ± 33b 254 ± 25b 1.33 ± 0.01b
In Experiment II, the stomach, SI1 and SI2 also contained mainly acetic and lactic acid, but the caecum and colon contained mainly propionic, butyric, and acetic acid (results not shown).
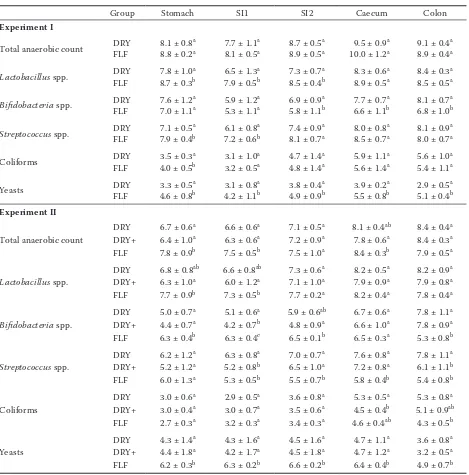
In Table 6, the results of the microbial enumera-tions in the different GIT compartments are given. The coliform counts in the stomach showed a significantly lower result for the DRY fed group compared to the FLF group in Experiment I. In Experiment II, there was a significant difference in the caecum between the groups fed the DRY or DRY+ diet, DRY+ showing a lower number. Also in the colon the FLF group showed a lower number than the group fed the DRY diet.
In Experiment I, the Lactobacillus spp. count in the stomach, SI1 and SI2 compartment of the group fed FLF were significantly higher than those found in the group fed the DRY diet (Table 6). This was not the case in Experiment II. Here, the group fed the DRY+ diet showed significantly lower counts in total anaerobic, Lactobacillus spp., and Bifido-bacteria counts in almost all GIT compartments (Table 7). In the group fed FLF in Experiment I, the Streptococcus spp. had a higher number in the stomach and caudal to the stomach compared with the control DRY fed group (Table 6). On the other hand, in Experiment II the count in the compartments caudal to the stomach were always
significantly lower for the group fed FLF than the counts in the group fed the DRY diet (Table 6).
In both experiments, a higher count of yeasts was noted in the gut of piglets fed FLF, compared with dry feed (Table 6). Most probably this was related to the high level of yeasts present in the FLF (Table 2).
Morpho-histological parameters of the gut. For Experiment I, no differences were noted between treatments for the parameters measured at SI1. At SI2 however, the group fed the DRY diet showed significantly larger vili (V), deeper crypts (C), and greater total length (villus + crypt, V+C) compared with the group fed FLF (P < 0.05) (Table 8). In Experiment II, the group fed FLF showed larger V and larger V+C compared with the piglets fed the DRY+ diet at SI2 (Table 6). The IELs numbers showed interesting results for the groups fed the DRY+ and FLF diets. In SI1, the numbers were the lowest for the group fed the DRY+ diet, but in SI2 the group fed FLF showed lower IELs numbers, although not significantly different.
DISCUSSION
[image:7.595.63.531.139.354.2]Fermentation characteristics of the FLF. The FLF in both experiments showed the desired characteristics for good FLF, namely a pH lower
Table 4. Average bacterial counts (log10 CFU/ml ± standard deviation) for coliforms and Lactobacillus spp. in pooled faecal samples on days 8, 15, and 22 for DRY and FLF fed groups in Experiment I, and for DRY, DRY+, and FLF fed groups in Experiment II (n = 3)
Group Day 8 Day 15 Day 22
Coliforms
Experiment I
DRY 8.0 ± 0.2a 8.1 ± 0.5a 7.6 ± 0.2a
FLF 7.8 ± 0.7a 7.6 ± 1.1a 7.3 ± 1.5a
Experiment II
DRY 7.5 ± 0.7a 6.5 ± 1.0a 7.5 ± 0.5a
DRY+ 7.2 ± 0.6a 6.6 ± 0.4a 6.7 ± 0.6a
FLF 7.0 ± 0.6a 7.2 ± 0.2a 7.5 ± 0.5a
Lactobacillus spp.
Experiment I
DRY 9.1 ± 0.1a 8.2 ± 0.3a 9.0 ± 0.3a
FLF 9.2 ± 0.1a 8.1 ± 0.5a 9.3 ± 0.5a
Experiment II
DRY 8.8 ± 0.2ab 9.2 ± 0.2a 9.0 ± 0.4a
DRY+ 9.1 ± 0.1a 9.4 ± 0.4a 8.8 ± 0.5a
FLF 8.6 ± 0.2b 8.9 ± 0.1a 9.0 ± 0.2a
than 4.5, a lactic acid concentration higher than 150 mmol/l, and an acetic acid concentration below 40 mmol/l (Van Winsen et al. 2001; Missotten et al. 2009). The lactic and acetic acid concentrations were comparable to those found by other research-ers (Plumed-Ferrer and Von Wright 2009). The steady-state lactic acid concentration was higher than the bacteriocidal level for pathogenic bacteria (> 100 mmol/l) as suggested by Brooks et al. (2003) and resulted in a reduction of the coliforms below the limit of detection in the FLF since day 4. The concentration of acetic acid was slightly higher in Experiment I than in Experiment II and this could have caused some loss of palatability of the FLF (Jensen and Mikkelsen 1998; Brooks 2008; Plumed-Ferrer and Von Wright 2009). However this effect would be of minor importance, as the maximum level of acetic acid observed (52 mmol/l FLF) was only slightly higher than the optimal level of 40 mmol/l FLF suggested by Van Winsen et al. (2001).
In Experiment II, the formation of ethanol was rather high, probably due to the high yeast count in the FLF, but the values remained below the maximum levels found by Geary et al. (1999). These authors reported values between 1 and 4% ethanol w/v, whereas in the present study the maximum value measured equalled 1.2% ethanol w/v (267 mmol/l). As the production of ethanol is accompanied by the formation of CO2, which leads to loss of energy and DM of the feed, this could be disadvantageous (Brooks et al. 2003). The maximal level of DM loss observed caused by ethanol formation was approximately 1.2%, which was less than the 3.1% loss mentioned by Jensen and Mikkelsen (1998). In contrast, these authors also pointed out that the presence of yeasts in the FLF feed might benefit the health status of the GIT of the pigs. Yeasts have the ability of binding enterobacteria to their surface, thereby blocking the adherence of these bacteria to the gut
epithe-Table 5. Average (± standard deviation) pH-value, fresh weight (g), and dry matter (DM, %) of the contents of stomach, first 3 m of small intestine (SI1), last 3 m of small intestine (SI2), caecum, and last 25 cm of colon from piglets sac-rificed at 28 days post weaning of DRY and FLF fed groups in Experiment I, and DRY, DRY+, and FLF fed groups in Experiment II (n = 9)
Group Stomach SI1 SI2 Caecum Colon
pH
Experiment I
DRY 3.94 ± 0.54a 5.53 ± 0.25a 6.52 ± 0.21a 5.69 ± 0.17a
FLF 3.52 ± 0.70a 5.65 ± 0.23a 6.50 ± 0.25a 5.56 ± 0.11a
Experiment II
DRY 3.69 ± 1.26a 5.52 ± 0.38a 6.90 ± 0.13ab 5.90 ± 0.24ab
DRY+ 3.24 ± 1.13a 5.68 ± 0.35a 6.79 ± 0.16a 5.81 ± 0.19a
FLF 2.92 ± 0.51a 5.40 ± 0.42a 7.06 ± 0.14b 6.04 ± 0.17b
Weight
Experiment I
DRY 421 ± 137a 54 ± 22a 175 ± 50a 86 ± 48a 44 ± 28a
FLF 620 ± 326a 49 ± 20a 127 ± 54a 90 ± 43a 31 ± 14a
Experiment II
DRY 216 ± 105ab 70 ± 38a 119 ± 42a 39 ± 39a 21 ± 15a
DRY+ 145 ± 72a 58 ± 21a 110 ± 11a 67 ± 40a 28 ± 11a
FLF 352 ± 214b 72 ± 26a 141 ± 54a 60 ± 17a 37 ± 18a
DM
Experiment I
DRY 32.3 ± 3.2a 32.3 ± 1.8a 32.3 ± 1.3a 32.3 ± 1.9a 32.3 ± 5.6a
FLF 28.3 ± 3.7a 28.3 ± 2.6a 28.3 ± 1.5a 28.3 ± 2.7a 28.3 ± 3.2a
Experiment II
DRY 15.3 ± 2.8a 9.1 ± 3.2a 8.1 ± 1.9a 9.8 ± 4.3a 27.5 ± 0.6ab
DRY+ 14.8 ± 3.4a 8.6 ± 2.3a 8.9 ± 1.3a 11.0 ± 2.9a 31.8 ± 2.9a
FLF 13.8 ± 3.0a 7.4 ± 1.4a 7.9 ± 1.0a 9.4 ± 1.2a 23.4 ± 4.1b
[image:8.595.63.532.152.465.2]lium (Mul and Perry 1994). Jensen and Mikkelsen (1998) found an inverse relationship between the concentration of yeast and enterobacteria in the GIT of pigs. Therefore, high concentrations of yeasts in the FLF may be beneficial. However, the yeast population was not further specified and therefore eventual beneficial or detrimental effects by the yeasts present cannot be assessed, certainly when considering the high diversity of
yeasts that can be present in FLF (Olstorpe et al. 2008; Gori et al. 2011).
[image:9.595.64.533.134.609.2]Animal performances.The weaning period is a very well-known challenging period for the piglet, in which it has to cope with separation from the mother and with a change in feed offered. Indeed, the transition from liquid milk to solid feed is often accompanied by a reduced feed intake and growth check (Brooks and Tsourgiannis 2003).
Table 6.Average (± standard deviation) bacterial and yeast counts (log10 CFU/ml) in the contents of stomach, first 3 m of small intestine (SI1), last 3 m of small intestine (SI2), caecum, and last 25 cm of colon from piglets sacrificed at 28 days post weaning of DRY and FLF fed groups in Experiment I and II (n = 9)
Group Stomach SI1 SI2 Caecum Colon
Experiment I
Total anaerobic count DRYFLF 8.1 ± 0.88.8 ± 0.2aa 7.7 ± 1.18.1 ± 0.5aa 8.9 ± 0.58.7 ± 0.5aa 10.0 ± 1.29.5 ± 0.9aa 8.9 ± 0.49.1 ± 0.4aa
Lactobacillus spp. DRYFLF 7.8 ± 1.08.7 ± 0.3ab 6.5 ± 1.37.9 ± 0.5ba 8.5 ± 0.47.3 ± 0.7ba 8.9 ± 0.58.3 ± 0.6aa 8.5 ± 0.58.4 ± 0.3aa
Bifidobacteria spp. DRYFLF 7.6 ± 1.27.0 ± 1.1aa 5.9 ± 1.25.3 ± 1.1aa 5.8 ± 1.16.9 ± 0.9ba 6.6 ± 1.17.7 ± 0.7ba 6.8 ± 1.08.1 ± 0.7ba
Streptococcus spp. DRYFLF 7.1 ± 0.57.9 ± 0.4ab 6.1 ± 0.87.2 ± 0.6ba 8.1 ± 0.77.4 ± 0.9aa 8.5 ± 0.78.0 ± 0.8aa 8.0 ± 0.78.1 ± 0.9aa
Coliforms DRYFLF 3.5 ± 0.34.0 ± 0.5ab 3.1 ± 1.03.2 ± 0.5aa 4.8 ± 1.44.7 ± 1.4aa 5.6 ± 1.45.9 ± 1.1aa 5.4 ± 1.15.6 ± 1.0aa
Yeasts DRYFLF 3.3 ± 0.54.6 ± 0.8ab 3.1 ± 0.84.2 ± 1.1ba 4.9 ± 0.93.8 ± 0.4ba 5.5 ± 0.83.9 ± 0.2ba 5.1 ± 0.42.9 ± 0.5ba
Experiment II
Total anaerobic count
DRY 6.7 ± 0.6a 6.6 ± 0.6a 7.1 ± 0.5a 8.1 ± 0.4ab 8.4 ± 0.4a
DRY+ 6.4 ± 1.0a 6.3 ± 0.6a 7.2 ± 0.9a 7.8 ± 0.6a 8.4 ± 0.3a
FLF 7.8 ± 0.9b 7.5 ± 0.5b 7.5 ± 1.0a 8.4 ± 0.3b 7.9 ± 0.5a
Lactobacillus spp.
DRY 6.8 ± 0.8ab 6.6 ± 0.8ab 7.3 ± 0.6a 8.2 ± 0.5a 8.2 ± 0.9a
DRY+ 6.3 ± 1.0a 6.0 ± 1.2a 7.1 ± 1.0a 7.9 ± 0.9a 7.9 ± 0.8a
FLF 7.7 ± 0.9b 7.3 ± 0.5b 7.7 ± 0.2a 8.2 ± 0.4a 7.8 ± 0.4a
Bifidobacteria spp.
DRY 5.0 ± 0.7a 5.1 ± 0.6a 5.9 ± 0.6ab 6.7 ± 0.6a 7.8 ± 1.1a
DRY+ 4.4 ± 0.7a 4.2 ± 0.7b 4.8 ± 0.9a 6.6 ± 1.0a 7.8 ± 0.9a
FLF 6.3 ± 0.4b 6.3 ± 0.4c 6.5 ± 0.1b 6.5 ± 0.3a 5.3 ± 0.8b
Streptococcus spp.
DRY 6.2 ± 1.2a 6.3 ± 0.8a 7.0 ± 0.7a 7.6 ± 0.8a 7.8 ± 1.1a
DRY+ 5.2 ± 1.2a 5.2 ± 0.8b 6.5 ± 1.0a 7.2 ± 0.8a 6.1 ± 1.1b
FLF 6.0 ± 1.3a 5.3 ± 0.5b 5.5 ± 0.7b 5.8 ± 0.4b 5.4 ± 0.8b
Coliforms
DRY 3.0 ± 0.6a 2.9 ± 0.5a 3.6 ± 0.8a 5.3 ± 0.5a 5.3 ± 0.8a
DRY+ 3.0 ± 0.4a 3.0 ± 0.7a 3.5 ± 0.6a 4.5 ± 0.4b 5.1 ± 0.9ab
FLF 2.7 ± 0.3a 3.2 ± 0.3a 3.4 ± 0.3a 4.6 ± 0.4ab 4.3 ± 0.5b
Yeasts
DRY 4.3 ± 1.4a 4.3 ± 1.6a 4.5 ± 1.6a 4.7 ± 1.1a 3.6 ± 0.8a
DRY+ 4.4 ± 1.8a 4.2 ± 1.7a 4.5 ± 1.8a 4.7 ± 1.2a 3.2 ± 0.5a
FLF 6.2 ± 0.3b 6.3 ± 0.2b 6.6 ± 0.2b 6.4 ± 0.4b 4.9 ± 0.7b
Giving piglets liquid feed instead of solid feed may improve this transition (Jensen and Mikkelsen 1998; Brooks and Tsourgiannis 2003).
In our Experiment I, a fast sedimentation of the solids in the FLF slurry in the troughs was observed. In this way, piglets had almost no advantage of consum-ing the diet as FLF, as mostly the supernatant water part, especially in the beginning of the experiment, was consumed (Figure 2). The trough design is one of the possible reasons for the worse performance of the piglets on FLF (Russell et al. 1996). More feed wastage was noted by piglets fed FLF compared with piglets fed a dry diet. After changing the trough de-sign in Experiment II, the piglets fed FLF performed better than in their first experiment, but still worse than the piglets on the dry feed.
A fast start of DM feed intake is very crucial after weaning, otherwise shortening of the villi and deepening of the crypts in the small intes-tine occurs rapidly, resulting in a reduced diges-tive capacity (Pluske et al. 1997; Montagne et al. 2007). Reducing the sedimentation process in the FLF slurry, after the addition of sepiolite in the feed in Experiment II, resulted in better morpho-histological parameters and better
per-formances in the piglets fed FLF, compared with the piglets fed dry diets. As in both experiments the same troughs were used, the improvement could be explained by a reduced sedimentation of the solids in the FLF, probably due to the ad-dition of the sepiolite, and consequently a higher DM consumption of the piglets. The performance in the first week after weaning seems to be very important, because piglets never really made up for the suffered damage to their gut morphol-ogy/digestive capacity in the first stage of the experiment. From the performed experiments, this can be seen clearly by the fact that although no significant differences were noted during the first weeks of the experiments, the piglets, with a good and fast DM uptake, performed the best.
[image:10.595.67.531.492.708.2]Characteristics of the gut. Generally, a reduc-tion in the number of coliforms or E. coli is found along the GIT of piglets fed FLF (Jensen and Mik-kelsen 1998; Canibe and Jensen 2003, 2012; Hong et al. 2009). However, in the present experiments no differences were found in the coliform counts. The Lactobacillus counts and pH-values along the GIT resemble those reported by Jensen and Mikkelsen (1998) and Canibe and Jensen (2003).
Table 7. Average (± SEM) villus length (V; µm), crypt depth (C; µm), villus : crypt ratio (V/C), and total length (V+C; µm) together with numbers of intra-epithelial lymphocytes per 100 enterocytes (IELs) of the small intestine at 3 m distally from stomach (SI1) and at 3 m proximally to caecum (SI2) from piglets sacrificed at 28 days post weaning of DRY and FLF fed groups in Experiments I and II (n = 9)
Groups V C V/C V+C IELs
SI1
Experiment I
DRY 573 ± 33a 280 ± 12a 2.14 ± 0.13a 853 ± 39a 33.9 ± 2.6a
FLF 595 ± 23a 267 ± 12a 2.34 ± 0.06a 862 ± 33a 30.5 ± 2.4a
Experiment II
DRY 518 ± 18a 317 ± 12a 1.68 ± 0.07a 836 ± 25a 23.5 ± 1.6ab
DRY+ 536 ± 23a 308 ± 9a 1.78 ± 0.08a 844 ± 28a 20.2 ± 1.1a
FLF 607 ± 13a 317 ± 9a 1.98 ± 0.08a 924 ± 9a 26.0 ± 1.8b
SI2
Experiment I
DRY 550 ± 23a 289 ± 10a 1.98 ± 0.04a 839 ± 32a 24.3 ± 1.8a
FLF 501 ± 17b 264 ± 8b 2.01 ± 0.09a 765 ± 18b 26.7 ± 1.5a
Experiment II
DRY 521 ± 26ab 312 ± 11a 1.72 ± 0.08a 833 ± 30ab 18.6 ± 1.6a
DRY+ 490 ± 31a 309 ± 8a 1.62 ± 0.10a 799 ± 34a 19.0 ± 1.0a
FLF 558 ± 27b 327 ± 10a 1.75 ± 0.12a 885 ± 28b 18.1 ± 1.1a
In both of our experiments, a higher count of yeasts (P < 0.05) was noted in the gut of piglets fed FLF, compared with dry feed. As mentioned above, this high concentration of yeasts in the FLF may also be beneficial, depending on the strains present (Mul and Perry 1994; Jensen and Mikkelsen 1998; Olstorpe et al. 2008; Gori et al. 2011).
Also in both experiments and in all experimental groups there was a clear discrepancy between the coliform counts in the content of the last 25 cm of the colon compared with the faecal counts during the trial, which were by ca. 2 log10 higher (Tables 4 and 6). The count of Lactobacillus spp. was also by ca. 0.5 log10 higher in the faecal samples dur-ing the trial. So, the faecal counts durdur-ing the trial showed the same trend between Lactobacillus
spp. and coliforms as present in the content of the last 25 cm of the colon, but were not completely the same.
The lower DM percentage in the GIT of the group fed FLF is in accordance with other studies (Canibe and Jensen 2003) and may reduce villus atrophy (Brooks 2008). Probably this latter is related to the viscosity of the digesta (Brooks 2008), although this was not measured in the present study. The non-significantly lower gastric pH in the piglets fed FLF is also in line with other studies (Jensen and Mikkelsen 1998; Moran 2001; Van Winsen et al. 2001; Canibe and Jensen 2003).
The probiotic product/strain added to the feed in Experiment II could have had a probiotic ef-fect in the group fed the DRY+ diet. This group showed a lower amount of IELs in the first part of the small intestine (SI1). IELs are part of the mucosal immune system (first line of defense under the protective mucus layer) and play a role in the elimination of damaged or infected cells (Cerf-Bensussan and Guy-Grand 1991; Gaskins 1997) and their number is influenced by the microbial load (Gaskins 1997). Also the group fed the DRY+ diet showed the lowest incidence of diarrhoea.
Although there was a difference between Experi-ment I and II regarding the inoculation method, the final outcome of the fermentation process seemed to be that the Pediococcus acidilactici
strain, present in the Bactocell® product, was
not able to become the dominant species in the fermentation process. This was shown by plate countings in the FLF in Experiment II, although care should be taken as the viability of the strain in the compound weaner feed was not checked
dur-ing and at the end of the experiment. Geary et al. (1999) also indicated that this strain, as inoculant, did not become the dominant strain in the FLF produced for their experiment. This strain could thus have had a probiotic effect in the beginning of the experiment, but at the end this seems unlikely given its low presence in the FLF. Applying batch fermentation may be more suitable for preserving the probiotic effect of added strains than the often used back-slopping technique (Brooks 2008), but nevertheless the group fed FLF in Experiment II performed better than the other experimental groups.
CONCLUSION
Feeding fermented liquid feed seems to be an interesting method for feeding young piglets, of-fering both solid feed and water at the same time. This may result in good performances after wean-ing, provided that sedimentation of the solids in the liquid slurry is hindered as this clearly plays an important role when feeding piglets ad libitum
with FLF.
Acknowledgement. Lallemand S.A.S. (France) is gratefully acknowledged for providing the pro-biotic product Bactocell® for both trials and the
financial support for Experiment II. Tessend-erlo Chemie n.v. (Belgium) and Grupo Tolsa S.A. (Spain) are gratefully thanked for providing the sepiolite (SPLF) product. Also GlaxoSmithKline (UK) is gratefully thanked for providing the mu-pirocine used to prepare the selective TPY agar. W. Willems, E. Turtelboom, A. Maes, C. Melis, S. Coolsaet, C. Vermander, G. Antrop, F. Brugge-man, and Y. De Tandt are gratefully thanked for the assistance during the experiments.
REFERENCES
Brooks P.H. (2008): Fermented liquid feed for pigs. CAB Reviews: Perspectives in Agriculture, Veterinary Science, Nutrition and Natural Resources, 073, 1–18.
Brooks P.H., Tsourgiannis C.A. (2003): Factors affecting the voluntary feed intake of the weaned pig. In: Pluske J.R., Le Dividich J., Verstegen M.W.A. (eds): Weaning the Pig, Concepts and Consequences. Wageningen Academic Publishers, Wageningen, the Netherlands, 81–116. Brooks P.H., Moran C.A., Beal J.D., Demeckova V.,
Varley M.A., Wiseman J. (eds): The Weaner Pig: Nutri-tion and Management. CABI Publishing, Wallingford, UK, 153–178.
Brooks P.H., Beal J.D., Niven S., Demeckova V. (2003): Liquid feeding of pigs II. Potential for improving pig health and food safety. In: The IV Conference on Effect of Genetic and Non-genetic Factors on Carcass and Meat Quality of Pigs: 24–25 April 2003, Siedlce, Poland. Animal Science Papers and Reports, 21 (Suppl. 1), 23–39. Canibe N., Jensen B.B. (2003): Fermented and nonfermented
liquid feed to growing pigs: effect on aspects of gastro-intestinal ecology and growth performance. Journal of Animal Science, 81, 2019–2031.
Canibe N., Jensen B.B. (2012): Fermented liquid feed – microbial and nutritional aspects and impact on enteric diseases in pigs. Animal Feed Science and Technology, 173, 17–40.
Cerf-Bensussan N., Guy-Grand D. (1991): Intestinal in-traepithelial lymphocytes. Gastroenterology Clinics of North America, 20, 549–576.
Commission Regulation (EC) No. 2036/2005 of 14 De-cember 2005 concerning the permanent authorisations of certain additives in feedingstuffs and the provisional authorisation of a new use of certain additives already authorised in feedingstuffs. Official Journal of the Euro-pean Union, L328, 13–20.
Dierick N., Ovyn A., De Smet S. (2009): Effect of feeding intact brown seaweed Ascophylum nodosum on some di-gestive parameters and on iodine content in edible tissues in pigs. Journal of the Science of Food and Agriculture, 89, 584–594.
European Food Safety Authority (2013): Scientific opinion of the EFSA panel on additives and products or substances used in animal feed (FEEDAP) on the safety and efficacy of a preparation of bentonite and sepiolite (ToxFin® Dry) as
feed additive for all species. EFSA Journal, 11 (4:3179), 1–21. Gaskins H. (1997): Immunological aspects of host/micro-biota interactions at the intestinal epithelium. In: Mackie R., White B.A., Isaacson R.E. (eds): Gastrointestinal crobes and Host Interactions. Vol. 2: Gastrointestinal Mi-crobiology. Chapman and Hall, New York, USA, 537–587. Geary T.M., Brooks P.H., Beal J.D., Campbell A. (1999): Ef-fect on weaner pig performance and diet microbiology of feeding a liquid diet acidified to pH 4 with either lactic acid or through fermentation with Pediococcus acidilac-tici. Journal of the Science of Food and Agriculture, 79, 633–640.
Gori K., Bjrklund M.K., Canibe N., Pedersen A.O., Jespersen L. (2011): Occurrence and identification of yeast species in fermented liquid feed for piglets. Microbial Ecology, 61, 146–153.
Hong T.T.T., Thuy T.T., Passoth V., Lindberg J.E. (2009): Gut ecology, feed digestion and performance in weaned piglets fed liquid diets. Livestock Science, 125, 232–237. Jensen B.B., Mikkelsen L.L. (1998): Feeding liquid diets
to pigs. In: Garnsworthy P.C., Wiseman J. (eds): Recent Advances in Animal Nutrition. Nottingham University Press, Nottingham, UK, 107–126.
Jensen M.T., Cox R.P., Jensen B.B. (1995): Microbial produc-tion of skatole in the hind gut of pigs given different diets and its relation to skatole deposition in backfat. Animal Science, 61, 293–304.
Missotten J.A.M., Goris J., Michiels J., Van Coillie E., Her-man L., De Smet S., Dierick N.A., Heyndrickx M. (2009): Screening of isolated lactic acid bacteria as potential beneficial strains for fermented liquid pig feed produc-tion. Animal Feed Science and Technology, 150, 122–138. Missotten J.A.M., Michiels J., Ovyn A., De Smet S., Dierick
N.A. (2010): Fermented liquid feed for pigs: a review. Archives of Animal Nutrition, 64, 437–466.
Montagne L., Boudry G., Favier C., Le Huerou-Luron I., Lalles J.-P., Seve B. (2007): Main intestinal markers associated with the changes in gut architecture and function in pig-lets after weaning. British Journal of Nutrition, 97, 45–57. Moran C.A. (2001): Development and benefits of liquid
diets for newly weaned pigs. PhD Diss. UK: University of Plymouth.
Mul A.J., Perry F.G. (1994): The role of fructo-oligosac-charides in animal nutrition. In: Garnsworthy P.C., Cole D.J.A. (eds): Recent Advances in Animal Nutrition. Not-thingham University Press, NotNot-thingham, UK, 54–79. Niba A.T., Beal J.D., Kudi A.C., Brooks P.H. (2009):
Po-tential of bacterial fermentation as a biosafe method of improving feeds for pigs and poultry. African Journal of Biotechnology, 8, 1758–1767.
Olstorpe M., Lyberg K., Lindberg J.E., Schnurer J., Passoth V. (2008): Population diversity of yeasts and lactic acid bacteria in pig feed fermented with whey, wet wheat distillers’ grains, or water at different temperatures. Ap-plied and Environmental Microbiology, 74, 1696–1703. Plumed-Ferrer C., Von Wright A. (2009): Fermented pig
liquid feed: nutritional, safety and regulatory aspects. Journal of Applied Microbiology, 106, 351–368.
Pluske J.R., Hampson D.J., Williams I.H. (1997): Factors influencing the structure and function of the small in-testine in the weaned pig: a review. Livestock Production Science, 51, 215–236.
Rada V., Petr J. (2002): Enumeration of bifidobacteria in animal intestinal samples. Veterinarni Medicina, 47, 1–4. Russell P.J., Geary T.M., Brooks P.H., Campbell A. (1996):
the role of microbial activity in the liquid feed. Journal of the Science of Food and Agriculture, 72, 8–16.
Scholten R.H.J., Van der Peet-Schwering C.M.C., Verstegen W.M.A., den Hartog L.A., Schrama J.W., Vesseur P.C. (1999): Fermented co-products and fermented compound diets for pigs: a review. Animal Feed Science and Tech-nology, 82, 1–19.
Van der Heyde H., Henderickx H. (1963): Simplification of the quantitative and qualitative enumeration of Bac-teria using “ring plates”. Zentralblatt für Bakteriologie, Parasitenkunde, Infektionskrankheiten und Hygiene, 189, 224–228. (in German)
Van Nevel C., Decuypere J., Dierick N., Molly K. (2003): The influence of Lentinus edodes (Shiitake mushroom) preparations on bacteriological and morphological as-pects of the small intestine in piglets. Archives of Animal Nutrition, 57, 399–412.
Van Winsen R.L., Urlings B.A.P., Lipman L.J.A., Snijders J.M.A., Keuzenkamp D., Verheijden J.H.M., Van Knapen F. (2001): Effect of fermented feed on the microbial popu-lation of the gastrointestinal tracts of pigs. Applied and Environmental Microbiology, 67, 3071–3076.
Received: 2014–07–30 Accepted after corrections: 2014–11–12
Corresponding Author
Joris Missotten, Ph.D., MSc., Ghent University, Department of Animal Production, Laboratory for Animal Nutrition and Animal Product Quality, Proefhoevestraat 10, B-9090 Melle, Belgium