Genetic correlations between type traits of young Polish
Holstein-Friesian bulls and their daughters
W. Jagusiak
1, A. Otwinowska-Mindur
1, E. Ptak
1, A. Żarnecki
2 1Agricultural University, Krakow, Poland2National Research Institute of Animal Production, Balice, Poland
ABSTRACT:The objective of this study was to evaluate the usefulness of young bulls’ conformation scores in a national type evaluation system. For this purpose the genetic correlations between conformation traits of sires and the same type traits of their daughters were estimated. Young bulls were evaluated as required for registration in the herd book and for entering progeny testing. Data were 7 linearly scored (1–9 scale) and 3 descriptive (scored from 50 to 100) conformation traits of 933 young bulls born between 2005 and 2008, and the same traits evaluated in their 65 479 daughters. A two-trait animal model was used to estimate genetic correlations between the type traits of bulls and their daughters. (Co)variance components were estimated by a Bayesian method via Gibbs sampling. Two linear models were used: the linear model for bulls included fixed linear regressions on age at evaluation, fixed effects of herd and classifier, and random additive genetic effect; the linear model for cows contained fixed effects of herd-year-season-classifier, lactation stage, fixed linear regression on age at calving, and random additive genetic effect. Estimates of bulls’ heritabilities for all analyzed traits ranged from 0.07 for feet and legs to 0.25 for body depth. Heritabilities of cows were the lowest for rear legs rear view (0.05) and foot angle (0.06), and the highest for size (0.43). The genetic correlations between similarly described traits of bulls and their daughters were moderate to high (0.42–0.91). The lowest genetic correlation (0.42) was for chest width, and the highest (0.91) for rump angle. The magnitude of genetic correla-tions between pairs of type traits of sires and daughters was high enough to suggest that the body conformation of dairy cows can be improved by making use of some measurements taken from young bulls. Including highly correlated bull scores for size, rump angle, and three linear leg traits in the evaluation system could improve the accuracy of type breeding value evaluation.
Keywords: dairy cattle; conformation traits; genetic parameters
INTRODUCTION
Conformation was one of the first nonproduc-tion traits scored and included in the selecnonproduc-tion indices for dairy cattle populations around the world. At a national level, type traits are scored as linear traits, descriptive traits or general char-acteristics (Battagin et al. 2012). Scoring of type traits is routinely performed in many countries for the entire population or for groups of offspring of tested bulls. Conformation traits are an important component of breeding and selection decisions for dairy cattle and are often used as early predictors of functional traits. Breeders can detect obvious
deficiencies in the animal conformation. These deficiencies may result in severe problems in cop-ing with the environment (e.g. leg problems) or inconvenience to farmers (e.g. milking of cows with very loose udders or extreme positioning of teats) (Solkner and Petschina 1999).
informa-tion in an early stage of their life (Reinhardt et al. 2005). On the one hand, a young bull’s own performance might be used for early preselection; on the other hand, the bull’s score could be used together with genetically correlated daughters’ measures as additional information for sire type evaluation (Boelling et al. 2001).
The objective of this study was to evaluate the usefulness of young bulls’ conformation scores in a national type evaluation system. For this purpose the genetic correlations between conformation traits of sires and the same type traits of their daughters were estimated.
MATERIAL AND METHODS
Data were provided by the Polish Federation of Cattle Breeders and Dairy Farmers and extracted from the SYMLEK National Milk Recording System. Conformation data comprising 10 type traits were available for 933 young Polish Holstein-Friesian bulls, and the same traits were evaluated in their 65 479 daughters. The conformation traits included 3 descriptive (size, type and conformation, feet and legs) and 7 linearly scored traits (body depth, chest width, rump angle, rump width, rear legs – side view, foot angle and rear legs – rear view). The descriptive traits were collected based on a scale from 50 to 100 points and the linear traits were scored on a nine-point scale (1–9). All sires and their daughters were scored for all traits.
The bulls were born between 2005 and 2008 in 138 herds. In the linear model for bulls fixed herd (H) effect instead of herd-year (HY) effect was included, because many HY subclasses com-prised only one record. It was also confirmed that the effect of year was not statistically sig-nificant. Each bull was scored for type between 10 and 22 months of age (15 months on average), as required for registration in the herd book and for entering progeny testing. The young bulls were scored by 14 classifiers. A restriction of a minimum of 10 daughters per sire was imposed. The bulls were sons of 178 sires and grandsons of 332 maternal grandsires. In total, there were 468 sires and maternal grandsires because some bulls appeared in both groups.
The daughters of bulls were born between 2006 and 2011 in 10 226 herds. They were calving for the first time at the age of 26 months on average. Edits for age of calving were the same as in the
routine evaluation system (National Research In-stitute of Animal Production 2013). Each cow was scored for type between 15 and 180 days in milk, once during the first lactation. Days in milk were divided into 11 lactation stages, defined as 15-day intervals. The cows were scored by 19 classifiers. They were daughters of 933 sires and granddaugh-ters of 5143 maternal grandsires.
A two-trait animal model and a Bayesian method via Gibbs sampling were used to estimate (co) variance components (Misztal 2008). Pedigrees of male ancestors were extended with all information available in the national database. Ten analyses were run, each for one trait scored for bulls and their daughters. Heritabilities and genetic correla-tions were calculated using estimated (co)variance components. Two different linear models were used for sires and their daughters.
The linear model for young bulls was as follows:
Yijk = ai + Hj +Ck +βXi + εijk
where:
Yijk = conformation score for ith bull evaluated in jth herd by kth classifier at age X
i
ai = random additive genetic effect (with 181 908 animals)
Hj = fixed effects of herd (with 138 levels)
Ck = fixed effects of classifier (with 14 levels) b = linear regression on age at scoring
Xi = age at scoring (10–22 months) εijk = random residual effect
The linear model for cows was as follows:
Yijk = ai + HYSCj +Lk + βXi + εijk
where:
Yijk = conformation score for ith cow evaluated in jth herd-year-season-classifier subclass in kth lac-tation stage and calved at age Xi
ai = random additive genetic effect (with 181 908 animals)
HYSCj = fixed effects of herd-year-season classifier (with 28 562 levels)
Lk = fixed effects of lactation stage (with 11 levels) β = linear regression on age at calving
Xi = age at calving (18–48 months) εijk = random residual effect
(co)vari-ance components were calculated as an average of 16 000 samples.
RESULTS AND DISCUSSION
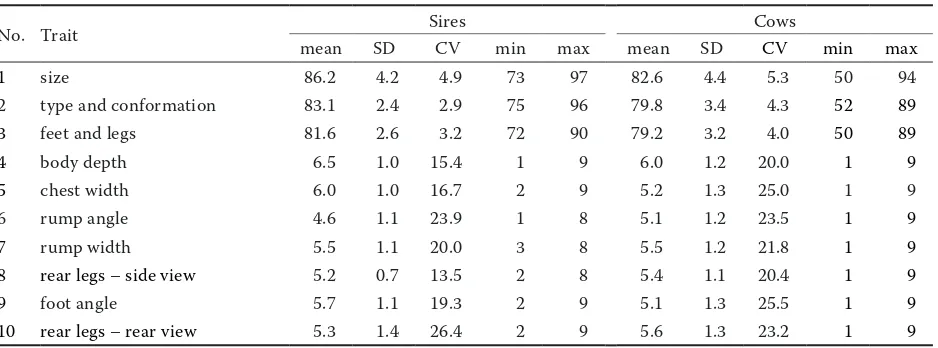
The basic characteristics of the analyzed traits are presented in Table 1. Among the descrip-tive type traits evaluated for both bulls and their daughters, the mean value was the highest for size (bulls: 86.2, cows: 82.6) and the lowest for feet and legs (bulls: 81.6, cows: 79.2). More variable were the traits with the highest means, i.e. size (bulls: standard deviation (SD) = 4.2 and coefficient of variance (CV) = 4.9%; cows: SD = 4.4 and CV = 5.3%). Scores for descriptive traits were lower for cows than for sires, whereas standard deviations were smaller for bulls. Ptak et al. (2011) found similar averages for two descriptive traits scored for another subpopulation of Polish Holstein cows: size (82.08) and feet and legs (79.18). Topolski and Jagusiak (2010) obtained a mean score of 81.28 for feet and legs in the Polish population of young Holstein bulls. In the Czech population of Holstein cows the mean scores for descriptive traits reported by Zavadilova and Stipkova (2012) were also close to our results (81.2 for size, 80.5 for type and conformation, 79.0 for feet and legs). The linear scores for bulls ranged from 4.6 for rump angle to 6.5 for body depth; for cows the range was smaller – the lowest for two traits, rump angle, and foot angle (5.1), and the highest also for body depth (6.0). Generally the linearly scored traits showed higher variation (bulls: CV = 13.5–26.4%; cows: CV = 20.0–25.5%) than descriptive traits
(bulls: CV = 2.9–4.9%; cows: CV = 4.0–5.3%) for both bulls and their daughters. However, all type traits scored for young bulls were slightly less variable than the same traits measured for the daughters. When cows were scored the classifiers used the whole scale of values (1–9), whereas for most linear type traits of bulls the classifiers did not use the full scale. There are three possible explanations of the use of a “shorter” scale: little experience with the classifiers, intensive selection of candidate bulls, or close to optimal environmental conditions of hous-ing (Reinhardt et al. 2005). The averages for linearly scored traits computed for cows were comparable with estimates reported in previous studies by Ptak et al. (2011) and Zavadilova and Stipkova (2012).
The heritabilities of all type traits estimated for bulls and their daughters were low to moderate. Among the descriptive type traits the heritabilities for feet and legs (0.07) and type and conformation (0.21 and 0.24 for sires and cows, respectively) were similar for sires and daughters (Table 2). There was a clear difference in heritability of size: it was higher for cows (0.43) than for sires (0.11). The heritabilities of linearly scored traits were about the same for both sexes except for rump width (0.08 for sires and 0.26 for cows) (Table 2). The heritabilities were the lowest for traits related to legs (0.08–0.12 for bulls, 0.05–0.10 for cows). Chest width showed moderate heritability (0.12 for sires, 0.15 for cows) and the most heritable were body depth (0.25 for sires, 0.19 for cows) and rump angle (0.23 for sires, 0.25 for cows).
[image:3.595.65.534.563.737.2]The differences among the results for bull and cow populations may be related to differences in
Table 1. Characteristics of conformation traits of sires (n = 933) and their daughters (n = 65 479)
No. Trait Sires Cows
mean SD CV min max mean SD CV min max
1 size 86.2 4.2 4.9 73 97 82.6 4.4 5.3 50 94
2 type and conformation 83.1 2.4 2.9 75 96 79.8 3.4 4.3 52 89
3 feet and legs 81.6 2.6 3.2 72 90 79.2 3.2 4.0 50 89
4 body depth 6.5 1.0 15.4 1 9 6.0 1.2 20.0 1 9
5 chest width 6.0 1.0 16.7 2 9 5.2 1.3 25.0 1 9
6 rump angle 4.6 1.1 23.9 1 8 5.1 1.2 23.5 1 9
7 rump width 5.5 1.1 20.0 3 8 5.5 1.2 21.8 1 9
8 rear legs – side view 5.2 0.7 13.5 2 8 5.4 1.1 20.4 1 9
9 foot angle 5.7 1.1 19.3 2 9 5.1 1.3 25.5 1 9
10 rear legs – rear view 5.3 1.4 26.4 2 9 5.6 1.3 23.2 1 9
the scales used for scoring, the statistical mod-els or the skills of the classifiers (Shook 2006; Battagin et al. 2012). Also, Battagin et al. (2012) noted that definitions of type traits, especially descriptive traits, were often dependent on the specific national breeding goals. In our paper the discrepancies between heritabilities of some traits between males and females may be the result of different definitions for the trait in the respective sex. Another reason for diverse heritabilities might be the different genetic structure of analyzed data for both sexes: there were 70 cows and only 5 bulls per sire, on average.
The genetic parameters of cow conformation have been the subject of many papers but there are almost no published studies on type traits of bulls based on their own performance. For most linear type traits of cows the heritabilities were consistent with those reported by Berry et al. (2004), Ptak et al. (2011), and Zavadilova and Stipkova (2012). However, Berry et al. (2004) estimated much higher heritabilities than ours for 3 traits: body depth (0.37), chest width (0.26), and foot angle (0.17). DeGroot et al. (2002), Lassen and Mark (2008), and Nemcova et al. (2011) also obtained heritabilities for most linear traits higher than our estimates. The heritabilities estimated by DeGroot et al. (2002) ranged from 0.04 for foot angle to 0.36 for body depth and rump angle, and estimates reported by Nemcova et al. (2011) ranged from 0.10 for rear
legs – rear view and foot angle to 0.40 for rump width. The heritabilities published by Lassen and Mark (2008) ranged from 0.14 for foot angle to 0.38 for rump angle.
All three leg traits in Polish Holsteins tended to be less heritable, in agreement with results from DeGroot et al. (2002), Nemcova et al. (2011), Ptak et al. (2011), and Zavadilova and Stipkova (2012). The only study in which we found estimates based on the bulls’ own performance was by Reinhardt et al. (2005). They reported heritability higher than ours for rear legs – side view (0.23) and at a similar level for rear legs – rear view (0.11).
The genetic correlations between the same traits scored for cows and their sires were positive and moderate to high (Table 2). Among the descrip-tive traits the genetic correlation between bulls and cows was high for size (0.83) and moderate for type and conformation (0.45) and for feet and legs (0.47). Linearly scored rump angle and all three leg traits showed high genetic correlations (0.76–0.91), and the correlations were the lowest for chest width (0.42) and rump width (0.48).
[image:4.595.69.533.528.735.2]The very high genetic correlations for size, rump angle, and leg traits indicated that the genetic assumptions underlying the inheritance of these traits in bulls were also responsible for inherit-ance of these traits in cows. These high estimates of correlations suggest that scoring for type traits of young bulls would contribute to the classical
Table 2. Additive (σ2
a ) and residual σ2e variances, heritabilities (h2), and genetic correlations (rg) of conformation traits of sires and their daughters
No. Trait Sires Cows
Genetic correlations
σ2
a σ2e h2 SD σ2a σ2e h2 SD rg SD
1 size 1.55 12.61 0.11 0.025 4.85 6.45 0.43 0.019 0.83 0.046
2 type and conformation 1.11 4.10 0.21 0.043 1.92 6.00 0.24 0.017 0.45 0.122 3 feet and legs 0.46 5.91 0.07 0.011 0.56 7.77 0.07 0.010 0.47 0.166
4 body depth 0.23 0.69 0.25 0.034 0.20 0.87 0.19 0.014 0.65 0.080
5 chest width 0.10 0.76 0.12 0.026 0.16 0.91 0.15 0.013 0.42 0.128
6 rump angle 0.29 0.93 0.23 0.036 0.29 0.88 0.25 0.017 0.91 0.024
7 rump width 0.05 0.54 0.08 0.014 0.30 0.85 0.26 0.018 0.48 0.141
8 rear legs – side view 0.04 0.46 0.08 0.024 0.10 0.90 0.10 0.011 0.80 0.054
9 foot angle 0.11 1.06 0.09 0.026 0.06 1.07 0.06 0.009 0.79 0.061
10 rear legs – rear view 0.19 1.43 0.12 0.017 0.07 1.24 0.05 0.005 0.76 0.044
evaluation based on daughter performance and consequently improve the accuracy of type breed-ing value evaluation (rTI).
In Poland the routine type evaluation system is based exclusively on cow phenotypes and assumes a perfect genetic correlation between traits in male and female populations. It is reasonable to include both sires’ and daughters’ scores in the evaluation only if the correlation between the sexes is high enough. Otherwise the bull’s breed-ing value is based mainly on its own phenotype and the daughters’ contribution is proportional to the low genetic correlation. In this case a highly evaluated bull transmits the desired form of the trait to its sons rather than daughters and the ac-curacy of genetic evaluation of cows may be lower than in the routine system.
The accuracy of evaluation based on a sire’s and its daughters’ performance, calculated using a classical selection index procedure, is shown in Figure 1. The reference value of rTI, based on 10 daughters, heritability of 0.25, and the assump-tion that traits for sires and daughters are fully correlated genetically, was 0.63. Figure 1 shows that rTI based on both sires’ and their daughters’ scores was higher than 0.63 at rg = 0.8 or higher, but lower at rg = 0.5. This means that including the sire’s phenotype in type breeding value evalu-ation is reasonable only when rg is large enough. The results obtained in this study suggest that it may be advisable to apply multi-trait breeding
value evaluation including both sires’ and their daughters’ scores for size, rump angle, and three leg traits. The lower genetic correlations of the rest of the examined traits do not provide a basis for using bulls’ scores in the evaluation system.
CONCLUSION
The magnitude of genetic correlations between pairs of type traits of sires and daughters was high enough to suggest that the body conformation of dairy cows can be improved by making use of some measurements taken from young bulls. Including highly correlated bull scores for size, rump angle, and three linear leg traits in the evaluation system could improve the accuracy of type breeding value evaluation.
REFERENCES
Battagin M., Forabosco F., Jakobsen J.H., Penasa M., Lawlor T.J., Cassandro M. (2012): International genetic evalu-ation of Holstein Bulls for overall type traits and body condition score. Journal of Dairy Science, 95, 4721–4731. Berry D.P., Buckley F., Dillon P., Evans R.D., Veerkamp R.F.
(2004): Genetic relationships among linear type traits, milk yield, body weight, fertility and somatic cell count in primiparous dairy cows. Irish Journal of Agricultural and Food Research, 43, 161–176.
Boelling D., Madsen P., Jensen J. (2001): Genetic parameters of foot and leg traits in future AI bulls: II. Correlation to 0.3
0.4 0.5 0.6 0.7 0.8 0.9 1.0
0 10 20 30
rTI
[image:5.595.74.365.97.307.2]Daughter No.
Figure 1. Accuracy of evaluation (rTI) based on bull’s own performance and performance of its daughters for different heritabilities (h2), and genetic correlations (r
g) between traits scored on both sexes
—— h 2 = 0.10 no marker: r g = 1.0 −−− h2 = 0.25 marker ∎: r
g = 0.8 ∙∙∙∙∙∙∙ h2 = 0.50 marker ●: r
g = 0.5
body conformation traits in daughters. Acta Agriculturae Scandinavica, Section A – Animal Science, 51, 122–128. DeGroot B.J., Keown J.F., Van Vleck L.D., Marotz E.L.
(2002): Genetic parameters and responses of linear type, yield traits, and somatic cell scores to divergent selection for predicted transmitting ability for type in Holsteins. Journal of Dairy Science, 85, 1578–1585.
Larssen J., Mark T. (2008): Short communication: Genotype by housing interaction for conformation and workability traits in Danish Holsteins. Journal of Dairy Science, 91, 4424–4428.
Misztal I. (2008): Reliable computing in estimation of vari-ance components. Journal of Animal Breeding and Genet-ics, 125, 363–370.
National Research Institute of Animal Production (2013): Estimation of HF sire breeding values. Available from http://wycena.izoo.krakow.pl/doc/methods_2012_3.pdf (accessed Feb 14, 2014).
Nemcova E., Stipkova M., Zavadilova L. (2011): Genetic parameters for linear type traits in Czech Holstein cattle. Czech Journal of Animal Science, 56, 157–162.
Ptak E., Jagusiak W., Zarnecki A., Otwinowska-Mindur A. (2011): Heritabilities and genetic correlations of
lac-tational and daily somatic cell score with conformation traits in Polish Holstein cattle. Czech Journal of Animal Science, 56, 205–212.
Reinhardt F., Ruten W., Rensing S. (2005): Genetic evalua-tion for feet traits collected from young German Holstein bulls. Interbull Bulletin, 33, 167–170.
Shook G.E. (2006): Major advances in determining ap-propriate selection goals. Journal of Dairy Science, 89, 1349–1361.
Solkner J., Petschina R. (1999): Relationship between type traits and longevity in Austrian Simmental cattle. Inter-bull Bulletin, 21, 91–95.
Topolski P., Jagusiak W. (2010): Phenotypic characteristics of feet and leg type traits in Polish Black-and-White Holstein-Friesian bulls. Roczniki Naukowe Zootechniki, 37, 105–114.
Zavadilova L., Stipkova M. (2012): Genetic correlations between longevity and conformation traits in the Czech Holstein population. Czech Journal of Animal Science, 57, 125–136.
Received: 2014–02–27 Accepted after corrections: 2014–09–26
Corresponding Author
Dr hab. Wojciech Jagusiak, University of Agriculture in Krakow, Faculty of Animal Science, Department of Genetics and Animal Breeding, al. Mickiewicza 24/28, 30-059 Krakow, Poland