Quinoline-8-sulfonamide
1Krzysztof Marciniec,a* Andrzej Mas´lankiewicz,aMaria Nowakband Joachim Kuszb
a
Department of Organic Chemistry, The Medical University of Silesia, Jagiellon´ska 4, 41-200 Sosnowiec, Poland, andbInstitute of Physics, University of Silesia, Uniwersytecka 4, 40-007 Katowice, Poland
Correspondence e-mail: [email protected]
Received 18 July 2012; accepted 27 August 2012
Key indicators: single-crystal X-ray study;T= 298 K; mean(C–C) = 0.003 A˚; Rfactor = 0.029;wRfactor = 0.095; data-to-parameter ratio = 12.1.
In the title compound, C9H8N2O2S, the sulfamoyl NH2group
is involved in intramolecular N—H N and intermolecular N—H O hydrogen bonding. In the crystal, molecules are linked via pairs of N—H O hydrogen bonds, forming inversion dimers, which are further associated through –
stacking interactions between the quinoline benzene rings [centroid–centroid distance = 3.649 (1) A˚ ] into a one-dimen-sional polymeric structure extending along theaaxis.
Related literature
For the use of the quinolinesulfamoyl unit in medicinal chemistry, see: Borras et al. (1999); Eveloch et al. (1981); Zajdelet al.(2011, 2012). For the synthesis, see: Mas´lankiewicz
et al.(2007). For hydrogen-bonding motifs in sufonamides, see: Adsmond & Grant (2001). For graph-set notation of hydrgen-bond motifs, see: Bernsteinet al.(1995).
Experimental
Crystal data
C9H8N2O2S
Mr= 208.23
Monoclinic,P21=n
a= 8.9431 (3) A˚
b= 10.4542 (2) A˚
c= 10.4648 (2) A˚
V= 923.33 (4) A˚
Z= 4
MoKradiation
T= 298 K
0.340.210.18 mm
Data collection
Oxford Diffraction Xcalibur Sapphire3 CCD diffractometer Absorption correction: multi-scan
(CrysAlis RED; Oxford Diffraction, 2008)
Tmin= 0.898,Tmax= 0.944
5936 measured reflections 1636 independent reflections 1446 reflections withI> 2(I)
Rint= 0.014
Refinement
R[F2> 2(F2)] = 0.029
wR(F2) = 0.095
S= 0.97 1636 reflections 135 parameters
H atoms treated by a mixture of independent and constrained refinement
max= 0.31 e A˚3
min=0.36 e A˚3
Table 1
Hydrogen-bond geometry (A˚ ,).
D—H A D—H H A D A D—H A
N2—H1N O2i 0.87 (2) 2.15 (3) 3.013 (2) 169 (2) N2—H2N N1 0.83 (2) 2.33 (2) 2.921 (2) 129 (2)
Symmetry code: (i)xþ1;yþ2;z.
Data collection: CrysAlis CCD (Oxford Diffraction, 2008); cell refinement:CrysAlis CCD; data reduction:CrysAlis RED (Oxford Diffraction, 2008); program(s) used to solve structure:SHELXS97
(Sheldrick, 2008); program(s) used to refine structure:SHELXL97
(Sheldrick, 2008); molecular graphics: Jmol (Hanson, 2010) and
Mercury(Macraeet al., 2006); software used to prepare material for publication:SHELXL97.
This study was supported by the Medical University of Silesia, grant No. KNW-1–073/P/1/0.
Supplementary data and figures for this paper are available from the IUCr electronic archives (Reference: GK2515).
References
Adsmond, D. A. & Grant, D. J. W. (2001).J. Pharm. Sci.90, 2058–2077. Bernstein, J., Davis, R. E., Shimoni, L. & Chang, N.-L. (1995).Angew. Chem.
Int. Ed. Engl.34, 1555–1573.
Borras, J., Scozzafava, A., Menabuoni, L., Mincione, F., Briganti, F., Mincione, G. & Supuran, C. T. (1999).Bioorg. Med. Chem.pp. 2397–2406.
Eveloch, J. L., Bocian, D. F. & Sudmeier, J. L. (1981).Biochemistry,20, 4951– 4954.
Hanson, R. M. (2010).J. Appl. Cryst.43, 1250–1260.
Macrae, C. F., Edgington, P. R., McCabe, P., Pidcock, E., Shields, G. P., Taylor, R., Towler, M. & van de Streek, J. (2006).J. Appl. Cryst.39, 453–457. Mas´lankiewicz, A., Marciniec, K., Pawłowski, M. & Zajdel, P. (2007).
Heterocycles,71, 1975–1990.
Oxford Diffraction (2008). CrysAlis CCD and CrysAlis RED. Oxford Diffraction Ltd, Abington, England.
Sheldrick, G. M. (2008).Acta Cryst.A64, 112–122.
Zajdel, P., Marciniec, K., Mas´lankiewicz, A., Paluchowska, M. H., Satała, G., Partyka, A., Jastrze˛bska-Wie˛sek, M., Wro´bel, D., Wesołowska, A., Duszyn´ska, B., Bojarski, A. J. & Pawłowski, M. (2011).Bioorg. Med. Chem.
pp. 6750–6759.
Zajdel, P., Marciniec, K., Mas´lankiewicz, A., Satała, G., Duszyn´ska, B., Bojarski, A. J., Partyka, A., Jastrze˛bska-Wie˛sek, M., Wro´bel, D., Wesołowska, A. & Pawłowski, M. (2012).Bioorg. Med. Chem.pp. 1545–
Structure Reports
Online
supporting information
Acta Cryst. (2012). E68, o2826 [https://doi.org/10.1107/S1600536812036963]
Quinoline-8-sulfonamide
Krzysztof Marciniec, Andrzej Ma
ś
lankiewicz, Maria Nowak and Joachim Kusz
S1. Comment
Quinolinesulfamoyl moiety is being more and more frequently incorporated into molecules of biologically active
compounds such as carbonic anhydrase inhibitors (Borras et al., 1999) and 5-HT receptors ligands (Zajdel et al., 2011;
Zajdel et al., 2012). Since the quinoline drugs as well as sulfonamides strongly interact with enzymatic receptors via their
nitrogen atoms (Eveloch et al., 1981) we studied the crystal structure of the title compound, to evaluate the spatial
environment of the nitrogen atoms.
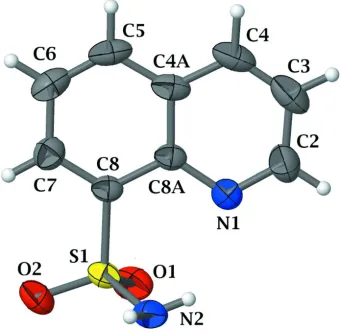
The molecular conformation of quinoline-8-sulfonamide with the adopted atomic numbering is presented in Fig.1. The
sulfonamide group participates in both intra- and intermolecular hydrogen bonding. The H2 atom of the sulfamoyl group
shows an intramolecular contact with the N1 atom of the quinoline ring system (Table 1) resulting in the graph-set motif
of S(6) (Bernstein et al., 1995). In the crystal, the molecules form dimers through N2—H1···O2 hydrogen bonds (Table
1). It is interesting to note that the most commonly observed hydrogen bonding in sulfonamides in the studies reported by
Adsmond &Grant (2001) consing of S=O···H—N chains (50 occurrences in 39 different sulfonamide structures) is absent
in the title compound.
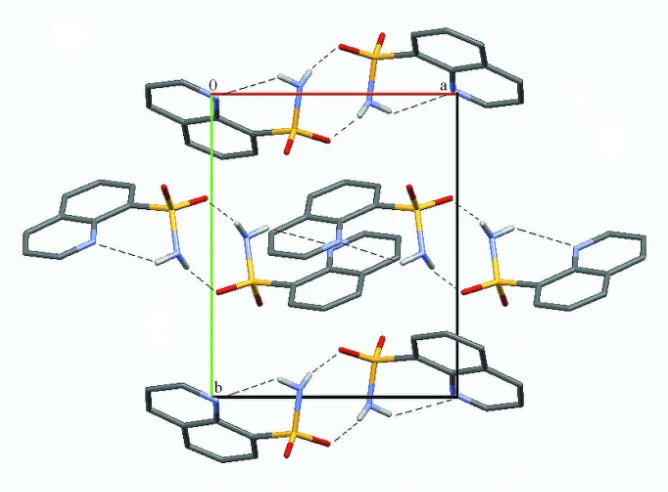
A π-π stacking interaction is observed between the benzene C4A/C5—C8/C8A rings of neighboring dimers with the
centroid-to-centroid distance, Cg···Cg (1 - x, 2 - y, -z) of 3.649 (1) Å and interplanar spacing of 3.373 (1) Å (Fig. 2). The
π–π stacking interaction connects the dimers along the [100] direction forming one-dimesional polymeric structure.
S2. Experimental
The title compound was prepared by the reaction of 8-quinolinesulfonylchloride with an excess ammonia at temperature
of 45°C according to the procedure reported by Maślankiewicz et al. (2007). Single crystals of the title compound
suitable for X-ray structure determination were obtained by recrystallization from an ethanolic solution.
S3. Refinement
The hydrogen atoms participating in hydrogen bonding were located in a difference Fourier map and freely refined. Other
hydrogen atoms were introduced in geometrically idealized positions and refined using a riding-model approximation
Figure 1
Figure 2
π-π stacking interactions (green dashed line) and hydrogen bonds (black dashed lines) in the title crystal structure. H
atoms not involved in hydrogen bonding have been omitted for clarity.
Figure 3
Crystal packing of the title compound along the c axis. Hydrogen bonds are shown as dashed lines. H atoms not involved
[image:4.610.139.473.417.663.2]Crystal data
C9H8N2O2S Mr = 208.23 Monoclinic, P21/n Hall symbol: -P 2yn
a = 8.9431 (3) Å
b = 10.4542 (2) Å
c = 10.4648 (2) Å
β = 109.313 (2)°
V = 923.33 (4) Å3 Z = 4
F(000) = 432
Dx = 1.498 Mg m−3 Melting point: 457.2 K
Mo Kα radiation, λ = 0.71073 Å Cell parameters from 5251 reflections
θ = 3.1–34.5°
µ = 0.32 mm−1 T = 298 K
Polyhedron, colourless 0.34 × 0.21 × 0.18 mm
Data collection
Oxford Diffraction Xcalibur Sapphire3 CCD diffractometer
Radiation source: fine-focus sealed tube Graphite monochromator
Detector resolution: 16.0328 pixels mm-1 ω–scan
Absorption correction: multi-scan
(CrysAlis RED; Oxford Diffraction, 2008)
Tmin = 0.898, Tmax = 0.944
5936 measured reflections 1636 independent reflections 1446 reflections with I > 2σ(I)
Rint = 0.014
θmax = 25.1°, θmin = 3.1° h = −8→10
k = −12→11
l = −12→10
Refinement
Refinement on F2 Least-squares matrix: full
R[F2 > 2σ(F2)] = 0.029 wR(F2) = 0.095 S = 0.97 1636 reflections 135 parameters 0 restraints
Primary atom site location: structure-invariant direct methods
Secondary atom site location: difference Fourier map
Hydrogen site location: inferred from neighbouring sites
H atoms treated by a mixture of independent and constrained refinement
w = 1/[σ2(F
o2) + (0.075P)2 + 0.1368P] where P = (Fo2 + 2Fc2)/3
(Δ/σ)max = 0.001 Δρmax = 0.31 e Å−3 Δρmin = −0.36 e Å−3
Special details
Geometry. All e.s.d.'s (except the e.s.d. in the dihedral angle between two l.s. planes) are estimated using the full covariance matrix. The cell e.s.d.'s are taken into account individually in the estimation of e.s.d.'s in distances, angles and torsion angles; correlations between e.s.d.'s in cell parameters are only used when they are defined by crystal symmetry. An approximate (isotropic) treatment of cell e.s.d.'s is used for estimating e.s.d.'s involving l.s. planes.
Refinement. Refinement of F2 against ALL reflections. The weighted R-factor wR and goodness of fit S are based on F2, conventional R-factors R are based on F, with F set to zero for negative F2. The threshold expression of F2 > σ(F2) is used only for calculating R-factors(gt) etc. and is not relevant to the choice of reflections for refinement. R-factors based on F2 are statistically about twice as large as those based on F, and R- factors based on ALL data will be even larger.
Fractional atomic coordinates and isotropic or equivalent isotropic displacement parameters (Å2)
x y z Uiso*/Ueq
N1 0.98319 (16) 0.98818 (14) 0.31765 (14) 0.0438 (3) N2 0.6409 (2) 1.02696 (16) 0.2070 (2) 0.0501 (4) C2 1.1202 (2) 1.03811 (18) 0.3911 (2) 0.0556 (5) H2 1.1242 1.0848 0.4678 0.067* C3 1.2598 (2) 1.0245 (2) 0.3596 (2) 0.0637 (6) H3 1.3541 1.0596 0.4160 0.076* C4 1.2566 (2) 0.96016 (18) 0.2470 (2) 0.0568 (5) H4 1.3485 0.9520 0.2245 0.068* C4A 1.1134 (2) 0.90515 (16) 0.16339 (19) 0.0430 (4) C5 1.0985 (2) 0.83950 (17) 0.0427 (2) 0.0513 (5) H5 1.1871 0.8287 0.0161 0.062* C6 0.9568 (2) 0.79162 (18) −0.0357 (2) 0.0540 (5) H6 0.9487 0.7495 −0.1161 0.065* C7 0.8221 (2) 0.80560 (16) 0.00428 (17) 0.0448 (4) H7 0.7254 0.7722 −0.0494 0.054* C8 0.83294 (17) 0.86792 (14) 0.12156 (15) 0.0341 (4) C8A 0.97904 (17) 0.92153 (14) 0.20522 (15) 0.0351 (3) H1N 0.603 (3) 1.071 (2) 0.133 (3) 0.059 (6)* H2N 0.722 (3) 1.057 (2) 0.263 (3) 0.065 (7)*
Atomic displacement parameters (Å2)
U11 U22 U33 U12 U13 U23
S1 0.0313 (3) 0.0447 (3) 0.0465 (3) −0.00383 (16) 0.01779 (19) 0.00320 (17) O1 0.0532 (8) 0.0673 (9) 0.0553 (8) −0.0052 (6) 0.0284 (6) 0.0151 (6) O2 0.0352 (6) 0.0582 (8) 0.0648 (8) −0.0102 (5) 0.0106 (6) −0.0017 (6) N1 0.0371 (7) 0.0500 (8) 0.0436 (8) −0.0022 (6) 0.0122 (6) −0.0040 (6) N2 0.0378 (8) 0.0549 (10) 0.0613 (10) 0.0023 (7) 0.0215 (8) −0.0066 (9) C2 0.0484 (10) 0.0542 (11) 0.0545 (11) −0.0042 (8) 0.0039 (8) −0.0058 (8) C3 0.0357 (10) 0.0557 (12) 0.0876 (16) −0.0070 (8) 0.0040 (10) 0.0055 (11) C4 0.0326 (8) 0.0488 (10) 0.0919 (15) 0.0036 (7) 0.0247 (9) 0.0119 (10) C4A 0.0367 (9) 0.0358 (8) 0.0629 (11) 0.0066 (7) 0.0250 (8) 0.0120 (7) C5 0.0562 (11) 0.0431 (9) 0.0718 (12) 0.0111 (8) 0.0443 (10) 0.0076 (9) C6 0.0732 (13) 0.0457 (10) 0.0560 (10) 0.0069 (9) 0.0389 (10) −0.0030 (8) C7 0.0509 (10) 0.0404 (9) 0.0448 (9) −0.0021 (7) 0.0181 (8) −0.0018 (7) C8 0.0337 (8) 0.0322 (8) 0.0396 (8) 0.0008 (6) 0.0166 (6) 0.0045 (6) C8A 0.0333 (8) 0.0328 (8) 0.0418 (8) 0.0017 (6) 0.0161 (7) 0.0047 (6)
Geometric parameters (Å, º)
C2—H2 0.9300 C7—H7 0.9300 C3—C4 1.349 (3) C8—C8A 1.425 (2) C3—H3 0.9300
O1—S1—O2 118.03 (8) C5—C4A—C4 123.55 (17) O1—S1—N2 108.14 (10) C5—C4A—C8A 119.89 (16) O2—S1—N2 106.66 (9) C4—C4A—C8A 116.54 (17) O1—S1—C8 107.39 (7) C6—C5—C4A 121.06 (15) O2—S1—C8 107.79 (8) C6—C5—H5 119.5 N2—S1—C8 108.52 (7) C4A—C5—H5 119.5 C2—N1—C8A 117.50 (15) C5—C6—C7 120.09 (16) S1—N2—H1N 110.7 (15) C5—C6—H6 120.0 S1—N2—H2N 112.0 (16) C7—C6—H6 120.0 H1N—N2—H2N 115 (2) C8—C7—C6 120.29 (16) N1—C2—C3 123.47 (19) C8—C7—H7 119.9 N1—C2—H2 118.3 C6—C7—H7 119.9 C3—C2—H2 118.3 C7—C8—C8A 121.20 (14) C4—C3—C2 119.58 (17) C7—C8—S1 119.61 (12) C4—C3—H3 120.2 C8A—C8—S1 119.17 (12) C2—C3—H3 120.2 N1—C8A—C4A 123.12 (15) C3—C4—C4A 119.77 (17) N1—C8A—C8 119.41 (13) C3—C4—H4 120.1 C4A—C8A—C8 117.45 (15) C4A—C4—H4 120.1
C8A—N1—C2—C3 −0.7 (3) O1—S1—C8—C8A −64.59 (13) N1—C2—C3—C4 1.7 (3) O2—S1—C8—C8A 167.26 (12) C2—C3—C4—C4A −1.2 (3) N2—S1—C8—C8A 52.10 (15) C3—C4—C4A—C5 178.30 (18) C2—N1—C8A—C4A −0.8 (2) C3—C4—C4A—C8A −0.2 (3) C2—N1—C8A—C8 −178.87 (15) C4—C4A—C5—C6 −178.12 (17) C5—C4A—C8A—N1 −177.31 (15) C8A—C4A—C5—C6 0.4 (3) C4—C4A—C8A—N1 1.3 (2) C4A—C5—C6—C7 −1.0 (3) C5—C4A—C8A—C8 0.8 (2) C5—C6—C7—C8 0.4 (3) C4—C4A—C8A—C8 179.37 (14) C6—C7—C8—C8A 0.8 (2) C7—C8—C8A—N1 176.81 (15) C6—C7—C8—S1 −177.78 (13) S1—C8—C8A—N1 −4.61 (19) O1—S1—C8—C7 114.02 (14) C7—C8—C8A—C4A −1.4 (2) O2—S1—C8—C7 −14.14 (15) S1—C8—C8A—C4A 177.22 (11) N2—S1—C8—C7 −129.30 (14)
Hydrogen-bond geometry (Å, º)
D—H···A D—H H···A D···A D—H···A
N2—H1N···O2i 0.87 (2) 2.15 (3) 3.013 (2) 169 (2) N2—H2N···N1 0.83 (2) 2.33 (2) 2.921 (2) 129 (2)