Colour Evaluation of Different Pasta Samples
Ivan ŠVeC, Marie HruŠkoVá, Michaela VítoVá and Hana SekeroVá
Department of Carbohydrate Chemistry and technology, Faculty of Food
and Biochemical technology, Institute of Chemical technology in Prague,
Prague, Czech republic
Abstract
Švec I., Hrušková M., Vítová M., Sekerová H. (2008): Colour evaluation of different pasta samples. Czech J. Food Sci., 26: 421–427.
The colour of the laboratory prepared pasta was evaluated with respect to wheat flour types (M1 bright, M2 semi-bright, and M3 semolina), egg-ratio (0, 1, 2), and non-traditional cereals (archaic wheat species, tritordeum, spring barley, millet, lupin, buckwheat, and soya) supplements. The flour colour measurement confirmed its dependence on the wheat species milled − M3 obtained from durum wheat had a lower whiteness L* (89.6) and a higher yellowness b* (22.2) than the flour from common wheat (e.g. 93.6 and 8.1 for M1, respectively). As presumed, with the rising egg-ratio pasta yellowness increased − for M1-pasta, the calculated colour differences ∆e in pairs one-egg/eggless and two-egg/eggless were 1.1 and 4.7, respectively, while for M2- and M3-pasta ∆e values were only 0.8 and 1.5, respectively. The colour impacts of non-traditional cereals as 10% supplements differed between archaic wheat spe-cies, tritordeum, barley, and alternative cereals (millet, lupin, roasted buckwheat). In comparison to the standard, the greatest positive colour gain was brought by the lupin fortification (130% yellowness increase), while the worst appesred roasted buckwheat (10% decrease of whiteness, 210% increase of redness). At 20% non-traditional cereals supplements compared for M2- and M3-pasta, the highest positive increase of the pasta colour sensory perception was caused by corn and lupin additions in both pasta samples. The increase was slightly higher with M1-pasta (175%) than with M3-pasta (170%). In the mean of both pasta samples, yellowness L* increased from the standard pasta value 13.6 to 24.0 as measured for corn and lupin fortified pasta.
Keywords: reflectance colorimetry; colour evaluation; pasta; non-traditional cereals
Wheat flour and pasta colours are traditionally observed features in terms of customers assessment of the pasta quality. The pigments causing this natu-ral colouring belong to the group of xanthophylls (carotenoids), determined by several methods. McCaig et al. (1992) reported three approaches to measuring the pigment characteristics – visual comparison with standard samples, colorimetry following solvent extraction, and light reflectance measurement. Hentschel et al. (2002) and
oth-ers (e.g. Fratianni et al. 2005; Leenhardt et al. 2006) evaluated the pigment content also by high performance chromatography. Besides that, Abe-cassis et al. (2001) presented the light reflectance procedure based on Commission Internationale de l’Eclairage L*a*b* colour system (CIE 1976) as basic for the pasta manufacture.
var. durum). European pasta consumption is over 3 million tons per year. In the last decade, end-users’ attention focused increasingly on the nu-tritional aspect. There are two ways to achieve healthier product manufacturing – to solve the task of the egg supplement, and to found new nutritionally perspective pasta recipe compounds. In the former case, Khouryieh et al. (2006) studied the possibility of either total or partial replacement of egg substitutes by wheat protein, soya flour, and whey protein. The latter task was solved with the help of non-traditional cere-als – a review was published by Hamr (2007). Rayas-Duarte et al. (1996) studied the effects of buckwheat, amaranth, and lupin flours on durum wheat spaghetti in terms of protein di-gestibility and also of their cooking and sensory quality. Ugarčić-Hardi et al. (2007) examined in their test the influence of various supplements (extruded maize flour, maize, soya, maize or soya flour and their blends, lecithin and wheat straw) on the pasta quality. Those supplements fortify pasta either with minerals (zinc, iron, phospho-rus, etc.), vitamins (B1, B2, E), or dietary fibre and proteins as proved by Torres et al. (2007) in the case of the lupine flour involvement.
Each single change in the pasta recipe modifies more or less the final product colour – usually the whiteness (brighteness) L* and yellowness b* in the colour-space system L*a*b* (CIE 1976). These colours prevail in the flour visible spectra, and predefine the pasta basic shade.
In this work, flour and pasta colours were meas-ured by reflectance colorimeter in the visible spec-tra region. The goal of this study was to assess the influences of the three flour types, egg-ratio and non-traditional cereals supplements on the laboratory prepared pasta colour.
MAtEriAlS AnD MEthoDS
Materials. For the flour colour influence as-sessment, three wheat flour samples (moisture 11.4–12.9% w/w) coming from the harvest in the year 2007 were obtained from commercial mills. The samples M1 and M2 were milled from
t. aestivum and differed from each other in the granulation profile – according to the Czech legal system; the former was bright (fine, smooth) and the latter semi-bright flour. The third sample M3 was semolina from t. durum (semi-bright flour granulation). All flours named were subsequently
used for pasta colour evaluation as affected by egg addition (0, 1 and 2 eggs per 1 kg of flour). The eggs were used non-treated.
Non-traditional cereals supplements were exam-ined at two levels – firstly, the colour contribu-tions of archaic wheat, tritordeum (wheat × barley hybrid), barley, millet, lupin, and buckwheat in the amount of 10% were compared to non-fortified pasta from semi-bright flour “M” (crop 2006). Secondly, both the effects of flour and the sup-plements with corn, buckwheat, millet, lupin, and soya were evaluated. Flour samples semi-bright M2 and semolina M3, applied both in the part concerning the flour influence, were used for the colour assessment and egg-ratio testing.
Methods. Pasta was prepared on the laboratory scale according to the internal standardised pro-cedure (1 kg semi-bright wheat flour and 350 ml of distilled water) (Hrušková & Vítová 2007). Manufacturing was performed on the laboratory pasta press Korngold TR 70 (Korngold AG, Austria) and the product was dried in a double-cabinet dryer Sun 450/2 (Mezos, Czech Republic) to 13.0% of moisture using a one-stage drying cycle.
Flour and pasta colour evaluation was performed using a reflectance colorimeter Minolta CM-2006d, with the proper program Spectra Magic CM-S100w (Konica Minolta, Japan). The dried pasta sample (120 g) was disintegrated on a mill KM4 (OZAP, Czech Republic) and sieved through 485 µm sieve on the machine KS1000 (Retsch, Germany). The samples were then placed into plastic Petri dishes, where the surface was manually levelled to the dish brim and then tightly covered with a plastic film. Colour coordinates L*, a*, b* were measured at five points on the surface in a reflectance regime with the calibration to daily light (D65), using 8 mm diaphragm. From the data, obtained the arithmetic means of the coordinates were calculated together with total colour difference ∆e.
where: X – L*, a*, b*
i – 1, 2, …, n and 0 means a standard
A statistical approach in terms of Student t-test, Tukey’s HSD test, and k-mean cluster analysis (Statistica 7.1, StatSoft Inc., USA) was applied for distinguishing similar effects of non-traditional cereals on the pasta colour with single flour in-volvement (M; M2, and M3, respectively).
∑
−=
∆ 2
0)
(X X
rESultS AnD DiSCuSSion Wheat flour influence
Colour diversity between M1, M2, and M3 is illustrated in Figure 1. Flour origin is documented – bright M1 as well as semi-bright M2 were milled from common wheat, while M3 from durum wheat. The higher carotenoids content in M3 affected its visible spectrum which was significantly diverse with all three L*, a*, b* coordinates × colour differ-ences ∆e with M1 and M2 were comparable (14.7 and 11.7, respectively). Semolina M3 whiteness of 89.6 corresponds with the data published by Feillet et al. (2000). The range for eleven durum wheat samples was 87.3 to 90.8. For M1 and M2, the proportion of white colour was about 5% higher – L* values were 93.6 and 94.3, respectively. On the other hand, a similar comparison of yellow and red shares of the common wheat flours were at the most 50% of M3 b* and a* values, respectively.
recipe components influence – egg ratio
Three pasta types were prepared from flours M1–M3 – the egg content varied from 0 (eggless) to 2 (two-egg). Generally, all the pasta types made from M1 were in terms of whiteness surprisingly close to those from M3, regardless of the differ-ent wheat species milled (Table 1). The observed trend between L* values for one- and two-egg pasta was similar to that for the eggless variant – pasta whiteness was evidently the highest with M2-pasta. However, the yellowness remained
the highest with M3-pasta for all three egg ratios as could be presumed due to the semolina flour type used. On the other hand, the total colour difference ∆e (calculated between one- or two-egg and two-eggless pasta variants for the respective flour, Table 1) shows a positive egg colour effect in the sense of the yellowness enhancement in for M1-pasta. Whole egg pasta colour in the work by
Khouryieh et al. (2006) proved about 30% lower
whiteness (64.9) and at least twice higher yellow-ness (36.2) due to the incomparable recipe used – 24 g of dried whole egg per 200 g of semolina.
recipe components influence – non-traditional cereals supplement
[image:3.595.305.532.111.337.2]A – Effects of archaic wheat, tritordeum, barley, millet, lupin, and buckwheat on the pasta colour A pilot study of non-traditional cereals supple-ments impact on the pasta colour was performed using 10% flour supplement with archaic wheat spe-cies (t. spelta, t. dicoccum, trinaldina cv. D.C.C.P. Denti di Cani and wheat with purple grain cv. Abissinskaja arrasajta), one spring tritordeum cv. HTC 1331a (DH), spring barley cv. Merlin, and Table 1. Colour components – egg ratio effect on pasta colour (flour M1–M3)
Sample(1) L* a* b* ∆e
(a) Eggless pasta
P1-0 88.8a 1.4b 10.2a –
P2-0 91.1b 0.9a 12.8b –
P3-0 88.3a 0.9a 18.5c –
(b) one-egg pasta
P1-1 88.6a 1.7c 11.3a 1.1
P2-1 91.6b 1.3b 12.9b 0.7
P3-1 88.7a 1.2a 19.1c 0.8
(c) two-egg pasta
P1-2 87.3a 2.2b 14.6a 4.7
P2-2 91.3b 1.7a 14.0a 1.5
P3-2 89.1c 1.6a 19.6b 1.5
(1)P1-0.1.2 – pasta from flour M1 in eggless, one-egg and
two-egg variant, respectively
abcMeans with different superscripts in columns and within
the pasta triple indicate significant difference (Tukey’s test, P > 95%)
M3
M1 M2
L
*(
w
hi
te
)
a * (r
ed)
b* (yellow )
[image:3.595.64.285.523.730.2]three alternative cereals from common market (millet, lupin, and roasted buckwheat). Standard pasta was prepared from semi-bright flour “M” (its colour comparable to that of M2) in one-egg version. Table 2 presents the colour measure-ment results, in which a statistical similarity was detected by cluster k-mean analysis. In contrast to the standard pasta without any supplement, the archaic wheat did not influence the colour remark-ably, while tritordeum and spring barley did. The yellow shade of pasta containing tritordeum was
softly increased, while the pasta fortification with barley decreased it slightly (Table 2).
Millet addition improved only the pasta nutri-tional value (data not shown), but both lupin and roasted buckwheat changed the pasta colour profile considerably. Both cereals shifted the pasta position in the colour space along the yellow b* and red
a* axes – the former enhanced the yellow sensory perception by about 27%, the latter worsened the pasta appearance by 10% whiteness reduction and 200% redness increase (Table 2) – common yellow-white colour of the standard pasta was transposed to the medium-brown region.
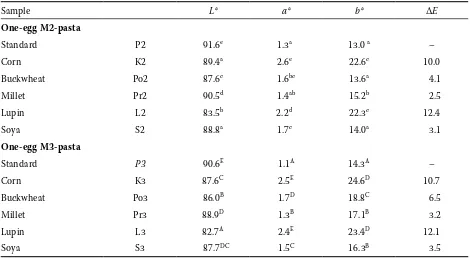
Cluster analysis results are summarised in Ta-ble 3 and plotted in Figure 2. Cluster mean values of coordinates L*, a* and b* were in t-test pairs (results not shown) provably different with the exception of clusters 1 and 3 b* values (22.1 and 21.7, respectively; P > 95%). In the mean of cluster 2, three of four archaic wheat species (samples 1, 2, 3) lowered both pasta whiteness and yellowness. The fourth archaic wheat (4) as well as tritordeum (5) and millet (7) pasta samples were linked to the standard (0) – in Figure 2 can be noticed within cluster 1 the colour of the pasta enriched with tritordeum as relatively outlayed. Due to the barley genes, tritordeum as a wheat × barley cross has
a higher carotenoids content than the common wheat − unprovable slightly intensive yellowness
[image:4.595.64.534.100.291.2]of that pasta can be attributed to a lower rate of the supplement. For the same reason, barley cv. Merlin (6) addition did not significantly contribute to the pasta colour profile. Finally, the pasta colour Table 2. Pasta colour changes by 10% non-traditional cereals supplement
Sample1 L* a* b* ∆e
Standard 0 84.8 2.5 21.0 –
t. spelta 1 85.2 2.2 19.9 1.2
t. dicoccum 2 82.4 2.4 19.7 2.7
Trinaldina 3 84.5 2.3 19.7 1.3
Abissinskaja arrasajta 4 84.7 2.7 21.1 0.2
Tritordeum 5 84.6 2.5 23.7 2.7
Spring barley cv. Merlin 6 84.6 2.6 20.2 0.8
Millet 7 85.1 2.6 21.7 0.8
Lupin 8 81.8 3.8 26.8 6.7
Buckwheat 9 76.9 5.2 21.7 8.4
1One-egg pasta based on the flour M (harvest 2006)
Figure 2. Cluster analysis of pasta colour changes by 10% non-traditional cereals supplement
1 3 2
5 7
0
6 4
8
9
Cluster 1 Cluster 2
Cluster 3 Cluster 4
a * (red
)
b* (yellow )
L
*(
w
hi
te
[image:4.595.63.285.490.720.2]change caused by lupin and buckwheat supple-ments was statistically confirmed as dissimilar both to each other and also to the standard, thus clusters 3 and 4 included pasta with buckwheat and lupin additions, respectively.
B – Effects of corn, millet, buckwheat, lupin and soya and two basic flours on the pasta colour In the second step of the non-traditional cereals supplements testing, the impacts of the use or five selected crops (corn, millet, buckwheat, lupin and soya) on the pasta colour were tested. Contrary to the previous step, pasta from two flour types (semi-bright M2 and semolina M3) was com-pared at a twofold flour supplement (20%). The
L*, a* and b* values determined (Table 4) were statistically assessed both by Tukey’s test for the pasta samples prepared from every single flour
and also by k-mean cluster analysis to estimate the flour type effect at increased percentage of the addition.
In comparison of the individual flours M2 and M3, a similar effect of non-traditional cereals addi-tion on the pasta colour was observed. The colour of the pasta fortified with millet or buckwheat was
Cluster 1 Cluster 2 Cluster 3 Cluster 4
P3 P2
Pr3 Pr2
Po2 S3 S2
Po3
L2 L3
K3 K2
b
*(y ellow
)
L
*(
w
hi
te
)
a* (red)
Cluster 1 Cluster 2 Cluster 3
Cluster 4 Cluster 5
[image:5.595.318.507.84.307.2]Figure 3. Cluster analysis of pasta colour changes by 20% non-traditional cereals supplement – flour M2, M3 influence
Table 4. Pasta colour changes by 20% non-traditional cereals supplement – flour M2, M3 influence
Sample L* a* b* ∆e
one-egg M2-pasta
Standard P2 91.6e 1.3aa 13.0 a –
Corn K2 89.4a 2.6ee 22.6c 10.0
Buckwheat Po2 87.6c 1.6bc 13.6a 4.1
Millet Pr2 90.5d 1.4ab 15.2b 2.5
Lupin L2 83.5b 2.2dd 22.3c 12.4
Soya S2 88.8a 1.7cc 14.0a 3.1
one-egg M3-pasta
Standard P3 90.6E 1.1A 14.3A –
Corn K3 87.6C 2.5E 24.6D 10.7
Buckwheat Po3 86.0B 1.7D 18.8C 6.5
Millet Pr3 88.9D 1.3B 17.1B 3.2
Lupin L3 82.7A 2.4E 23.4D 12.1
[image:5.595.62.291.128.206.2]Soya S3 87.7DC 1.5C 16.3B 3.5
Table 3. Cluster analysis of pasta colour changes by 10% non-traditional cereals supplement − cluster members and means
Coordinate 1 Cluster
0; 4; 5; 7 1; 2; 3; 62 3 9 4 8
L* 84.9 84.2 76.9 81.8
a* 2.5 2.4 5.2 3.8
[image:5.595.63.533.500.758.2]close to that of standard pasta, while the supple-ment with corn or lupin intensified the overall pasta colour shade (Table 4). The comparison of the effects of 10% and 20% basic flour supple-ments showed that the lower addition impact was insignificant – it the total colour difference (∆e) values are shown in Tables 2 and 4.
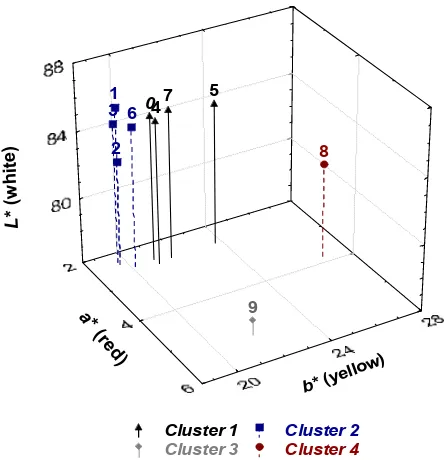
Clustering was performed in correspondence with Tukey’s test in which five homogenous groups prevailed (Table 4). The five cluster members ob-tained and the means are summarised in Table 5 and plotted in Figure 3. Apart from cluster 4, a noticeable uniformity exists within clusters as concerns either the flour type (clusters 1, 2), or the cereals used for the fortification (clusters 2, 5). Between L*, a*, b* values in the ten possible cluster pairs (i.e. thirty values in total), in seven cases no dissimilarity was proved by t-test (e.g. between the values concerning clusters 1 and 2 L* or clusters 2 and 5 b*), which indicates clusters overlapping caused by higher standard deviations. Figure 3 illustrates the differences between the colour con-tributions of the cereals used – millet, buckwheat, and soya supplements did not affect the pasta colour in terms of L* and b* parameters as much as corn and lupin. Moreover, the cluster analysis disclosed also the difference in the decrease level of the pasta whiteness between corn and lupin fortifications (cluster 2, 5), which was about 7% higher in the case of lupin supplement.
ConCluSionS
It was confirmed, that semolina colour com-pared to that of common wheat flour has a better CIEL*a*b* profile due to the durum wheat origin. The higher yellowness b* and lower whiteness L* of semolina were reflected in the pasta colour at the egg-ratio testing (0, 1 and 2 eggs per flour) – the pasta colour was the most pleasant but the
yellowness increase was the lowest. The total colour difference ∆e reached the highest values with the pasta from common bright wheat – in comparison with semolina pasta, the increase was three times higher.
The supplement of wheat flour with 10% of non-traditional cereals affected the pasta colour differ-ently according to the cereal type – the addition of fine flour from four archaic wheat species did not change the pasta colour seriously, a slight whiteness lowering was observed. Tritordeum supplement supported the pasta yellowness softly while spring barley caused a comparable decrease. These oscillations could be connected with differ-ent colours of both materials used for the addition. Also the colour of the pasta fortified with millet was comparable to the standard, but both lupin and buckwheat involved into the recipe affected the pasta colour provably but differently. The sensory pasta colour perception was positively raised by the lupin supplement, that pasta was yellower than the two-egg semolina pasta. On the other hand, 10% of roasted buckwheat shifted thet colour of the product into, the undesirable middle-brown region.
The comparison between semi-bright and semo-lina one-egg pasta types by k-mean analysis dis-closed differences between 20% corn, lupin, millet, buckwheat, and soya supplements. Regardless of the flour type base, the pasta fortification with all ce-reals named brought about a colour improvement. In comparison of the lupin and corn supplements to those of the others, the yellow component gain was almost twice as high – but at the same time both b* values were similar to that found for pasta from common semi-bright flour with 10% of lupin only. For the corn and lupin practical applications in pasta manufacturing, the added percentage and then colour intensifying could be related propor-tionally to the dough handling properties. Table 5. Cluster analysis of pasta colour changes by 20% non-traditional cereals supplement (comparison of M2–M3 flour) − cluster members and means
Coordinate Po3, Pr3, S3Cluster 1 Cluster 2K2, K3 Cluster 3Po2, S2 Pr3, P2, P3Cluster 4 Cluster 5L2, L3
L* 87.5 88.5 88.2 90.9 83.1
a* 1.5 2.6 1.6 1.3 2.3
references
Abecassis J., Autran J.C., Feillet P. (2001): Durum Wheat, Semolina and Pasta Quality: Recent Achieve-ments and New Trends. Editions Quae, Versailles. Feillet P., Autran J.-C., Icard-Vernière C. (2000):
Pasta brownness: An assessment. Journal of Cereal Science, 32: 215–233.
Fratianni A., Irano M., Pamfilu G., Acquistucci R. (2005): Estimation of color of durum wheat. Comparison of WSB, HPLC, and reflectance colorimeter measure-ments. Journal of Agricultural and Food Chemistry, 53: 2373–2378.
Hamr K. (2007): Těstoviny dnes a zítra. Ročenka pekaře a cukráře 2007: 100–108.
Hentschel V., Kranl K., Hollmann J., Lindhauer M.G., †Böhm V., Bitsch R. (2002): Spectrophotometric determination of yellow pigment content and evaluation of carotenoids by High-performance liquid chroma-tography in durum wheat grain. Journal of Agricultural and Food Chemistry, 50: 6663–6668.
Hrušková M., Vítová M. (2007): Laboratorní těstárenský pokus. Mlynské noviny, XViii: 7–9.
Khouryieh H., Herald T., Aramouni F. (2006): Quality and sensory properties of fresh egg noodles formulated with either total or partial replacement of egg substi-tutes. Journal of Food Science, 71: 433–437.
Leenhardt F., Lyan B., Rock E., Boussard A., Potus J., Chanliaud E., Remesy C.(2006): Genetic vari-ability of carotenoid concentration, and lipoxygenase and peroxidase activities among cultivated wheat spe-cies and bread wheat varieties. European Journal of Agronomy, 25: 170–176.
McCaig T.N., McLeod J.G., Clarke J.M., DePauw R.M. (1992): Measurement of durum pigment with a near-infrared instrument operating in the visible range. Cereal Chemistry, 69: 671–672.
Rayas-Duarte P., Mock C.M., Satterleei L.D. (1996): Quality of spaghetti containing buckwheat, amaranth, and lupin flours. Cereal Chemistry, 73: 381–387. Torres A., Frias J., Granito M., Guerra M.,
Vidal-Valverde C. (2007): Chemical, biological and sen-sory evaluation of pasta products supplemented with α-galactoside-free lupin flours. Journal of the Science of Food and Agriculture, 87: 74–81.
Ugarčić-Hardi Ž., Jukič M., Koceva-Komlenić D., Sabo M., Hardi J. (2007): Quality parameters of noo-dles made with various supplements. Czech Journal of Food Sciences, 25: 151–157.
Received for publication April 25, 2008 Accepted after corrections November 11, 2008
Corresponding author:
Ing. Ivan Švec, Vysoká škola chemicko-technologická v Praze, Fakulta potravinářské