In animal breeding and husbandry extensive
ef-forts have been exerted to more efficient production
of leaner meat (Wegner
et al
., 2000). The breeding
programmes of beef ca�le involve carcass quality
and the beef production traits are taken into
ac-count only indirectly. The net effects of the selection
for improved efficiency of beef production depend
on a large number of interacting effects within the
production system. Considerable a�ention has been
paid to the carcass traits of ca�le, e.g. slaughter
weight, lean and fat content and most of the traits
have been found to be of high or moderate
herit-ability (Gregory
et al
., 1994; Wheeler
et al
., 1996;
Parkkonen
et al
., 2000). Some of the studies
estab-lished a relationship between the breed of the sires
and the carcass composition of slaughtered bulls.
The objective of this study was to contribute to the
elucidation of these relationships within beef ca�le
breeding in the Czech Republic.
MATERIAL AND METHODS
The bulls were fa�ened
in 1997–2001 and
slaugh-tered at the age of 500 ± 30 days. The average age
at slaughter of all the groups of fa�ened bulls was
507 days, ranging between 514 and 498 days. The
dif-ferences in the age between the individual groups
were not statistically significant. The tested sire
breeds were Aberdeen Angus (AA; 4 sires), Blonde
d’Aquitaine (BA; 3 sires), Belgian Blue (BB; 1 sire),
Charolais (CH; 14 sires), Hereford (HE; 4 sires),
Limousine (LI; 4 sires), and Piemontese (PI; 4 sires).
The cows used as dams came from a population of
dairy cows. The control groups consisted of bulls of
the Czech Pied (C; 2 sires) and Holstein (H; 7 sires)
ca�le. The feed ration was based on the
methodol-ogy applied for the testing station and consisted
of maize silage, lucerne silage and concentrates.
The average daily gains during the fa�ening
pe-Supported by the Ministry of Agriculture of the Czech Republic (Project No. QC 1083).
Carcass value of the progeny of tested beef bulls
P. P�����
1, J. Š����
2, M. B�����
1, K. U�����������
3, R. F�������
21
Research Institute for Cattle Breeding, Ltd., Rapotín, Czech Republic
2
Mendel University of Agriculture and Forestry, Faculty of Agriculture, Brno, Czech Republic
3ZŘUD-Slaughterhouse Polička, Polička, Czech Republic
ABSTRACT: In the study focused on the estimation of the efficiency of beef cattle in the conditions of the Czech Republic, 361 half-carcasses of the offspring of crossbred bulls of tested young beef sires were dissected. The bulls were fa�ened together and slaughtered at the age of 500 ± 30 days. The tested breeds were Aberdeen Angus (AA), Blonde d’Aquitaine (BA), Belgian Blue (BB), Charolais (CH), Hereford (HE), Limousine (LI), and Piemontese (PI). The control groups were bulls of the Czech Pied (C) and Holstein (H) breeds. The best commercial class according to the SEUROP system was found in the offspring of Charolais sires (3.17). The fat content was the highest in the BB group (2.45) and the lowest (P < 0.01) in the PI group (1.50). The average hot carcass weight was 332.54 kg and was significantly (P < 0.05) the lowest in bulls of the HE group (290.50 kg). A�er dissection the dressing percentage of meat, bone, separable fat, and the meat/bone ratio were calculated. The average meat percentage in the carcass was 78.47%. The dressing percentage of meat of PI group was 80.33% and was the highest of all the groups (P < 0.01). H group showed the highest proportion of bones (19.79%), which was by 2% higher than in PI group. The content of separable fat ranged between 1.29 and 3.68%.
riod ranged between 1 100 and 1 200 g. The bulls
were slaughtered in the ZŘUD-Slaughterhouse in
Polička. A total number of 361 tested bulls of various
commercial types were slaughtered and analysed.
The representation of the individual commercial
types was given by the targeted selection of calves
for the tests and based on the breed of the father
(see the following table):
Commercial type/breed
of father
Number of tested
bulls
AA
33
BA
28
BB
11
C
11
CH
129
H
53
HE
10
LI
50
PI
36
The weight of dressed carcass and of kidney and
pelvic fat was controlled in the course of
slaugh-tering. Cooled right half-carcasses were cut into
quarters between the 8th and 9th (pectoral)
ver-tebra. The dissection of 361 half-carcasses of the
progeny of the tested bulls was based on
dissec-tion standards of the meat industry of the Czech
Republic. Determined were the weights of meat,
bones and separable fat. The meat was divided into
two groups. The 1st grade meat was meat from the
shoulder, rump, loin and fillet. The other parts of
carcasses were classified as 2nd grade meat. A�er
dissection the dressing percentage of meat, bone,
separable fat, and meat/bone ratio were calculated.
The data analysis was processed using the Unistat
programme version 4.53a.
RESULTS AND DISCUSSION
The average carcass weight of the 361 slaughter
bulls was 325.5 kg. The carcass weight basically
corresponded to the weight category of the bulls
(Table 1). The highest carcass weight, with a
pre-dominantly insignificant difference in age at the
time of slaughter (498-514 days), was recorded in
ca�le of larger body framework, i.e. progeny of Ch,
C and BA fathers. The lowest carcass weight was
recorded in sons of HE and AA fathers (
P
<
0.01
and
P
<
0.05, respectively). Table 1 also classifies
the carcasses on the basis of the SEUROP standard;
this is a very important parameter that evaluates the
quality of dressed carcass meat. The lean and fat
con-tent of the bull’s body were evaluated. The highest
proportion of lean was found out in the Charolais
group (3.17 points); the classification of bulls of the
AA and HE groups was not so favourable (i.e. 3.94;
P
<
0.01 and 3.80;
P
>
0.01, respectively). The best
and highly significant (respectively
P
<
0.01 and
P
<
0.05) fat content of the carcass was recorded in the
crossbred offspring of PI fathers (1.50 ± 0.56). The fat
content of the BB group was nearly by 1 point (+0.95
point) lower (2.45 points). The fat content of LI group
was also lower (1.88 ± 0.69). The inter-group
vari-ability of the fat content ranged between 27 and 52%.
Classification of the lean content of the groups of
slaughter bulls showed more balanced results. Šubrt
et al
. (2000) and Polách
et al
. (2000) reached similar
conclusions in terms of the carcass quality.
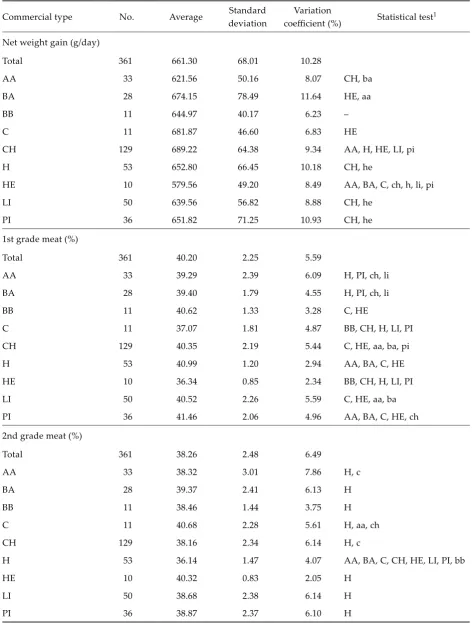
The net weight gain (
P
<
0.05 and
P
<
0.01) (Table 2)
was the lowest in the progeny of HE sires (579.56 ±
49.20 g/day). CH group showed the highest (
P
<
0.01)
intensity of carcass growth (689.22 ± 64.38 g/day).
The average value of the whole group was 661.30 ±
68.01 g/day. Teslík
et al
. (1995) found net weight gains
in bulls C (575 g/day) and H (548 g per day), which
were lower by about 106–104 g/day, respectively
compared to our results. The results described by
Polách
et al
. (2000) were lower and ranged from
37.21 g/day in AA group to 111.10 g per day in
C group. Frelich and Voříšková (1997) reported
lower values, i.e. 6.76 g/day in LI, 9.47 g per day in
C, 17.52 g/ day in PI to 23.95 g/day in BA, and higher
values in groups CH (3.18 g/ day), HE (30.24 g/day),
BB (54.13 g/day) and AA (54.54 g per day). The
con-tent of the 1st grade meat in the carcass was 40.20 ±
2.25% in the whole group. The percentage (41.46%)
was the highest in PI group and the lowest (
P
<
0.01)
in HE (36.34%). Šubrt (1994) reported higher values
in groups HE (36.72%) and C (37.27%) and lower
values in the sons of PI(38.14%), BA (36.82%) and
CH (36.72%) sires. Bartoň
et al
. (1998) discovered a
higher content of 1st grade meat in breeds C, CH
and BB. H group had the lowest (
P
<
0.01)
propor-tion of 2nd grade meat (36.14%) and the C bulls the
highest (40.68%). The average value of the whole
set was 38.26%. Voříšková
et al
. (1998) reported
higher values of about 5.82–8.56% and Šubrt (1994)
reported similar results, i.e. by about 1.47–4.75%
higher than ours.
Table 1. Carcass characteristics
Commercial type No. Average deviationStandard coefficient (%)Variation Statistical test1
Hot carcass (kg)
Total 361 332.54 32.76 9.85
AA 33 312.06 25.29 8.10 h, he, ba
BA 28 336.29 38.65 11.49 HE, aa
BB 11 322.82 20.08 6.22 –
C 11 339.36 22.93 6.76 HE
CH 129 346.49 31.54 9.10 AA, HE, LI, PI
H 53 333.92 23.68 7.09 HE, aa
HE 10 290.50 24.38 8.39 BA, C, CH, PI, aa, li
LI 50 319.86 29.30 9.16 CH, he
PI 36 326.55 35.56 10.88 CH, HE
Meat class (SEUROP)2
Total 361 3.40 0.70 20.59
AA 33 3.94 0.50 12.69 CH, LI, PI, h
BA 28 3.57 0.57 15.97 –
BB 11 3.27 1.01 30.89 –
C 11 3.27 0.47 14.37 –
CH 129 3.17 0.73 23.03 AA, h
H 53 3.53 0.54 15.30 aa, ch
HE 10 3.80 0.42 11.05 –
LI 50 3.40 0.67 19.71 AA
PI 36 3.36 0.72 21.43 AA
Fat class (SEUROP)2
Total 361 2.16 0.75 34.72
AA 33 2.21 0.60 27.15 PI
BA 28 2.32 0.55 23.71 PI
BB 11 2.45 0.69 28.16 PI
C 11 1.91 0.83 43.46 –
CH 129 2.37 0.70 29.54 PI
H 53 2.25 0.83 36.89 PI
HE 10 2.20 1.14 51.82 pi
LI 50 1.88 0.69 36.70 CH, pi
PI 36 1.50 0.56 37.33 AA, BA, BB, CH, H, li, he
1P > 0.01 = AA, BA, BB, C, CH, H, HE, LI, PI P > 0.05 = aa, ba, bb, c, ch, h, he, li, pi
Table 2. Parameters of carcass yield
Commercial type No. Average Standard deviation
Variation
coefficient (%) Statistical test1 Net weight gain (g/day)
Total 361 661.30 68.01 10.28
AA 33 621.56 50.16 8.07 CH, ba
BA 28 674.15 78.49 11.64 HE, aa
BB 11 644.97 40.17 6.23 –
C 11 681.87 46.60 6.83 HE
CH 129 689.22 64.38 9.34 AA, H, HE, LI, pi
H 53 652.80 66.45 10.18 CH, he
HE 10 579.56 49.20 8.49 AA, BA, C, ch, h, li, pi
LI 50 639.56 56.82 8.88 CH, he
PI 36 651.82 71.25 10.93 CH, he
1st grade meat (%)
Total 361 40.20 2.25 5.59
AA 33 39.29 2.39 6.09 H, PI, ch, li
BA 28 39.40 1.79 4.55 H, PI, ch, li
BB 11 40.62 1.33 3.28 C, HE
C 11 37.07 1.81 4.87 BB, CH, H, LI, PI
CH 129 40.35 2.19 5.44 C, HE, aa, ba, pi
H 53 40.99 1.20 2.94 AA, BA, C, HE
HE 10 36.34 0.85 2.34 BB, CH, H, LI, PI
LI 50 40.52 2.26 5.59 C, HE, aa, ba
PI 36 41.46 2.06 4.96 AA, BA, C, HE, ch
2nd grade meat (%)
Total 361 38.26 2.48 6.49
AA 33 38.32 3.01 7.86 H, c
BA 28 39.37 2.41 6.13 H
BB 11 38.46 1.44 3.75 H
C 11 40.68 2.28 5.61 H, aa, ch
CH 129 38.16 2.34 6.14 H, c
H 53 36.14 1.47 4.07 AA, BA, C, CH, HE, LI, PI, bb
HE 10 40.32 0.83 2.05 H
LI 50 38.68 2.38 6.14 H
PI 36 38.87 2.37 6.10 H
Table 3. Content of prime cuts from carcass
Commercial type No Average deviationStandard coefficient (%)Variation Statistical test1 Shoulder (%)
Total 361 7.00 0.94 13.50
AA 33 6.76 0.67 9.89 BA, BB, ch
BA 28 7.79 1.12 14.32 AA, C, CH, H, HE, LI, PI
BB 11 8.07 0.67 8.36 AA, C, CH, H, HE, LI, PI
C 11 6.22 0.42 6.83 ba, bb, ch
CH 129 7.21 0.95 13.23 BA, BB, C, H, HE, aa
H 53 6.42 0.48 7.42 BA, BB, CH, li, pi
HE 10 6.17 0.25 3.98 BA, BB, CH
LI 50 6.88 0.99 14.35 BA, BB, h
PI 36 6.97 0.76 10.96 BA, BB, h
Rump (%)
Total 361 19.23 1.93 10.04
AA 33 18.08 1.48 8.16 BA, BB, CH, LI, PI
BA 28 20.66 2.21 10.69 AA, C, H, HE, ch, pi
BB 11 21.19 0.49 2.32 AA, C, H, HE, ch, li, pi
C 11 17.50 1.18 6.76 BA, BB, CH, LI, PI
CH 129 19.75 1.72 8.72 AA, C, H, HE, ba, bb
H 53 17.47 0.95 5.41 BA, BB, CH, LI, PI
HE 10 16.79 1.11 6.61 BA, BB, CH, LI, PI
LI 50 19.93 1.72 8.61 AA, C, H, HE, bb
PI 36 19.51 1.50 7.71 AA, C, H, HE, ba, bb
Loin (%)
Total 361 4.20 1.07 25.46
AA 33 4.08 0.84 20.50 PI, c
BA 28 3.96 1.22 30.92 PI, bb
BB 11 3.24 0.32 9.96 C, LI, PI, ba
C 11 4.99 1.03 20.57 BB, aa, ch, h
CH 129 4.03 1.01 24.95 LI, PI, c
H 53 3.96 0.53 13.46 PI, c, li
HE 10 4.11 1.45 35.25 Pi
LI 50 4.56 1.27 27.93 BB, CH, h, pi
PI 36 5.09 0.99 19.54 AA, BA, BB, CH, H, he, li
Fillet (%)
Total 361 1.42 0.30 21.19
AA 33 1.32 0.19 14.53 BA, BB, ch, li
BA 28 1.64 0.29 17.78 AA, C, CH, H, HE, PI, li
BB 11 1.73 0.17 10.01 AA, C, H, HE, PI, ch, li
C 11 1.25 0.14 10.89 BA, BB
CH 129 1.47 0.23 15.69 BA, H, aa, bb, he
H 53 1.22 0.11 8.92 BA, BB, CH, LI
HE 10 1.20 0.12 9.56 BA, BB, ch, li
LI 50 1.50 0.54 36.14 H, aa, ba, bb, he
PI 36 1.38 0.13 9.32 BA, BB
Table 4. Content of tissues in carcass
Commercial type No Average deviationStandard coefficient (%)Variation Statistical test1 Meat (%)
Total 361 78.47 1.65 2.10
AA 33 77.61 1.55 2.00 BA, CH, LI, PI, bb
BA 28 78.77 2.07 2.63 AA, H, HE, PI
BB 11 79.09 0.79 1.00 H, HE, aa, pi
C 11 77.75 1.96 2.52 PI, li
CH 129 78.51 1.30 1.66 AA, H, HE, PI, li
H 53 77.13 0.99 1.28 BA, BB, CH, LI, PI
HE 10 76.66 1.14 1.49 BA, BB, CH, LI, PI
LI 50 79.21 1.32 1.67 AA, H, HE, PI, c, ch
PI 36 80.33 1.39 1.73 AA, BA, C, CH, H, HE, LI, bb
Bone (%)
Total 361 18.77 1.28 6.82
AA 33 19.55 1.38 7.06 BA, CH, LI, PI, c
BA 28 18.34 1.22 6.65 AA, H, pi
BB 11 18.84 0.90 4.78 H
C 11 18.47 0.92 4.98 H, aa
CH 129 18.83 1.16 6.16 AA, H, LI, PI
H 53 19.79 0.94 4.75 BA, C, CH, LI, PI, bb, he
HE 10 18.72 0.76 4.06 h, pi
LI 50 18.19 1.06 5.83 AA, CH, H, pi
PI 36 17.36 1.16 6.59 AA, CH, H, ba, bb, he, li
Fat (%)
Total 361 1.97 1.02 51.78
AA 33 2.03 1.10 54.19 HE, PI
BA 28 2.10 1.92 91.43 HE, PI
BB 11 1.35 0.46 34.07 H, HE
C 11 2.25 1.11 49.33 HE, pi
CH 129 1.86 0.80 43.01 H, HE, PI
H 53 2.49 0.67 26.91 BB, CH, HE, LI, PI
HE 10 3.68 1.20 32.61 AA, BA, BB, C, CH, H, LI, PI
LI 50 1.79 0.67 37.43 H, HE, pi
PI 36 1.29 0.54 41.86 AA, BA, CH, H, HE, c, li
Meat/bone ratio
Total 361 4.20 0.36 8.57
AA 33 3.99 0.35 8.77 BA, CH, LI, PI
BA 28 4.32 0.34 7.87 AA, H, PI,
BB 11 4.21 0.24 5.70 PI, h
C 11 4.22 0.27 6.40 PI, h
CH 129 4.19 0.31 7.40 AA, H, LI, PI
H 53 3.91 0.22 5.63 BA, CH, LI, PI, bb, c
HE 10 4.10 0.20 4.88 PI
LI 50 4.37 0.31 7.09 AA, H, CH
PI 36 4.59 0.38 8.28 AA, BA, BB, C, CH, H, HE, LI
the highest in the BB group (8.07 ± 0.67%), and the
lowest in the HE progeny (6.17 ± 0.25%). Statistically
significant differences at levels (
P
<
0.01) and (
P
<
0.05) were found between the groups. Nová and
Louda (2000) found similar proportions of shoulder.
HE group (16.79%) had the lowest average
propor-tion of rump, followed by groups H < C < AA < PI <
CH < LI < BA < BB (21.19%). Polách (1998) described
higher values in crossbred sons of beef bulls AA
(21.88%), BA (24.05%), BB (24.01%), CH (23.21%)
and LI (23.68%). Nová and Louda (2000) indicated
19.5% as the average rump percentage. The
percent-age of loin ranged from 3.24% (BB) to 5.09% in sons
of the PI sires (
P
<
0.01). The average for the whole
set was 4.20%. Polách (1998) reported values from
5.00% in C to 5.25 in AA. According to Voříšková
et
al
. (1998) a lower value (3.21–3.76%) was achieved in
crossbred bulls. HE group had the lowest
percent-age of fillet, i.e. 1.20%. The statistically significantly
(
P
<
0.01) highest percentage (1.73%) was recorded
in the offspring of BB sires. Nová and Louda (2000)
indicated a higher average value of the fillet
per-centage, i.e. 1.9%. Polách (1998), Voříšková
et al
.
(1998) reported lower contents of the fillet.
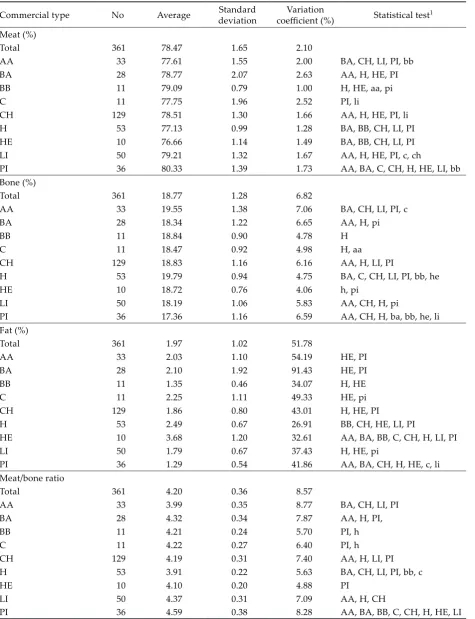
A�er dissection the dressing percentage of meat,
bone, separable fat, and meat/bone ratio were
cal-culated (Table 4). The average meat percentage in
the carcass was 78.47%. In PI group the dressing
percentage of meat was 80.33 ± 1.39%, the highest
of all the groups of the set (
P
<
0.01), and was
fol-lowed by groups LI > BB > BA > CH > C > H > AA >
HE (76.66%). Bartoň
et al
. (1998) determined higher
values of the meat content for crossbred bulls of CH
(81.70%), BB (82.20%), and C (80.80%). However,
Voříšková
et al
. (1998) reported lower values in
crossbred bulls (74.47–77.74% in AA and BA,
respec-tively). Suchánek
et al
. (1990) stated that the meat
content in the carcass of C bulls was 78.50%. The
highest percentage of bones was found in H group
(19.79%). It was by 2% more than PI group. The
content of separable fat was 1.29–3.68% (PI and
HE, respectively). Our results were similar to the
studies of Keane
et al
. (1990), and Keane (1994).
The differences in the percentage of separable fat
yield were highly significant (
P
<
0.01). The
high-est value (3.68 ± 1.20%) was recorded in HE group.
The value (4.59 ± 0.38) of the meat/bone ratio was
the statistically highly significantly (
P
<
0.01)
high-est in PI group. It was associated with the highhigh-est
percentage yield of meat and the lowest percentage
of bones in this group. Crossbreeding dairy cows
with sires of beef breeds improved the quality of the
carcass of their offspring. However, crossbreeding
with small frame breeds (AA, HE) impaired the
quality of the carcass.
By analysing the meat efficiency of bulls of the
most frequently fa�ened commercial types in
condi-tions of the Czech Republic, important differences
in the quality rating (SEUROP) and composition of
the carcasses were discovered. The highest rating
of the lean content was recorded in carcasses of the
progeny of bulls of larger body frames (Charolais,
Blonde d’Aquitaine, Czech Pied, and/or Belgian
Blue); however, technological analyses of total meat
gains showed that these breeds were only slightly
above the average of the whole group of the studied
slaughter bulls. The carcass composition (meat, fat
and bone yields) of the progeny of Limousin and
Piemontese bulls was more favourable. The
differ-ences in the proportion of rump, shoulder and
fil-let of the Belgian Blue breed were highly significant
(
P
<
0.01). The muscle content of crosses with the
PI, LI and BB breeds based on the SEUROP
stand-ard was slightly below the average of the whole set
of slaughter bulls, while the classification of the fat
content was rated as the highest in the progeny of PI
and LI fathers. Continuous evaluations of the quality
and results of dissection of the carcasses of fa�ened
commercial ca�le types are very important when
observing the requirements for the improvement of
the quality of jointed meat and meat products.
REFERENCES
Bartoň L., Teslík V., Herrmann H., Zahrádková R. (1998): Comparison of meat performance in crossbreds a�er sires of Charolais and Belgian Blue-white breeds and in bulls of Czech Pied Ca�le (in Czech). Czech J. Anim. Sci., 43, 237–243.
Frelich J., Voříšková J. (1997): Fa�ening performance in bulls-crossbreds of Czech pied and Black pied ca�le with beef ca�le breeds. Živoč. Výr., 42, 49–58. Gregory K.E., Cundiff L.V., Koch R.M., Dikeman M.E.,
Koohmaraie M. (1994): Breed effects, retained heterosis, and estimates of genetic and phenotypic parameters for carcass and meat traits of beef ca�le. J. Anim. Sci., 72, 1174–1183.
Keane M.G. (1994): Productivity and carcass composition of Friesian, Meuse-Rhine-Issel (MRI) × Friesian and Bel-gian Blue × Friesian steers. Anim. Prod., 59, 197–208. Keane M.G., More O’Ferral G.J., Connolly J., Allen P.
ABSTRAKT
Jatečná hodnota potomstva testovaných býků masných plemen
Tato studie je zaměřena na posouzení jatečné hodnoty masných užitkových typů skotu v podmínkách České repub-liky. V této práci bylo rozbouráno 361 jatečných polovin býků, kříženců s masnými plemeny. V otcovské pozici křížení byli použiti testovaní mladí býci těchto plemen: aberdeen angus (AA), blonde d’aquitaine (BA), belgické modré (BB), charolais (CH), hereford (HE), limousine (LI) a piemontese (PI). Kontrolní skupiny byly tvořeny býky po otcích plemen české strakaté (C) a holštýnské (H). Býci byli společně vykrmováni a poráženi v jednotném věku 500 ± 30 dnů. Porážky byly provedeny v podniku ZŘUD-Masokombinát Polička, a.s. Při porážce byla zjišťována hmotnost teplého jatečně upraveného těla a jeho klasifikace za zmasilost a protučnění dle systému SEUROP. Nejlepší zatřídění za zmasilost dosáhli potomci po otcích plemene charolais (3,17). Nejvyšší stupeň protučnění vykazovala skupina BB (2,45) a nejnižší (P < 0,01) skupina PI (1,50). Průměrná hmotnost teplého jatečně upraveného těla byla 332,54 kg a průkazně (P < 0,05) nejnižší hodnotu jsme stanovili u býků HE (290,50 kg). Jatečná těla byla po 24hodino-vém vychlazení rozdělena mezi osmým a devátým žebrem do čtvrtí. Po rozbourání pravých jatečných polovin byly vypočteny hodnoty výtěžnosti masa, kostí a oddělitelného loje a poměr maso/kosti. Nejvyšší intenzita růstu vyjádřená ne�o přírůstkem byla stanovena u potomků po plemenících CH (689,22 g/den); tato hodnota se vysoce průkazně (P < 0,01) lišila od nejnižší dosažené úrovně 579,56 g/den (HE). Rozdíl mezi maximální (41,46 %; PI) a minimální (36,34 %; HE) hodnotou podílu masa I. jakosti činil 5,12 % (P < 0,01). Nejnižší hodnotu zastoupení masa II. jakosti vykázala skupina H (36,14 %). Při posuzování podílů nejcennějších částí (plec, kýta, roštěnec a svíčková) byly mezi skupinami nalezeny statisticky vysoce významné rozdíly na hladinách P < 0,05 i P < 0,01. V průměru se podíl masa v jatečném těle pohyboval na úrovni 78,47 %. Statisticky vysoce signifikantně (P < 0,01) nejvyšší hodnotu podílu masa vykázala skupina PI (80,33 %). Nejvyšší procentické zastoupení kostí bylo stanoveno u kontrolní skupiny H (19,79 %), což bylo o 2 % více než u skupiny PI. Podíl oddělitelného tuku se pohyboval v rozmezí 1,29–3,68 %.
Klíčová slova: masný skot; býci; komerční typy; kvalita jatečného těla; SEUROP; skladba jatečného těla
Corresponding Author
Prof. Ing. Jan Šubrt, CSc., Mendelova zemědělská a lesnická univerzita v Brně, Ústav chovu hospodářských zvířat, Zemědělská 1, 613 00 Brno, Česká republika
Tel. +420 545 133 242, e-mail: [email protected] steers finished on two dietary energy levels. Anim. Prod., 50, 231–243.
Nová V., Louda F. (2000): Quantitative traits of carcass value in bulls of some ca�le breeds (in Czech). Czech J. Anim. Sci., 45, 437–442.
Parkkonen P., Liinamo A-E., Ojala M. (2000): Estimates of genetic parameters for carcass traits in Finnish Ayrshire and Holstein-Friesian. Livest. Prod. Sci., 64, 203–213. Polách P. (1998): Stanovení produkčních schopností
nejvýznamnějších masných užitkových typů skotu v ČR. [Doktorská disertační práce.] Brno, 152. Polách P., Šubrt J., Zajíc Z. (2000): Technologická kvalita
jatečného těla býků v závislosti na užitkovém typu. Czech J. Anim. Sci., 45, 81–89.
Suchánek B., Vrchlabský J., Štefunka F. (1990): Jatečná hodnota býků českého strakatého skotu. Živoč. Výr., 35, 595–602.
Šubrt J. (1994): Vliv užitkového křížení s masnými ple-meny na skladbu jatečného těla býků a jalovic. Živoč. Výr., 39, 321–330.
Šubrt J., Polách P., Frelich J., Voříšková J. (2000): Morpho-metric analysis of dressed carcasses of bulls of com-mercial meat types (in Czech). Czech J. Anim. Sci., 45, 37–43.
Teslík V., Burda J., Urban F., Bartoň L., Řehák D. (1995): Masná užitkovost býků českého strakatého a černo-strakatého skotu při intenzivním výkrmu do hmotnosti 530 kg. Živoč. Výr., 40, 227–232.
Voříšková J., Frelich J., Přibyl J. (1998): Carcass value of bulls-crosses of Czech Pied and Black Pied Ca�le with beef bovine breeds. Czech J. Anim. Sci., 45, 77–87. Wegner J., Albrecht E., Fiedler I., Teuscher F., Papstein
H.J., Ender K. (2000): Growth- and breed-related changes of muscle fiber characteristics in ca�le. J. Anim. Sci., 78, 1485–1496.
Wheeler T.L., Cundiff L.V., Koch R.M., Crouse J.D. (1996): Characterization of biological types of ca�le (Cycle IV): Carcass traits and longissimus palatability. J. Anim. Sci., 74, 1023–1035.