Study on some engineering attributes of pine nut
(
Pinus pinea
) to the design of processing equipment
S.M.T. Gharibzahedi
1, V. Etemad
2, J. Mirarab-Razi
2, M. Fos’hat
31
Department of Food Science and Engineering, Faculty of Agricultural Technology
and Engineering, University of Tehran, Tehran, Iran
2
Department of Forest Engineering, Faculty of Natural Resource, University of Tehran,
Karaj, Iran
3
Department of Forest Engineering, Faculty of Natural Resource,
Tarbiat Modares University, Nour, Iran
Abstract
Gharibzahedi S.M.T., Etemad V., Mirarab-Razi J., Fos’hat M., 2010. Study on some engineering attributes of
pine nut (Pinus pinea) to the design of processing equipment. Res. Agr. Eng., 56: 99–106.
Moisture-dependent engineering properties of pine nut were studied at 6.3, 8.2, 10.8, 14.5, 18.9, and 20.1% moisture
content (dry basis). The length, width, thickness, and geometric mean diameter increased significantly (P < 0.05)
from 21.75 to 21.85 mm, 7.39 to 7.47 mm, 6.07 to 6.14 mm, and 9.89 to 9.98 mm, respectively, with an increase in moisture content from 6.3% to 20.1%, whereas the increase in sphericity from 45.49% to 45.69% was not significant.
Similarly, thousand seed mass, true density, porosity, terminal velocity, and angle of repose increased (P < 0.05) from
0.85 to 0.93 kg, 1043.3 to 1071 kg/m3, 41.31% to 44.57%, 8.67 to 8.83 m/s, and 35.4° to 39°, respectively, with an increase
in moisture content under the experimental condition. Moreover, the bulk density decreased significantly (P < 0.05)
from 612.3 to 593.6 kg/m3. Coefficient of static friction increased (P < 0.05) from 0.251 to 0.292, 0.241 to 0.271, 0.227 to
0.262, and 0.218 to 0.247 on plywood, galvanized iron sheet, stainless steel, and glass surfaces, respectively, with an increase in moisture content from 6.3% to 20.1%.
Keyword:pine nut (Pinus pinea); physical properties; mechanical properties; moisture content
Pine nut (Pinus pinea family Pinaceae) has been widely planted throughout the Mediter-ranean regions, mainly in Spain, Portugal, Italy, Greece, Albania, and Turkey. Pine nuts are eaten raw or roasted; they are included as ingredients in a variety of traditional dishes, such as breads, candies, sauces and cakes, as well as vegeta-ble, and meat dishes (Fallour et al. 1997). Pine nuts are a good source of nutrients. It is reported that the seeds of Pinus pinea show a composi-tion of 5.6% moisture, 31.1% protein, 47.4% fat, 10.7% carbohydrate, and 4.3% ash. They contain
vitamins, particularly B1 and B2 and also minerals, especially potassium and phosphorus. Apart from nutritional value, consumption of nuts aids health. Regular consumption of nuts is associated with a re-duced risk of both coronary heart disease and non- -fatal myocardial infarction. This effect is ascribed to fatty acid composition because of high amounts of linoleic acid (Savage 2001).
equipment related to aeration, drying, storage, and transport. Bulk density determines the capacity of storage and transport systems, while true density is useful for separation equipment; porosity of the mass of seeds determines the resistance to air flow during aeration and drying of seeds. Flow ability of agricultural grains is usually measured using the angle of repose. This is a measure of the internal friction between grains and can be useful in hop-per design, since the hophop-per wall’s inclination angle should be greater than the angle of repose to en-sure the continuous flow of the materials by grav-ity. Moreover, the coefficient of external friction are recognized by engineers as important properties concerned with rational design of seed bins and other storage structures including the compress-ibility and flow behavior of materials. Aerodynamic properties such as terminal velocity are useful for air conveying or pneumatic separation of materials in such a way that when the air velocity is greater than the terminal velocity, it lifts the particles. The air velocity at which the seed remains in suspen-sion is considered as terminal velocity (Mohsenin 1986).
Ozgüven and Vursavus (2005) studied some physical, mechanical and aerodynamic properties of pine nuts at constant moisture content of 5.48% dry basis (d.b.). However, to our knowledge, detailed measurements of the principal dimensions and the variation of the engineering properties of pine nut at various levels of moisture content have not been reported. Hence, the objective of this study was to determine some engineering properties of pine nut, as a function of moisture content in the range of 6.3% to 20.1% (d.b.) which can help out to design the post harvest equipments of the product.
MATERIAL AND METHODS
Pine nuts (Pinus pinea) were used for all the ex-periments in this study. The seeds were obtained from the local market during October 2010 in a city located in the west of capital Tehran and kept in cooled bags during transportation to the laborato-ry. The seeds were cleaned in an air screen cleaner to remove all foreign materials such as dust, dirt and chaff as well as immature and damaged seeds. The initial moisture content of the seeds, as brought from the market, was determined by drying sam-ples in a hot air oven set at 105 ± 1°C for 6 h and was found to be 6.3% (d.b.) (Ozgüven, Vursavus
2005). Samples were moistened with a calculated quantity of water by using the following Eq. 1 and conditioned to increase their moisture content to the desired six different levels (Dursun, Dursun 2005):
f i f i
M M M W
Q 100( ) (1)
where:
Q – mass of water to be added (kg)
Wi – initial mass of the sample (kg)
Mi – initial moisture content of the sample (%, d.b.)
Mf – final moisture content of the sample (%, d.b.)
The samples were kept in a refrigerator at 5 ± 1°C for 7 days for the moisture to distribute uniformly throughout the seed (Carman 1996; Aydin 2002; Aydin et al. 2002). The moisture content of sam-ples after equilibration was determined before each test was conducted. Accordingly, moisture levels of 6.3, 8.2, 10.8, 14.5, 18.9, and 20.1% (d.b.) were ob-tained. The required amount of sample was with-drawn from the refrigerator and reconditioned at room temperature (≈ 25°C) before conducting each test. Every test was repeated five times to deter-mine mean values.
In order to determine the one thousand seeds mass (m1,000), one hundred seeds of pine nuts were counted by an electronic counter machine and then these seeds were weighed by means of an electronic scale with 0.01 g accuracy and finally extrapolat-ing this mass to 1,000 seeds. The average size of the seeds was determined by measuring three lin-ear dimensions (namely, length L, width W, and thickness T ) of 100 seeds which were randomly picked. A digital vernier caliper with an accuracy of 0.01 mm was employed.
The average diameter of the seeds was presented as the arithmetic mean and geometric mean of the three axial dimensions. The geometric mean diam-eter (Dg) and the arithmetic mean diameter (Da)
were calculated for the three principal dimensions as follows (Mohsenin 1986):
3 / 1
)
(LWT
Dg (2)
3 )
(L W T
Da
(3)
1/3
(
LWT
)
L
I
(4)where:
φ
– sphericityL – length (mm)
W – width (mm)
T – thickness (mm)
Seed surface area (S) and volume (V ) were es-timated using the following equations (Jain, Bal 1997):
2
g
S
S
D
(5)2 2
6 2
B L V
L B S
(6)
where: WT
B (7)
The bulk density (ρb) of pine nuts was measured by filling an empty glass container of predeter-mined volume and net weight with the seeds by pouring from a constant height, striking off the top level and weighing. The ratio of the mass and vol-ume was expressed as bulk density (Varnamkha-sti et al. 2008). During the experiment, care was taken to avoid any compaction of the material in the container.
The true density (ρt) was determined using ene displacement method (Mohsenin 1986). Tolu-ene (C7H8) was used in place of water because it is absorbed by seeds to lesser extent. In addition, its surface tension is low, so that it fills even shal-low dips in a seed and its dissolution power is shal-low (Demir et al. 2002 ; Kabas et al. 2007).
The porosity (ε) of pine nuts were determined by the following equation (Mohsenin 1986):
t b 100 tU U H u
U (8)
where:
ε – porosity (%)
ρb – bulk density (kg/m3)
ρt – true density (kg/m3)
The angle of repose is the angle with respect to the horizontal at which the material will stand when piled. This was determined by using an apparatus consisting of a plywood box of 140 × 160 × 35 mm and two plates: fixed and adjustable. The box was
filled with the sample, and then the adjustable plate was inclined gradually allowing the seeds to flow and assume a natural slope, this was measured as empty-ing angle of repose (Varnamkhasti et al. 2008).
The friction static coefficients against different sur-faces, plywood, mild steel, aluminum, and galvanized iron sheet were determined using a cylinder of di-ameter 75 mm and depth of 50 mm filled with seeds. With the cylinder resting on the surface, the surface was raised gradually until the filled cylinder just start-ed to slide down (Varnamkhasti et al. 2008).
Terminal velocity (Vt) was measured by using an air column system. For each experiment, a sample was dropped into the air stream from the top of the air column, up to which air was blown to suspend the material in the air stream. The air velocity near the location of the seed suspension was measured by a hot wire anemometer having a least count of 0.01 m/s (Akinci et al. 2004).
The results obtained were subjected to analy-sis of variance (ANOVA) and Duncan’s test using SPSS 15 (SPSS Inc., USA) software and analysis of regression using Microsoft Excel 2007 (Microsoft Corp., USA).
RESULTS AND DISCUSSION
Seed dimension
The three axial dimensions increased with moisture content. The length, width, and thickness axis of nuts ranged from 21.75 to 21.85 mm, 7.39 to 7.47 mm, and 6.07 to 6.14 mm, respectively, as the moisture content increased from 6.3% to 20.1% (d.b.) (Table 1). The in-crease in the dimensions is attributed to expansion or swelling as the result of moisture uptake in the intra-cellular spaces within the nuts. The average diameters increased with moisture content. The arithmetic and geometric mean diameters increased from 11.73 to 11.82 mm and 9.89 to 9.98 mm as the moisture con-tent increased from 6.3% to 20.1% (d.b.), respectively (Table 1). Differences between values are statistically important at 5% probability level.
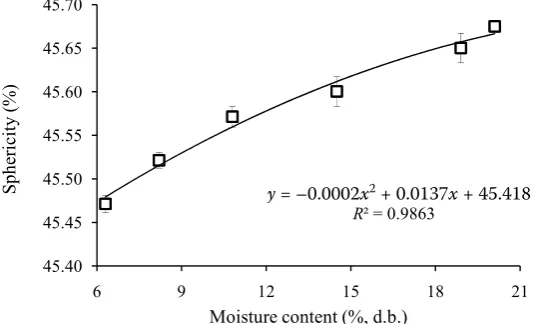
Sphericity
Srivas-tava (2002) for okra seed, Sacilik et al. (2003) for hemp seed, Coskuner and Karababa (2007) for flaxseed and Altuntas et al. (2005) for fenugreek seed. The relationship between projected area and moisture content was not found to be significant.
Surface area
The surface area of pine nut increased from 307.46 to 313.07 mm2 when the moisture content increased
from 6.3% to 20.1% (d.b.) (P < 0.05). Similar trends were reported by Sacilik et al. (2003) and Baryeh (2002) for hemp seed and millet, respectively.
Volume
The volume increased with moisture content from 301.75 mm3 at 6.3% moisture content to
310.43 mm3 at 20.1% (d.b.) (P < 0.05). Ogut (1998)
and Baryeh (2002) reported a linear increase in
seed volume with increasing moisture content for white lupin and millet, respectively.
One thousand seed mass
The one thousand pine nut mass increased from 0.85 to 0.93 kg as the moisture content increased from 6.3% to 20.1% (d.b.) (Fig. 2). Accordingly, an increase of 9.41% in the one thousand seed mass was recorded within the above moisture range. This parameter is useful in determining the equivalent diameter which can be used in the theoretical estimation of seed vol-ume and in cleaning using aerodynamic forces.
[image:4.595.66.533.100.240.2]Similar to the present observations, a linear increase in the thousand seed mass as the seed moisture content increases was noted by Ozars-lan (2002) for cotton seed, Sacilik et al. (2003) for hemp seed, Yalcin and Ozarslan (2004) for vetch, Cagatay Selvi et al. (2006) for linseed, Coskuner and Karababa (2007) for flaxseed, and Cahsir et al. (2005) for rapeseed.
Table 1. Means and standard errors of the dimensions and diameters of pine nuts at different moisture contents
Moisture (%, d.b.)
Dimension (mm) Diameter (mm)
length (L) width (W ) thickness (T ) arithmetic mean (Da) geometric mean (Dg ) 6.3 21.75 ± 0.043a 7.39 ± 0.023a 6.07 ± 0.019a 11.73a 9.89a 8.2 21.77 ± 0.053b 7.40 ± 0.055a 6.09 ± 0.041b 11.75b 9.91b 10.8 21.79 ± 0.069b 7.42 ± 0.032b 6.1 ± 0.032b 11.77b 9.93c 14.5 21.82 ± 0.047c 7.43 ± 0.041b 6.12 ± 0.022c 11.79c 9.95d 18.9 21.84 ± 0.048d 7.46 ± 0.065c 6.135 ± 0.017c 11.81d 9.97e 20.1 21.85 ± 0.044d 7.47 ± 0.048c 6.142 ± 0.013d 11.82d 9.98e
Values in the same columns followed by different letters (a–e) are significant (P < 0.05)
45 50 45.55 45.60 45.65 45.70
ph
er
ici
ty
(%
)
y = –0.0002x2+ 0.0137x + 45.418
R² = 0.9863
45.40 45.45 45.50 45.55 45.60 45.65 45.70
6 9 12 15 18 21
Sp
her
ici
ty
(%
)
Moisture content (%, d.b.)
Fig. 1. Effect of moisture content on the sphericity of pine nut
[image:4.595.65.332.594.756.2]Density
The bulk density decreased from 612.3 to 593.6 kg/m3
as the moisture content increased from 6.3% to 20.1% (d.b.) (P < 0.05). The decrease in bulk density with in-crease in moisture content shows that the inin-crease in mass resulting from the moisture gain of the sample is lower than the accompanying volumetric expan-sion of the bulk. The negative linear relationship of bulk density with moisture content was also observed by various research workers (Shepherd, Bhardwaj 1986; Dutta et al. 1988; Deshpande et al. 1993; Gupta, Das 1997; Bart-Plange, Baryeh 2003). In contrast, the increase in the bulk density was noted by Joshi et al. (1993) for the pumpkin seeds and kernels, from 404 to 472 kg/m3 and from 481 to 554 kg/m3, in
the moisture range of 5.8–40.7% and 4.2–38% (d.b.), respectively. These discrepancies could be due to the cell structure and the volume and mass increase char-acteristics of the grains, seeds and nuts and their ker-nels as moisture content increased.
The true density of the nut increased from 1043.3 to 1071 kg/m3 as the moisture content
in-creased from 6.3% to 20.1% (d.b.) (P < 0.05). A simi-lar increasing trend in true density was observed with increase in moisture content by Singh and Goswami (1996) for cumin seed, Gupta and Das (1997) for sunflower seeds and kernel, Ogut (1998) for white lupin and Aviara et al. (1999) for guna seeds. This increase indicates that there is a higher grain mass increase in comparison to its volume in-crease as its moisture content inin-creases.
Porosity
[image:5.595.66.326.82.253.2]The porosity of pine nut increased from 41.31% to 44.57% with the increase in moisture content from 6.3% to 20.1 % (d.b.). The relationship between po-rosity and moisture content was found to be sig-nificant (P < 0.05). This could be attributed to the expansion and swelling of nuts that might have re-sulted in more voids space between the nuts and in-creased the bulk volume. This is also exhibited in the reduction of bulk density with an increase in mois-ture content. Gupta and Das (1997) for sunflower,
Fig. 2. Effect of moisture content on the one thousand seed mass of pine nut
0.95 g) 0.92 0.95 ss (k g) 0.89 0.92 0.95 ee d m as s ( kg )
0 001 2+ 0 0078 + 0 8035
0.86 0.89 0.92 0.95 us an d se ed m as s ( kg )
y = –0.001x2+ 0.0078x + 0.8035
R² = 0.9968
0.83 0.86 0.89 0.92 0.95 O ne th ou sa nd se ed m as s ( kg )
y = –0.001x2+ 0.0078x + 0.8035
R² = 0.9968
0.80 0.83 0.86 0.89 0.92 0.95 O ne th ou sa nd se ed m as s ( kg )
y = –0.001x2+ 0.0078x + 0.8035
R² = 0.9968
0.80 0.83 0.86 0.89 0.92 0.95
6 9 12 15 18 21
O ne th ou sa nd se ed m as s ( kg )
Moisture content (%, d.b.)
y = –0.001x2+ 0.0078x + 0.8035
R² = 0.9968
0.80 0.83 0.86 0.89 0.92 0.95
6 9 12 15 18 21
O ne th ou sa nd se ed m as s ( kg )
Moisture content (%, d.b.)
8.85 8.81 8.85 (m /s ) 8.77 8.81 8.85 oc ity (m /s ) 8.73 8.77 8.81 8.85 na l v el oc ity (m /s )
y = –0.0007x2+ 0.0294x + 8.5192 R² = 0.9891
8.69 8.73 8.77 8.81 8.85 Te rm in al v el oc ity (m /s )
y = –0.0007x2+ 0.0294x + 8.5192 R² = 0.9891
8.65 8.69 8.73 8.77 8.81 8.85
6 9 12 15 18 21
Te rm in al v el oc ity (m /s )
y = –0.0007x2+ 0.0294x + 8.5192 R² = 0.9891
8.65 8.69 8.73 8.77 8.81 8.85
6 9 12 15 18 21
Te rm in al v el oc ity (m /s )
Moisture content (%, d.b.)
y = –0.0007x2+ 0.0294x + 8.5192 R² = 0.9891
8.65 8.69 8.73 8.77 8.81 8.85
6 9 12 15 18 21
Te rm in al v el oc ity (m /s )
Moisture content (%, d.b.)
Fig. 3. Effect of moisture content on terminal velocity of pine nut
y = –0.001x2 + 0.0078x + 0.8035
[image:5.595.66.317.601.755.2]Carman (1996) for lentil and Singh and Goswami (1996) for cumin seeds stated that as the moisture content increased so the porosity value increased.
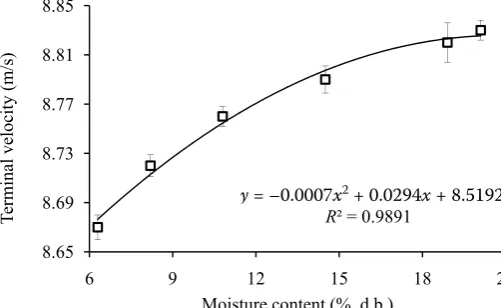
Terminal velocity
The experimental results for the terminal velocity of pine nut at various moisture contents are plotted in Fig. 3. The terminal velocity increased linearly from 8.67 to 8.83 m/s as the moisture content in-creased from 6.3% to 20.1% (d.b.) (P < 0.05). The in-crease in terminal velocity with inin-crease in moisture content within the range studied can be attributed to the increase in mass of an individual seed per unit frontal area presented to the air stream. Singh and Goswami (1996), Suthar and Das (1996), Nimkar and Chattopadhyay (2001), Gezer et al. (2002), Konak et al. (2002), and Sacilik et al. (2003) reported an increase in terminal velocity with increase in the moisture content for cumin seed, karingda seed, green gram, apricot kernel, chick pea seed, and hemp seed, respectively.
Angle of repose
The experimental results for the angle of repose for pine nut at various moisture levels are shown in Fig. 4. It is observed that the angle of repose increased with an increase in moisture content. It increased from 35.4° to 39° in the moisture range from 6.3% to 20.1% (d.b.) (P < 0.05). At higher moisture content nuts might tend to stick together due to the plasticity effect (stickiness) over the surface of the nuts resulting in better stability and lower flowability thereby increas-ing the angle of repose (Irtwange, Igbeka 2002). The results were similar to those reported by Singh and Goswami (1996), Nimkar and Chattopad-hyay (2001), Baryeh (2002), Amin et al. (2004), and Altuntas et al. (2005) for cumin seed, green gram, millet, lentil, and fenugreek, respectively.
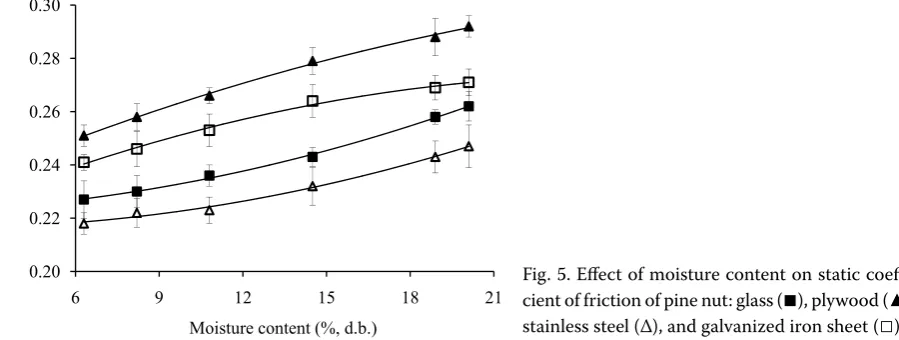
Static coefficient of friction
[image:6.595.64.314.80.251.2]The static coefficient of friction increased with an increase in moisture content on all surfaces (Fig. 5).
Fig. 5. Effect of moisture content on static
coeffi-cient of friction of pine nut: glass (■), plywood (▲),
stainless steel (∆), and galvanized iron sheet (□)
0.30 0.28 0.30 fr ic tio n 0.26 0.28 0.30 en t o f f ric tio n 0.24 0.26 0.28 0.30 co ef fic ie nt o f f ric tio n 0.22 0.24 0.26 0.28 0.30 St at ic c oe ffi ci en t o f f ric tio n 0.20 0.22 0.24 0.26 0.28 0.30 St at ic c oe ffi ci en t o f f ric tio n 0.20 0.22 0.24 0.26 0.28 0.30
6 9 12 15 18 21
St at ic c oe ffi ci en t o f f ric tio n
Moisture content (%, d.b.) 0.20 0.22 0.24 0.26 0.28 0.30
6 9 12 15 18 21
St at ic c oe ffi ci en t o f f ric tio n
Moisture content (%, d.b.)
39 38 39 g) 38 39 se (deg) 37 38 39 of repose (deg)
y = 3.0107ln(x) + 29.904
R² = 0.9983
36 37 38 39 A ng le o f r ep os e (d eg )
y = 3.0107ln(x) + 29.904
R² = 0.9983
35 36 37 38 39 A ng le o f r ep os e (d eg )
y = 3.0107ln(x) + 29.904
R² = 0.9983
35 36 37 38 39
6 9 12 15 18 21
A ng le o f r ep os e (d eg )
Moisture content (%, d.b.)
y = 3.0107ln(x) + 29.904
R² = 0.9983
35 36 37 38 39
6 9 12 15 18 21
A ng le o f r ep os e (d eg )
[image:6.595.73.523.589.759.2]Moisture content (%, d.b.)
Fig. 4. Effect of moisture content on angle of repose of pine nut
(
°
)
This is due to the increased adhesion between the seed and the surface at higher moisture values. Tsang-Mui-Chung et al. (1984), Dutta et al. (1988), Joshi et al. (1993), Carman (1996), Peker (1996), Ogut (1998), and Aydin (2002) reported that as the moisture content increased so the coef-ficient of static friction increased.
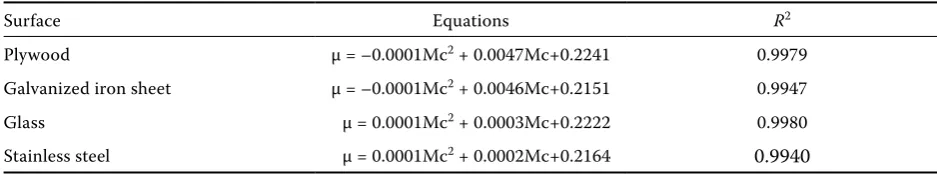
At all moisture contents, the static coefficient of friction was greatest against plywood (0.251–0.292), followed by galvanized iron sheet (0.241–0.271), glass (0.227–0.262), and least for stainless steel (0.218–0.247). This trend is due to the roughness of the surfaces, as exemplified by the case of the stain-less steel which, with its smooth surface, revealed the minimum friction value. The relationship be-tween moisture content and static coefficients of friction for four surfaces is presented in Table 2.
CONCLUSION
The following conclusions can be drawn from this work: the average length, width, thickness, geometric mean diameter, thousand seed mass, an-gle of repose, terminal velocity, and surface area of pine nuts ranged from 21.75 to 21.85 mm, 7.39 to 7.47 mm, 6.07 to 6.14 mm, 9.89 to 9.98 mm, 0.85 to 0.93 kg, 35.4° to 39°, 8.67 to 8.83 m/s, and 307.46 to 313.07 mm2, respectively, with moisture content
in-creasing from 6.3% to 20.1% (d.b.). As the moisture content increased from 6.92% to 21.19% (d.b.), the true density and porosity increased from1043.3 to 1071 kg/m3 and 41.31% to 44.57%, respectively,
while the bulk density was found to decrease from 612.3 to 593.6 kg/m3 in the above moisture range.
The static coefficient of friction increased for all four surfaces, namely plywood (0.251–0.292, 16.33%), galvanized iron sheet (0.241–0.271, 12.44%), glass (0.227–0.262, 15.41%), and (0.218–0.247, 13.30 %) as the moisture content increased from 6.3% to 20.1% (d.b.).
List of selected symbols:
L – length (mm) W – width (mm) T – thickness (mm)
Da – arithmetic mean diameter (mm) Dg – geometric mean diameter (mm) S – surface area of seed (mm2) V – volume (mm3)
φ
– sphericity (%)m1,000 – thousand seed mass (kg) ρb – bulk density (kg/m3) ρt – true density (kg/m3) ε – porosity (%)
Q – the mass of water to be added (kg) Wi – initial mass of the sample (kg) Mf – the final moisture content (%, d.b.)
Mi – initial moisture content of the sample (%, d.b.) Vt – terminal velocity (m/s)
α – angle of repose (°)
μ – static coefficient of friction R2 – coefficient of determination
References
Akinci I., Ozdemir F., Topuz A., Kabas O., Canakci M., 2004. Some physical and nutritional properties of Juniperus drupacea fruits. Journal of Food Engineering, 65: 325–331. Altuntas E., Ozgoz E., Taser O.F., 2005. Some physical
properties of fenugreek (Trigonella foenum-graceum L.) seeds. Journal of Food Engineering, 71: 37–43.
Amin M.N., Hossain M.A., Roy K.C., 2004. Effect of mois-ture content on some physical properties of lentil seeds. Journal of Food Engineering, 65: 83–87.
Aviara N.A., Gwandzang M.I., Haque M.A., 1999. Physical properties of guna seeds. Journal of Agricultural Engineering Research, 73: 105–111.
Aydin C., 2002. Physical properties of hazelnuts. Biosystems Engineering, 65: 297–303.
[image:7.595.62.531.101.188.2]Aydin C., Ogut H., Konak M., 2002. Some physical properties of Turkish Mahaleb. Biosystems Engineering, 82: 231–234.
Table 2. The relationship between moisture content and static coefficients of friction for various surfaces
Surface Equations R2
Bart-Plange A., Baryeh E.A., 2003. The physical properties of category B cocoa beans. Journal of Food Engineering, 60: 219–227.
Baryeh E.A., 2002. Physical properties of millet. Journal of Food Engineering, 51: 39–46.
Cagatay Selvi K., Pinar Y., Yesiloglu E., 2006. Some physical properties of linseed. Biosystems Engineering, 95: 607–612.
Cahsir S., Marakoglu T., Ogut H., Ozturk O., 2005. Physical properties of rapeseed (Brassica napus oleifera L.). Journal of Food Engineering, 69: 61–66.
Carman K., 1996. Some physical properties of lentil seeds. Journal of Agricultural Engineering Research, 63: 87–92. Coskuner Y., Karababa E., 2007. Some physical proper-ties of flaxseed (Linum usitatissimum L.). Journal of Food Engineering, 78: 1067–1073.
Demir F., Dogan H., Ozcan H., Haciseferogullari H., 2002. Nutritional and physical properties of hackberry ( Cel-tis australis L.). Journal of Food Engineering, 54: 241–247. Deshpande S.D., Bal S., Ojha T.P., 1993. Physical properties
of soybean. Journal of Agricultural Engineering Research, 56: 89–98.
Dursun E., Dursun I., 2005. Some physical properties of caper seed. Biosystems Engineering, 92: 237–245. Dutta S.K., Nema V.K., Bhardwaj R.K., 1988. Physical
properties of gram. Journal of Agricultural Engineering Research, 39: 259–268.
Fallour D., Fady B., Lefevre F., 1997. Study on isozyme variation in Pinus pinea L.: Evidence for a low polymor-phism. Silvae Genetica, 46: 201–206.
Gezer I., Haciseferogullari H., Demir F., 2002. Some physical properties of Hacihaliloglu apricot pit and its kernel. Journal of Food Engineering, 56: 49–57.
Gupta R.K., Das S.K., 1997. Physical properties of sunflower seeds. Journal of Agricultural Engineering Research, 66: 1–8. Irtwange S.V., Igbeka J.C., 2002. Flow properties of African
yam bean(Sphenostylis stenocarpa) as affected by accession and moisture content. Transaction of the ASAE, 45: 1063–1070. Jain R.K., Bal S., 1997. Properties of pearl millet. Journal of
Agricultural Engineering Research, 66: 85–91.
Joshi D.C., Das S.K., Mukherjee R.K., 1993. Physical prop-erties of pumpkin seeds. Journal of Agricultural Engineer-ing Research, 54: 219–229.
Kabas O., Yilmaz E., Ozmerzi A., Akinci I., 2007. Some physical and nutritional properties of cowpea seed (Vigna sinensis L.). Journal of Food Engineering, 79: 1405–1409.
Konak M., Carman K., Aydin C., 2002. Physical properties of chick pea seeds. Biosystems Engineering, 82: 73–78. Mohsenin N.N., 1986. Physical Properties of Plant and
Animal Materials. New York, Gordon and Breach Science Publications.
Nimkar P.M., Chattopadhyay P.K., 2001. Some physical properties of green gram. Journal of Agricultural Engineer-ing Research, 80: 183–189.
Ogut H., 1998. Some physical properties of white lupin. Jour-nal of Agricultural Engineering Research, 69: 273–277. Ozarslan C., 2002. PH – postharvest technology: physical
prop-erties of cotton seed. Biosystems Engineering, 83: 169–174. Ozgüven F., Vursavus K., 2005. Some physical, mechanical
and aerodynamic properties of pine (Pinus pinea) nuts. Journal of Food Engineering, 68: 191–196.
Peker A., 1996. The determination of some physical prop-erties of corn kernel. Selcuk University. The Journal of Agricultural Faculty, 10: 22–65.
Sacilik K., Ozturk R., Keskin R., 2003. Some physical proper-ties of hemp seed. Biosystems Engineering, 86: 191–198. Sahoo P.K., Srivastava A.P., 2002. Physical properties of
okra seed. Biosystems Engineering, 83: 441–448.
Savage G.P., 2001. Chemical composition of walnuts (Juglans regia L.) grown in New Zealand. Plants Foods for Human Nutrition, 56: 75–82.
Shepherd H., Bhardwaj R.K., 1986. Moisture-dependent physical properties of pigeon pea. Journal of Agricultural Engineering Research, 35: 227–234.
Singh K.K., Goswami T.K., 1996. Physical properties of Cumin seed. Journal of Agricultural Engineering Research, 64: 93–98.
Suthar S.H., Das S.K., 1996. Some physical properties of karingda [Citrullus lanatus (Thumb) Mansf] seeds. Journal of Agricultural Engineering Research, 65: 15–22.
Tsang-Mui-Chung M., Verma L.R., Wright M.E., 1984. A device for friction measurement of grains. Transaction of the ASAE, 27: 1938–1941.
Varnamkhasti M.G., Mobli H., Jafari A., Keyhani A.R., Soltanabadi M.H., Rafiee S., Kheiralipour K., 2008. Some physical properties of rough rice (Oryza sativa L.) grain.Journal of Cereal Science, 47: 496–501.
Yalcin I., Ozarslan C., 2004. Physical properties of vetch seed. Biosystems Engineering, 88: 507–512.
Received for publication December 12, 2009 Accepted after corrections April 20, 2010
Corresponding author: