Fruits grown for consumption should be crisp, have a lot of juice, good taste, and should have nice smell and an appealing colour (Kader 1999). After harvest, the cosmetic appearance seems to be a valuable quality factor. The colour and size of an apple, e.g., are most important criteria among other quality parameters estimated by consumers (Chen et al. 1986; Francis 1995; Kappel et al. 1995; Chen 1996; Paulus & Schrevens 1997; Kader 1999). One of the basic conditions for the improvement of quality is a proper sorting and handling of the fruits for market (Harrell & Levi 1988; Miller & Delwiche 1988; Bellon et al. 1992; Studman 1998). Thus, the recognition of bruising (Garcia Fernandez et al. 1994; Ayuso et al. 1996) and separating the afflicted fruits from those with the same level of high colour of blush or having the same base colour, should be most profitable manner for quality improving.
With the increasing diversity of the fruits culti-vars, fruit quality recognition is becoming more and more important. Along with the quality estimation, colour acts as the major factor in creating the fruit image (Lancaster 1992; Kameoka et al. 1994; Felfoldi et al. 1996; Molto et al. 1996; Nielsen & Paul 1996; Motonaga et al. 1997; Kader 1999;
Good 2002), having a great effect on sales, however, in many causes is it performed by visual evaluation, relying on the accuracy of an individual’s eyes in determining the colour. Unfortunately, individual colour perceptions are slightly different. Also, it is extremely difficult to describe the colour in words accurately, since each person will interpret the de-scribed colour a little differently.
At the present time and in the last decade, in most developing countries, including the East-European countries, the market has changed (Dobrzański et al. 2001). Therefore, the appearance of fruits and veg-etables has a major influence on the perceived quality in the new member states of EC. However, the colour as one of the most important quality parameters is influenced by cultural and consumers’ preferences. The preferences of colour depend on the:
– uniformity of the external colour, repeatability of the fruit colour in crops,
– differences between the high and background co-lours,
– intensity of the high colour (saturation of blush), – intensity of the background colour,
– presence of the high colour and the extent of blush,
– lightness-darkness, whiteness,
Influence of packing method on colour perception
improving the appearance of fruits and vegetables
B. Dobrzański, Jr., R. Rybczyński
Polish Academy of Sciences, B. Dobrzański Institute of Agrophysics, Lublin, Poland
Abstract: The appearance of fruits and vegetables has a major influence on the perceived quality. Therefore, colour is one of the most important quality parameters in consumers’ preferences. Fruits differently exposed to the sun differ in colour, frequently looking unripe and reach full maturity just on handling or transport, some still green and appearing unripe. Oranges, carrot, red beet, and parsley were used for the study of the quality estimation. Different nets used for the packing of fruits were tested. The measurements of lightness and chromaticity parameters were performed accord-ing to L*a*b* system. The red net used for the packaccord-ing of oranges caused a decrease of the lightness parameter L* for all stages of fruits maturity. However, some unripe and bright oranges, through the use of a red net, looked more mature. The chromaticity parameter a* is the most influential factor affecting the human perception of the fruit colour. The red net improves this parameter significantly, thus unripe yellow oranges become more saturated, changing the perception of colour to the predicted range. The colour is insignificant for the net, however, it is important for the classification and quality assessment by humans.
– physical defects, dents, browning, bruising, – stage of maturity (ripeness).
Labelling, packing and preparing agricultural products for market are very important procedures in all handling operations. Fruits and vegetables are the crops frequently harvested at different times and maturity stages. Fruits differently exposed to the sun during the growth are differently coloured. Frequently, the fruit harvested as unripe, reaches full maturity just in handling or transporting. However, some fruits are still unripe having no uniform co-lour of the skin and appearing green. Others, well exposed to the sun during growing and over ripe, are too much saturated with red colour, indicating a dark skin in a short time. Over the years, the au-thors concentrating on the estimation of the fruit quality based on the maturity stage (Delwiche & Baumgartner 1983, 1985; Saks et al. 1999; Fornes et al. 1994) proved that the maturity stage is related to the fruit colour.
Because fruits of different maturity stages are characterised by a non-uniform colour, the sellers prepare special packing colour bags (plastic or vi-nyl) or semi transparent colour nets to improve the appearance. On the Polish market, the spectrum of lemon skin ranges from green to intensely saturated yellow. Oranges cover the colour range from slightly yellow to dark orange. To improve the customers’ satisfaction and to create a more uniform percep-tion of colour, lemons are packed into yellow nets and oranges into red ones. Red beets of high quality are packed in dark red bags, parsleys in white, and carrots in intensely orange net.
The objective of this research was the numerical way of accurate colour identification, without relying on individuals’ colour perception, and to apply, in consumers’ quality, the estimation of fruits and veg-etables (oranges, lemons, apples, carrots, red beats, onions, garlic etc.) packed for the Polish market.
MAteRIAl AnD MethoDs
The study was performed on the fruits and vegeta-bles frequently met on the stocks of large markets, which are prepared for sellers of horticultural prod-ucts on a small scale. The following fruits: orange, lemon, sweetie, as well as vegetables: carrot, red beet, and parsley, were used for the study of the consumer quality estimation of the products. To improve the estimation of the fruit colour, the nets of 13 different producers used for the packing of citrus fruits and 3 nets for vegetables were tested. The fruits were divided by a consumer group (10 per-sons of high experience in the quality estimation)
into 15 or 20 quality classes. A low number of the quality class indicated not mature and green fruit, while a high number indicated mature or overripe fruit, frequently with dark spots. For each class, the parameters of chromaticity and lightness were meas-ured and were compared to the results obtained with the tested nets. All producers of fruits and vegetables and the country of origin are known by the authors of the paper presented here.
The measurements of the colour parameters were performed with Braive Instruments 6016 supercol-our™ colorimeter. The measuring system employed by Braive colorimeter is designed to provide accurate readings and a uniform response. The light received by the meter is divided in three ways and passed through special filters whose light absorbing char-acteristics combine with the spectral response of the photo cells. Upon striking the silicon photocells, the light energy is converted into electrical signals and sent to the microprocessor, where it is adjusted for the illuminating condition desired and then converted into Yxy coordinates or in L*a*b* colour space. The readings are displayed in the LCD panel and can be transferred to a separate computer. This device allows selecting different illuminations, how-ever, D65 – daylight of 65 000 K colour temperature and CIE 2° Standard Observer were chosen for this experiment. The L*a*b* colour system is one of the uniform colour spaces recommended by CIE in 1976 as a way of a better representation of the perceived colour and colour difference and is frequently ap-plied in quality estimations of the fruit colour. In this system, L* is the lightness factor; a* and b* are the chromaticity coordinates (Good 2002).
L* (lightness) axis – 0 is black; 100 is white.
a* (red-green) axis – positive values are red; negative values are green; 0 is neutral.
b* (yellow-blue) axis – positive values are yellow; negative values are blue; 0 is neutral. Regression analysis and the analysis of vari-ance were used with all results obtained in this experimental study. According to the procedures of Statgraphics, the linear model of regression and parameters such as: intercept, slope, standard error, correlation coefficient were used to describe the relation between the quality estimation and colour parameters of fruits and vegetables.
Results AnD DIscussIon
ap-proximately 350 000 shades of colour, it is necessary to introduce such colour parameters which enable each shade to be described exactly in a numbered value of lightness. The orange skin reflects the light indicating the colour of the quality class whose pa-rameters of L*a*b* system are presented in Figures 1–3 by large dots and bold line. The lightness pa-rameter L* (Figure 1) ranges from 59.4 to 69.2, while the chromaticity parameters range from 21.2 to 38.4 and from 47.0 to 68.1 for a* and b*, respectively. However, some bright and unripe oranges, through using red net (No. 13) look more mature, as in this
case, the parameter L* reaching the values in the predicted range of 52 to 56. All nets used for the packing of oranges caused a decrease of the light-ness parameter L* with all quality classes of oranges. For carrot roots, we can observe that the slope of bold line for all quality roots flattens by using the orange net, while the washing treatment increases the differentiation of darkness between fresh and overmatured roots.
The red net improves the parameter a* significant-ly, consequentsignificant-ly, the unripe yellow oranges become more saturated changing the perception of colour
L*= 57.45-1 34q (washed roots) .
L*= 59.20-0.83q
L*= 52.95-0.25 (roots in net)
L*= 57.01-0.40q net No.13
L*= 68.52-0.68q
carrot “Nevis” cv.
oranges “Navelina” cv.
L*
70
60
50
40
30
L*
70
60
50
40
30
[image:3.595.79.521.59.273.2]0 3 6 9 12 q 0 4 8 12 16 q
Figure 1. The lightness parameter L* for oranges and carrot roots of all quality classes compared to the results obtained when using colour nets (1–13) and washing
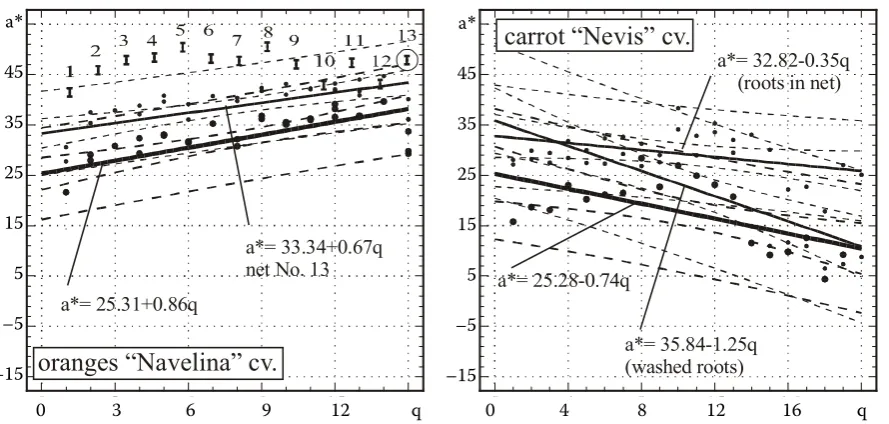
a*= 35.84-1.25q (washed roots) a*= 25.28-0.74q
a*= 32.82-0.35q (roots in net)
a*= 33.34+0.67q net No. 13 a*= 25.31+0.86q
carrot “Nevis” cv.
oranges “Navelina” cv.
0 3 6 9 12 q 0 4 8 12 16 q
a*
45
35
25
15
5
–5
–15
a*
45
35
25
15
5
–5
–15
[image:3.595.79.524.519.731.2]into the predicted range of 34.4 to 43.5. Ripe and overripe fruits become more red. The fruit colour is insignificant for the net as such, however, it is im-portant for the consumers’ classification and quality assessment. The net used for carrot roots increased this parameter with all quality classes. Using an or-ange net, the lightness parameter b* describing the coordinate of carrot colour equalises the values in a
similar range for all ripeness stages except dark roots with after- storage defects. The darkness of roots with defects increases the black colour represented by low values of the lightness parameter L*, which indicates a low quality of roots.
On the other hand, the washing of roots increases the chromaticity parameter b*, however, for health roots only without any dark spots. Carrot is served
b*= 53.03-0.56q net No. 13
b*= 66.64-0.90q
b*= 45.64-1.49q (washed roots)
b*= 30.51-0.70q
b*= 32.33-0.26q (roots in net)
carrot “Nevis” cv.
oranges “Navelina” cv.
0 3 6 9 12 q 0 4 8 12 16 q
b*
75
65
55
45
35
25
15
b*
75
65
55
45
35
25
[image:4.595.80.522.61.275.2]15
Figure 3. The chromaticity parameter b* for oranges and carrot roots of all quality classes compared to the results obtained when using colour nets (1–13) and washing
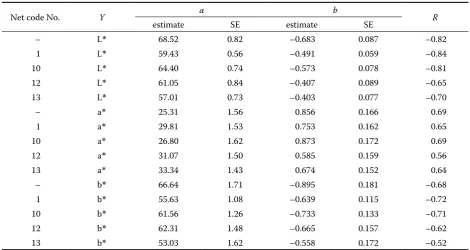
Table 1. Lightness parameter L* and chromaticity factors a* and b* of oranges of various quality groups and using different net (regression analysis – linear model: Y = a + bX)
Net code No. Y a b R
estimate SE estimate SE
– L* 68.52 0.82 –0.683 0.087 –0.82
1 L* 59.43 0.56 –0.491 0.059 –0.84
10 L* 64.40 0.74 –0.573 0.078 –0.81
12 L* 61.05 0.84 –0.407 0.089 –0.65
13 L* 57.01 0.73 –0.403 0.077 –0.70
– a* 25.31 1.56 0.856 0.166 0.69
1 a* 29.81 1.53 0.753 0.162 0.65
10 a* 26.80 1.62 0.873 0.172 0.69
12 a* 31.07 1.50 0.585 0.159 0.56
13 a* 33.34 1.43 0.674 0.152 0.64
– b* 66.64 1.71 –0.895 0.181 –0.68
1 b* 55.63 1.08 –0.639 0.115 –0.72
10 b* 61.56 1.26 –0.733 0.133 –0.71
12 b* 62.31 1.48 –0.665 0.157 –0.62
13 b* 53.03 1.62 –0.558 0.172 –0.52
[image:4.595.62.533.488.738.2]frequently as tarnish roots, whose chromaticity parameter a* reaches merely 21.7. The roots change its surface, on washing, which improves the percep-tion of the red colour up to 35.4, being thus very near to the colour of core. The use of vinyl bags or semitransparent orange nets, results in an increases the chromaticity coordinate a* of roots to 30.3 and increases this parameter of the washed roots to 32.8, satisfying the consumers’ perception of the carrot red colour.
Carrot is a vegetable mostly used in salads or in cooked dishes. Therefore, the predicted colour based on the visual assessment of the cross section of the root (Dobrzański & Rybczyński 2002) is analogous. The spectrum of the red colour ranges in this case from 30.0 (core) to 39.4 (bark). Describing the chromaticity parameter b* of carrot roots shows (Figure 3) that washing causes the increase of yellow colour from 30.4 up to 45.2 with fresh roots, how-ever, the dark ones are stable as to this parameter on the level of 15 to 16. The most influential in this case is the orange net, with the equalising parame- ter b* on the level of 27–32.4.
Figure 3 presents the influence of the net No. 13, which decreases the chromaticity parameter b* with all oranges of all quality classes. All nets (except No. 12) are red, having low values of yellow, and this indicates low values of b* as well. The influence of various quality groups of oranges on the light-ness parameter L* and chromaticity factors a* and b* using some other nets (Nos. 1, 10, 12, 13) are presented in the Table 1. Lower values of the
cor-relation coefficient and slope frequently indicate slight differences between the quality classes when nets are applied. However, the estimated values of intercepts representing each parameter of lightness or chromaticity show that all nets influence the perception of colour. The use of the nets involves an increase of the parameter of chromaticity a*, which indicates the red, while chromaticity b* decreases as does the lightness parameter L*, indicating a darker colour with less yellow.
All nets studied in this paper were similar, how-ever, they influence differently behaviour of the light reflected from the fruit because of the shape of the holes in the net and its different transparency. Most nets are similar in colour except net No. 12 which is brighter, showing more yellow colour.
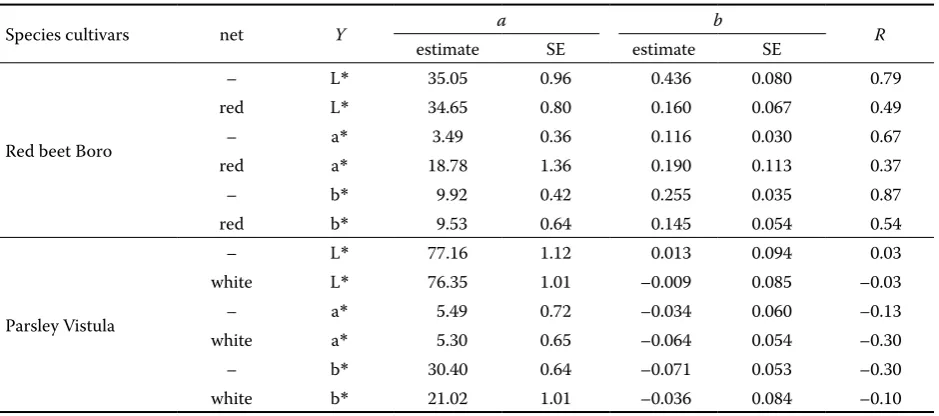
With the use of a dark red net for red beet only the chromaticity parameter a* increases statistically sig-nificantly (Table 2), which makes this vegetable more attractive for the consumer. Low values of the slope indicate red beet to be more uniform. A low value of the chromaticity parameter b* with the white net influences the estimation of the freshness of roots, which appear less yellow and less dirty.
[image:5.595.64.534.533.741.2]The human eye converts the electromagnetic rays into information which can be understood by the human brain. The brain then interprets this information as sensation of colour. The eye is able to convert varying frequencies of electromagnetic rays into different information to the brain as dif-ferent colours. It is important to remember that all objects are colourless and the sensation of colour
Table 2. Lightness parameter L* and chromaticity factors a* and b* of red beet and parsley of various quality groups and using red and white net (regression analysis – linear model: Y = a + bX)
Species cultivars net Y a b R
estimate SE estimate SE
Red beet Boro
– L* 35.05 0.96 0.436 0.080 0.79
red L* 34.65 0.80 0.160 0.067 0.49
– a* 3.49 0.36 0.116 0.030 0.67
red a* 18.78 1.36 0.190 0.113 0.37
– b* 9.92 0.42 0.255 0.035 0.87
red b* 9.53 0.64 0.145 0.054 0.54
Parsley Vistula
– L* 77.16 1.12 0.013 0.094 0.03
white L* 76.35 1.01 –0.009 0.085 –0.03
– a* 5.49 0.72 –0.034 0.060 –0.13
white a* 5.30 0.65 –0.064 0.054 –0.30
– b* 30.40 0.64 –0.071 0.053 –0.30
white b* 21.02 1.01 –0.036 0.084 –0.10
originates only in the human brain. The retina contains approximately 120 million staff cells and 6.5 million cone cells. Three different types of cone cells convert various wavelengths of electromagnetic rays. The perception of red colour is dependent on the cone cell type with maximum sensitivity of 620 nm. Green colour is allocated to the cone cell type with maximum sensitivity of 520 nm and blue colour to the cell type with maximum sensitivity of 450 nm. Our perception of colours is dependent on which wavelengths are reflected by an illuminated object. Embedded in the eye retina are the staff cells and three different types of cone cells, which are re-sponsible for the colour vision. The way in which the electromagnetic rays are reflected is partly responsi-ble for the way of the man perception. Based on the fact that the retina of the human eye contains three different types of cone cells which are sensitive to the primary colours of red, green, and blue, respec-tively, it is possible to estimate the colour through a mixing process which operates when the reflection of light from an object passes into the eye, e.g. from a coloured net or fruit skin. Finally, the colour of the net influences the perception of the fruit colour if the fruit is in the cover.
Reassuming, the chromaticity parameter a* is the most influential factor affecting the human percep-tion of the fruit colour. To improve customers’ sat-isfaction and to create a more uniform perception of the colour oranges are covered with a red net. The red net improves this parameter significantly, thus unripe yellow oranges become more saturated changing the perception of the colour into the pre-dicted range. Ripe and overripe fruits become more red. The use of the colour net packing can improve the appearance of fruits and vegetables, however, this system should be carefully applied, mostly with unripe fruits.
References
Ayuso M.C., Bravo F.J., Ruiz-Altisent M., Barreiro P. (1996): Sensing colour stability and mixtures of powder paprika using of optical reflectance and image analysis. In: AgEng’96, Madrid, 903–904.
Bellon V., Rabatel G., Guizard C. (1992): Automatic sorting of fruit: sensors for the future. Food Control, 3: 49–54.
Chen P. (1996): Quality evaluation technology of agricultural products. In: Proc. ICAME’96, Seul, 171–190.
Chen P., Ruiz M., Lu F., Kader A.A. (1986): Study of impact compression damage on Asian pears. ASAE Paper No. 86-3025, 30: 1193–1197.
Delwiche M.J., Baumgardner R.A. (1983): Ground colour measurements of peach. Journal of the American Society for Horticultural Science, 108: 1012–1016.
Delwiche M.J., Baumgardner R.A. (1985): Ground colour as a peach maturity index. Journal of the American Society for Horticultural Science, 110: 53–57.
Dobrzański B., jr., Rybczyński R. (2002): Colour as a quality parameter of fruits and vegetables. In: Blahovec J., Kutilek M. (eds): Physical Methods in Agriculture. Kluwer Academic Publishers, 375–398
Dobrzański B., jr., Rybczyński R., Dobrzańska A., Wójcik W. (2001): Some physical and nutritional quality parameters of storage apple. International Agrophysics, 15: 13–18. Felfoldi J., Fekete A., Gyori E. (1996): Fruit colour
as-sessment by image processing. In: AgEng’96, Madrid, 869–870.
Fornes I., Ruiz L.A., Juste F., Molto E., Mehouachi J. (1994): Study of variation of physicochemical properties of citrus fruits related to maturity. In: XII CIGR, AgEng’94, Milano, 907–908.
Francis F.J. (1995): Quality as influenced by colour. Food Quality and Preference, 6: 149–155.
Garcia Fernandez J.L., Ruiz-Altisent M., Barreiro P. (1994): Factors influencing apple and pear physical properties and bruise susceptibility. In: AgEng’94, Milano.
Good H. (2002): Measurement of colour in cereal products. Cereal Foods World, 47: 5–6.
Harrell R.C., Levi P. (1988): Vision controlled robots for automatic harvesting of citrus. In: AgEng’88. March 2–5, 1988, Paris.
Kader A.A. (1999): Fruit maturity, ripening, and quality relationships. Acta Horticulturae, 485: 203–208. Kameoka T., Hashimoto A., Motonaga Y. (1994): Surface
col-our measurement of agricultural products during post-ripening. In: Proc. Colour Forum Japan’94. Tokyo, 11–14.
Kappel F., Fisher-Fleming R., Hogue E.J. (1995): Ideal pear sensory attributes and fruits characteristics. HortScience, 30: 988–993.
Lancaster J.E. (1992): Regulation of skin colour in apples. Critical Reviews in Plant Science, 10: 487–502.
Miller B.K. Delwiche M.J. (1988): A colour vision system for peach grading. ASAE St. Joseph, MI, ASAE Paper No. 88-6025.
Molto E., Aleixos N., Ruiz L.A., Vazquez J., Juste F. (1996): An artificial vision system for fruit quality as-sessment. In: AgEng’96. Madrid, 2, 956–957. (paper 96F-078)
Motonaga Y., Kameoka T., Hashimoto A. (1997): Con-structing colour image processing system for managing the surface colour of agricultural products. Journal of the Japanese Society of Agricultural Machinery, 59: 13–21. Nielsen H.M., Paul W. (1996): Colour image analysis for
Paulus I., Schrevens E. (1997): A methodology to study the interaction of external features of apples on human quality classification. In: 5th Int. Symp. Fruit, Nut, and Vegetable Production Engineering. Davis, California, 1–6.
Saks Y., Hofman P.J., Meiburg G.F. (1999): Potential for improvement of mango skin colour during storage. Acta Horticulturae, 485: 325–329.
Studman C. (1998): Ergonomics in apple sorting: a pilot study. Journal of Agricultural Engineering Research, 70: 323–334.
Received for publication January 15, 2008 Accepted after corrections February 5, 2008
Abstrakt
Dobrzański B., Jr., Rybczyński R. (2008): Vliv způsobů balení na vnímání barvy a zlepšení vzhledu ovoce a zeleniny. Res. Agr. Eng., 54: 97–103.
Vzhled ovoce a zeleniny má velký vliv na vnímanou kvalitu. Proto barva je jedním z nejdůležitějších parametrů spo-třebitelského vnímání kvality. Plody různým způsobem vystavené působení slunečních paprsků se liší barvou, často se zdají být nedozrálé a dosahují plné zralosti až během manipulace a transportu, některé z nich jsou ještě potom zelené a s nedozrálým vzhledem. Pomeranče, mrkev, červená řepa, petržel byly posuzovány z hlediska odhadu jejich kvality. K jejich balení byly vyzkoušeny různé druhy sítí. Měření světlosti a chromacity byly použity podle L*a*b* systému. Červená síťka použitá k balení pomerančů způsobila pokles parametru L* ve všech stádiích zralosti plodů. Ale některé nezralé a lesklé pomeranče při požití červené síťky vypadaly mnohem zralejší. Chromacita a* je parame-trem který je člověkem nejsilněji vnímaným parameparame-trem barvy. Červená síťka zlepšovala tento parametr skutečně významným způsobem, nedozrálé žluté plody se staly vybarvenějšími a jejich vnímání barvy se dostalo do žádané oblasti. Barva je nevýznamná pro síťku ale je důležitá pro barevnou klasifikaci člověkem.
Klíčová slova: pomeranč; mrkev; červená řepa; petržel; kvalita; L*; a*; b*; sítě
Corresponding author:
Prof. B. Dobrzański, Jr., Ph.D., DSc., Polish Academy of Sciences, B. Dobrzański Institute of Agrophysics, Lublin, Poland