Soil Management Practice Effect on Water Balance
of a Dryland Soil during Fallow Period
on the Loess Plateau of China
Shulan ZHANG
1,2, Xueyun YANG
2and Lars LOVDAHL
31State Key Laboratory of Soil Erosion and Dryland Farming on Loess Plateau and 2College
of Resources and Environment, Northwest A&F University, Yangling, P.R. China; 3Department
of Forest Ecology and Management, Swedish University of Agricultural Sciences, Umea, Sweden
Abstract
Zhang S., Yang X., Lovdahl L. (2016): Soil management practice effect on water balance of a dryland soil during fallow period on the Loess Plateau of China. Soil & Water Res., 11: 64–73.
To understand the mechanisms affecting water balance partitioning during fallow on drylands could improve the fallow management practices in arable land ecosystems. A three-year field experiment was conducted to evaluate the effects of field management regimes on water balance partitioning and fallow efficiency during the fallow periods under a winter wheat (Triticum aestivum L.) fallow system on the Loess Plateau, China. The fallow management regimes tested were: (i) conventional practice, (ii) catch cropping, and(iii) no tillage with wheat straw mulching. A process-oriented ecosystem model (CoupModel) was calibrated with field measure-ments andthen used to generate comparative simulations of the water balance partitioning. The simulations indicated that mulching increased the soil water storage change by 38–71 mm during the three fallow periods, thus resulting in higher fallow efficiency by 9–12%, and decreased soil evaporation by 22–72 mm, compared with the conventional practice. Furthermore, water reached deeper horizons, resulting in 7 mm deep percolation in a wet year under mulching but not under conventional practice or catch cropping. The simulation results also showed that the catch cropping decreased the soil water storage change by 13–21 mm, although it lowered soil evaporation by 11–51 mm, and altogether reduced the fallow efficiency by 3–9%, compared to conventional practice. On the Loess Plateau of China mulching proved to be a sound measure for ensuring certain fallow ef-ficiency and possibly benefit to the water cycle, while catch cropping negatively partitioned the water balance. The catch cropping under mulching might be another management regime to be considered.
Keywords: deep percolation; fallow efficiency; modelling; soil evaporation; soil water storage
Water is the most limiting factor for crop produc-tion under dryland farming in semiarid areas. In China, dryland farming is practiced on about one third of the arable land, a large part of which (about 40%) is situated on the semiarid Loess Plateau (Li 2004). Winter wheat, as a main cereal crop sown in late September and harvested in early June to early July of the next year, varying with latitudes, occupies 56% of the arable land in the region (Zhu 1989). The prevailing cropping practice is winter wheat – fallow system, one crop per year. However, winter wheat growing season does not coincide with the
Therefore, the successful fallow practice improving the water storage at sowing time is important for wheat production.
The conventional management regime for dryland winter wheat cultivation on the Loess Plateau in-volves keeping the farmland bare fallow during the rainy summer after the wheat harvest (early June or early July to mid or late September). The aim is to accumulate water from precipitation for use by the subsequent wheat crop (Li & Xiao 1992). However, the fallow efficiency (percentage of rainfall stored in the soil during the fallow period) using this method is low, because the potential evaporation is high when the temperature is high, thus most of the precipitation collected in the soil is lost again through evaporation (Li & Xiao 1992; Latta & O’leary 2003).
The wheat straw mulching is regarded as one of the best ways of retaining more water in the soil and decreasing soil evaporation (Steiner 1989; Li & Xiao 1992). Nevertheless, O’leary and Con-nor (1997) conclude that in general, zero tillage (primarily with stubble retention) offered large and consistent increases in soil water storage on heavy-textured clay soils in a 420-mm rainfall zone, but on lighter sandy loam soil under the lower rainfall regime (343 mm), the advantage in soil water storage, through both stubble retention and zero tillage, was less frequent. In the southeast of the Loess Plateau, several researchers reported no tillage with mulch-ing improved water conservation at wheat sowmulch-ing in most years (Jin et al. 2007; Su et al. 2007), in the west of the Loess Plateau as well (Huang et al. 2008). In the same region, however, Zhang et al. (2009) found mulching effectiveness differing with land positions and having little effect on the increase of soil water storage at terrace land. Hence, mulching effects rely on various factors, such as soil types and positions, rainfall frequency and patterns, and atmospheric demand.
The presence of mulch on the soil surface can influ-ence the partitioning of water balance. Understanding the mechanisms affecting water balance partitioning during fallow on drylands could improve the fallow management practices in arable land ecosystems, to maximize the stored soil water at crop sowing time. Previously, Zhang et al. (2007a) evaluated different soil management regimes effects on annual water balance and wheat water use efficiency by model simulation. The study presented here is focused on assessing effects ofthe wheat straw mulching and the catch croppingon the partitioning of water
bal-ance componentsduring the fallow period and on the fallow efficiency by using the simulated results.
MATERIAL AND METHODS
Site description and experimental design. The experiment was conducted in Heyang county (35°19'37"N, 110°4'57"E, altitude 910 m a.s.l.), Shaanxi Province. The site is located on a large flat area in the southeastern part of the Loess Plateau. The soil (Heilu soil, see Zhu et al. 1983) represents the main soil type widespread in the region. According to the USDA classification system, the soil is defined as silt loam and, according to the FAO-UNESCO soil map (FAO-UNESCO 1974), the soil type is a Chromic Cambisol.
The study included three treatments. The first was conventional practice (C), wheat harvest leaving stubble (5–10 cm) and roots; the soil was then tilled to ca. 20 cm depth by spade and left bare during fal-low time. The second treatment was catch cropping (CC), wheat harvest leaving stubble (5–10 cm) and roots; a catch crop (bean) was directly sown with-out applying any fertilizer and harvested abwith-out one month before wheat sowing. The harvested bean biomass was immediately incorporated into the soil by manual ploughing. The catch crops used were green bean (Phaseolus vulgaris L.) in the first year and black bean (Glycine max (L.) Merr.) in the next two years. The harvest times for the catch crops were Aug 30, 2002, Aug 12, 2003, and Aug 23, 2004, respectively. The third treatment was mulching (M), wheat harvest leaving stubble (5–10 cm) and roots; it remained unploughed and air-dried, unchopped wheat straw (about 0.8 kg/m2) was evenly distributed
over the soil surface and kept at relatively constant levels for the duration of the fallow. The duration of three fallow periods was 104 days (June 11–Sept 23, 2002), 103 days (June 13–Sept 24, 2003) and 102 days (June 11–Sept 21, 2004), respectively. Three replicates of each treatment were randomly distributed in the field. The size of each plot was 5 × 5 m, with0.3 m wide and 0.1 m high separatingridges.
5 and 10 cm, to monitor soil temperatures. Hourly readings were recorded throughout the experimental period. The soil moisture sensors were calibrated in the field by comparing its readings with soil moisture measured gravimetrically during the experimental period. To compare variations within each treatment, water content was occasionally measured gravimetri-cally in all replicate plots. The dry weights of catch crop were measured prior to its manual “ploughing-in”.
Meteorological data. A climate station equipped with a data logger (CR10x; Campbell Scientific, Inc.) near the field plots measured air temperature, air humidity, and wind speed every minute, and stored hourly mean values of these variables, and accu-mulated global radiation and precipitation values, throughout the experimental period. The measuring heights were 2 m for air temperature and air humidity, and 4 m for wind speed. The sensors were factory calibrated before installation.
Model description. The CoupModel is a one-dimensional model simulating fluxes of water, heat, carbon, and nitrogen in the soil–plant–atmosphere system (Jansson & Karlberg 2004), coupling the for-mer SOIL (Johnsson & Jansson 1991) and SOIL-N (Eckersten et al. 2001) models. A detailed technical description of the model was given by Jansson and Karlberg (2004).
Model application. The meteorological variables used as driving variables in the simulations presented here were daily air temperature, relative air humidity, wind speed, precipitation, and global radiation. In addition, soil properties such as hydraulic conduc-tivity and soil water retention curves were used as model input (Zhang et al. 2007b), while the Brooks-Corey equation (Brooks & Brooks-Corey 1964) was used to describe soil water retention and, in combination with Mualem’s equation (Mualem 1976), to esti-mate unsaturated hydraulic conductivity (Zhang et al. 2007b). The same soil hydraulic properties were applied for all treatments. The measured soil water content profile and soil temperature profile (apart from measured values, other layers assumed to be 15°C) were used as initial conditions for each treatment. The simulated soil profile (0–240 cm) was composed of 11 soil compartments (0–5, 5–15, 15–25, 25–35, 35–45, 45–55, 55–65, 65–80, 80–120, 120–160, and 160–240 cm deep). The simulations were conducted under the assumption that the soil hydraulic properties remained unchanged during the experimental period. The calibration procedure of the model was the same as that reported by Zhang et al.
(2007a). Several parameters were tuned to provide a reasonable agreement between the simulated results and measured soil moisture and soil temperatures for all ofthe three years. In the catch cropping treat-ment, all parameters were set to the same values as in the conventional management. To simulate a catch crop (bean), the wheat parameterization (Zhang et al. 2007a) was adjusted to fit the measurements of total above-ground biomass, soil temperature, and soil moisture contents. The same sowing and harvest times of the catch crop were used in the simulation as well as in the field operations.
Analytical method. The equation of field water balance is as follows:
P = E + T + D + R +DS (1)
where:
P – precipitation
E – soil evaporation
T – crop transpiration
R – surface runoff
D – deep percolation below the root zone, in the present paper considered as 2.4 m below the soil surface
DS – change in soil water storage (240 cm soil profile)
In this study surface runoff was zero because the topography was flat. All terms in Eq. (1) are cumula-tive totals since the beginning of the fallow season.
The fallow efficiency (FE) is calculated as:
FE = DS/P (2)
RESULTS
In 2003, the rainfalls mainly occurred in July and August, and the least precipitation appeared in June. In 2004, about 50% of fallow rainfall fell in August. The potential evaporation showed the highest values in July for all the three fallows, then followed by June and August; it was the least in September. This implies
[image:4.595.64.531.125.255.2]that rainfall in September might be more retained in soil, while rainfall in July was prone to evaporation. Model prediction. The model predicted the soil moisture dynamics for all treatments reasonably well during the course of the experiment(Figure 1). The determination coefficients R2 between the simulated and Table 1. Fallow precipitation and the potential evaporationa during 2002, 2003, and 2004 fallow seasonsb compared with long-term monthly totals (1976–2005) at the experimental site (in mm)
Period Precipitation Potential evaporation
2002 2003 2004 1976–2005 2002 2003 2004
June 17.6 61.3 51.3 56.7 124.4 111.1 128.1
July 48.4 160.6 95.3 109.4 179.2 134.1 138.3
August 85.3 205.0 181.9 113.4 124.1 91.2 114.6
September 92.8 87.8 55.2 76.9 72.3 65.5 64.5
Fallow 244 515 384 356 500 402 446
Annual 468 825 641 535 1152 976 –
Fallow/Annual 0.52 0.62 0.60 0.67 0.43 0.41 –
aPotential evaporation was calculated according to Penman (1948); bthe first fallow was from June 10–Sept 23, 2002, the
second one from June 12–Sept 24, 2003, and the third one from June 10–Sept 21, 2004; the fallow rainfall for the long-term (1976–2005) is taken as a sum of full four months (June to September) and, strictly speaking, is not fully comparable with the sums over particular fallow periods
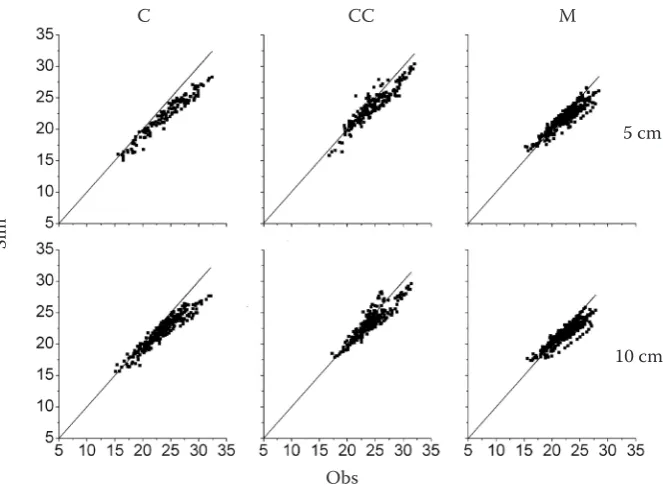
Figure 1. Correlation between the measured (Obs) and simulated (Sim) depth-averaged volumetric soil water contents (% by volume) for the 0–200 cm soil profile during the three fallow periods under particular treatments; C – conventional treatment; CC – cover crop treatment; M – mulch treatment
Obs
C CC M
Sim
10 cm
100 cm
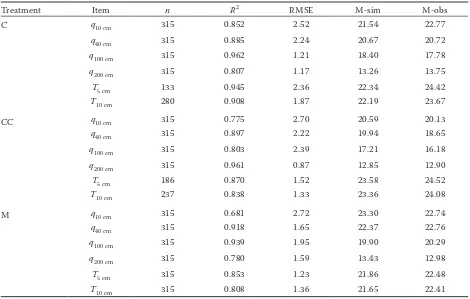
[image:4.595.94.502.425.709.2]observed values ranged from 0.681 to 0.962; in general, the R2 values were lower for the 10-cm depth (Table 2).
The root mean square error (RMSE) values were less than 3.0% (by volume). In most cases the model pre-dicted higher water contents than the measured values, with differences between the simulated and measured mean values ranging from 0.05 to 1.29% (Table 2). The model described the differences between the treatments consistently, and similarly to the measurements. The simulated water contents in the deeper layers showed a good agreement with the measured values. At 10 cm the simulated water content was overestimated during wet conditions (high peaks), but was similar to the values measured during dry periods.
The model also predicted well the soil temperature dynamics during three fallow periods (Figure 2). The determination coefficients R2 between simulated and
observed values ranged from 0.808 to 0.945, and the RMSE values were less than 2.5°C. In most cases the model underestimated high soil temperatures, with
differences between the simulated and measured mean values ranging from 0.6 to 2.1°C (Table 2). Moreover, the modelled biomass values of catch crop were within the range of the measured values ± 2 SD (standard deviation) (Figure 3).
Overall, we demonstrated that the ecosystem model CoupModel provided good simulations of the dynam-ics of water content changes and soil temperatures and the crop biomass for different soil management regimes and climate variations during fallow periods on a loess soil in China. The model described the soil wetting, drying, and heat cycles well, although there were some discrepancies between the simulated and measured values.
[image:5.595.63.533.422.721.2]Soil evaporation. The simulated dynamics of soil evaporation is illustrated in Figure 4. The conven-tional treatment developed the highest amount of soil evaporation during the course of three tested fallows. The catch cropping yielded the lowest amount of soil evaporation during its growing. The differences
Table 2. Numbers of observations (n) of soil moisture (q, % by volume) and soil temperature (T, °C) during three fallow seasons, determination coefficient (R2) between simulated and measured values, root mean square errors (RMSE) of simulated vs observed values, mean values from simulation (M-sim) and from measurement (M-obs) under particular management practices at the Heyang site
Treatment Item n R2 RMSE M-sim M-obs
C q10 cm 315 0.852 2.52 21.54 22.77
q40 cm 315 0.885 2.24 20.67 20.72
q100 cm 315 0.962 1.21 18.40 17.78
q200 cm 315 0.807 1.17 13.26 13.75
T5 cm 133 0.945 2.36 22.34 24.42
T10 cm 280 0.908 1.87 22.19 23.67
CC q10 cm 315 0.775 2.70 20.59 20.13
q40 cm 315 0.897 2.22 19.94 18.65
q100 cm 315 0.803 2.39 17.21 16.18
q200 cm 315 0.961 0.87 12.85 12.90
T5 cm 186 0.870 1.52 23.58 24.52
T10 cm 237 0.838 1.33 23.36 24.08
M q10 cm 315 0.681 2.72 23.30 22.74
q40 cm 315 0.918 1.65 22.37 22.76
q100 cm 315 0.939 1.95 19.90 20.29
q200 cm 315 0.780 1.59 13.43 12.98
T5 cm 315 0.853 1.23 21.86 22.48
T10 cm 315 0.808 1.36 21.65 22.41
C – conventional treatment; CC – cover crop treatment; M – mulch treatment;
RMSE = where:
√
1/n∑
yisim and yiobs are the simulated and observed soil moisture contents nbetween treatments of surface cover (mulching and catch cropping) and non-cover (conventional) were less significant under dry condition (e.g. 2002) than under wet condition (e.g. 2003). In the beginning of each fallow the rainfalls did not meet the amounts of soil evaporation, and this process lasted for about two months in 2002, but much shorter in 2003 and 2004.
[image:6.595.134.466.93.336.2]Soil water storage and fallow efficiency. The simulated water storage in the upper 55 cm soil layer showed the mulching treatment was associated with the highest water storage in two of three fallow periods (2002 and 2004) (Table 3). The differences of stored water between mulching and conventional treatments varied from 0 to 18 mm for particular
[image:6.595.63.289.522.703.2]Figure 2. Correlation between the measured (Obs) and simulated (Sim) soil temperatures (°C) for the 5 cm and 10 cm soil depths during the three fallow periods under particular treatments; C – conventional treatment; CC – cover crop treatment; M – mulch treatment
Table 3. Simulated changes (increase) in soil water storage (in mm) from the previous harvest to the following sowing at different soil layers under particular treatments
Soil layer
(cm) Year
Treatments
C CC M
0–55
2002 39 42 57
2003 45 44 45
2004 51 45 63
55–120
2002 2 0 23
2003 79 84 81
2004 50 40 64
120–240
2002 1 0 0
2003 79 61 148
2004 7 3 22
See footnote to Table 1 for the exact lengths of fallow seasons; C – conventional treatment; CC – cover crop treatment; M – mulch treatment
Figure 3. Measured and simulated biomass yields of catch crops during the 2002, 2003, and 2004 fallow periods; ver-tical bars express two times standard deviations
Obs
C CC M
Sim
5 cm
10 cm
Year 0.5
0.4
0.3
0.2
0.1
0.0
Bioma
ss (kg/m
2)
Sim Obs
[image:6.595.305.533.555.712.2]fallow periods. The amounts of stored water as-sociated with theconventional practice and catch cropping treatments were similar except in 2004. In the 55–120 cm layer, the amount of water stored varied greatly between treatments from year to year
[image:7.595.103.488.95.336.2](Table 3). The mulching manifested the highest wa-ter storage, while the catch cropping displayed the lowest level in 2002 and 2004. All treatments had similar water storage levels in 2003. The amount of water stored in the 120–240 cm layer was similar in
[image:7.595.130.474.470.714.2]Figure 5. Simulated fallow efficiency and precipitation dynamics during the 2002, 2003, and 2004 fallow periods under particular treatments; C – conventional treatment; CC – cover crop treatment; M – mulch treatment; the break was applied for values between –11 and –0.4 on Y-axis
Figure 4. Simulated cumulative soil evaporation under particular treatments and precipitation during the 2002, 2003, and 2004 fallow periods; C – conventional treatment; CC – cover crop treatment; M – mulch treatment; Prec − precipitation
Date
Pr
ec
ipit
ation (mm)
C CC M
Fallow effic
ienc
y (mm/mm)
Date
A
cc
um
ul
at
ed s
oil e
va
pora
tion, pr
ec
ipit
ation (mm)
all treatments in 2002, while the mulched plots had higher levels of water storage than the other treat-ments in 2003 and 2004 (Table 3).
The dynamics of FE during the three fallows under the three treatments is shown in Figure 5. The FE showed negative in the beginning of each fallow period. The time at which FE started to be positive differed from treatment to treatment and from year to year. In 2002, the negative FE was observed before August 5th
for all treatments. The positive FE had been observed since then on the mulching treatment, while it fluctu-ated around zero until August 20th and only thereafter
became positive for the treatment of conventional practice. In sharp contrast to mulching, FE fluctuated around zero till September 10th when it showed
posi-tive for the treatment of catch cropping. In 2003 and 2004, the FE showed negative before the end of June, thereafter became positive for all the treatments. The catch cropping showed similar or lower fallow efficiency compared with the conventional practice, while mulch-ing had the highest fallow efficiency.
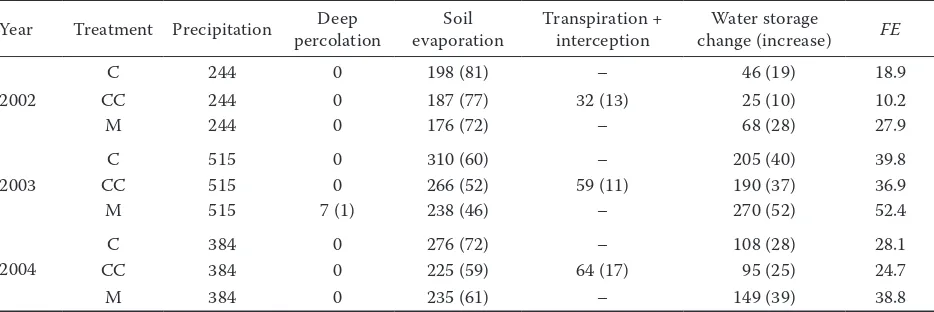
Water balance. The simulated water balance for the three treatments is presented in Table 4. During the fallow periods, soil evaporation was the highest under conventional practice, accounting for 60–81% of the precipitation, the lowest under mulching (46–72%), and the medium under catch cropping (52–77%). On average, soil evaporation was reduced by 45 mm per season due to mulching and by 35 mm per season due to catch cropping, compared with the conven-tional practice. Deep percolation only occurred on the mulching treatment in 2003 and occupied only 1% of precipitation. The transpiration under catch
cropping accounted for 11–17% of the precipitation. On average, the mulching increased soil water stor-age over the fallow season by 42 mm, relative to the conventional treatment, while the catch cropping decreased soil water storage by 17 mm.
DISCUSSION AND CONCLUSIONS On the Loess Plateau of China, the issue of fallow management practice is of a considerable practical interest because water supply is the major factor limiting crop yield. According to the simulations in the present study, the mulching increased soil water storage relative to conventional practice by 38–71 mm. The improvement of water storage under mulching during thefallow time was more efficient during the wet year (2003) than during a dry year (e.g. 2002). The amount of water gained under the mulching, if used with the water-use efficiency 15 kg grain/ha/mm (Zhang et al. 2007a), is sufficient to increase yield by 0.57–1.07 t/ha. The effect of mulching with zero tillage on increasing soil water storage in this study was generally consistent with that reported elsewhere (e.g. Unger 1978; Jin et al. 2007) under different weather patterns.
[image:8.595.64.531.127.283.2]The soil water storage or fallow efficiency depends on soil evaporation which is related to the rainfall pat-terns and the atmospheric demand. Soil evaporation, a two-stage process (Ritchie 1972), is mainly controlled by the atmospheric demand in the first stage (when the soil is wet) and by water availability and hydraulic conductivity of soil in the second stage, when it is drier. However, the role of mulching in lessening soil
Table 4. Simulated water balance components (in mm) and fallow efficiency (FE, %) for fallow periods and 240 cm soil profile under different treatments at Heyang site
Year Treatment Precipitation percolationDeep evaporationSoil Transpiration + interception change (increase)Water storage FE
2002
C 244 0 198 (81) – 46 (19) 18.9
CC 244 0 187 (77) 32 (13) 25 (10) 10.2
M 244 0 176 (72) – 68 (28) 27.9
2003
C 515 0 310 (60) – 205 (40) 39.8
CC 515 0 266 (52) 59 (11) 190 (37) 36.9
M 515 7 (1) 238 (46) – 270 (52) 52.4
2004
C 384 0 276 (72) – 108 (28) 28.1
CC 384 0 225 (59) 64 (17) 95 (25) 24.7
M 384 0 235 (61) – 149 (39) 38.8
evaporation is mainly in the first stage (Zhang et al. 2007a). In the present study, the rainfall in the 2002 fallow period was lower than the long-term average (Table 1) and only its 27% fell in the first half of the fallow duration. The soil evaporation often underwent its second stage, when the effect of mulch was low, and, therefore, the evaporated soil water depth was greater than the rainfall (Figure 4), which led to the negative fallow efficiency before August 5th for all treatments
(Figure 5). Consequently, the role of management practices was minor under the rather dry condition. With the increase of rainfall frequency and quantity, mulching played positive role in augmenting fallow efficiency by 7% at the end of August and by 9% at the end of that fallow, relative to conventional practice (Table 4). Nevertheless, the role of mulching was less efficient under high potential evaporation (August) than under the low one (September) (Figure 5, Table 1). In 2003, because of high frequency of rainfalls and low potential evaporation, the fallow efficiency was the highest among the three investigated fallows, and the mulching effectiveness was also more apparent than that in the other two fallows, due to noticeably reduced soil evaporation (Figure 4). In 2004, the most rainfalls fell in August, especially in the first half of August, when fallow efficiency reached above 0.4 under both conventional tillage and catch cropping and more than 0.5 under mulching, while later on the rainfalls were less frequent, soil evaporation went over to the second stage, and the fallow efficiency dropped. Overall, on the Loess Plateau of China, where summer fallow coincides with the rainy season, soil evaporation could be effectively damped by mulching (Figure 4). Thus, the mulching could ensure fallow efficiency.
In comparison with conventional practice, catch cropping had negative effects on the repartitioning of water balance. The catch cropping decreased water storage at the time of wheat sowing for all three fallows, more during a dry year than during a wet year, due to the catch crop transpiration and in spite of reducing soil evaporation during its growing, compared with the conventional practice (Tables 3 and 4). After three successive years of catch crops incorporated into the soil, the organic matter content remained unchanged (data not shown). The expected positive effect of thecatch cropping on soil organic matter contentwas obviously too minor to be detected after such a short time. From the economic point of view, the catch crop used as green manure is not a profitable management practice in the short term (Zhang et al. 2009). Therefore, planting short-lived
cash crop, for example peanut as shown by Jin et al. (2007), or the cash crop for animal feeding grown under mulching, can be alternative approaches to the fallow management practice in the region, provided that the subsequent wheat yield is not adversely impacted.
Acknowledgements. This study was partly supported by the
NSFC project of China (No. 31170411), and by the Agricul-tural Scientific Research Talent and Team Program of China.
References
Brooks R.H., Corey A.T. (1964): Hydraulic Properties of Porous Media. Hydrology Paper No. 3. Fort Collins, Colo-rado State University.
Eckersten H., Blomback K., Katterer T., Nyman P. (2001): Modelling C, N, water and heat dynamics in winter wheat under climate change in southern Sweden. Agriculture, Ecosystems & Environment, 86: 221–235.
FAO-UNESCO (1974): Soil Map of the World 1 : 5 000 000. Paris, UNESCO.
Huang G.B., Zhang R.Z., Li G.D., Li L.L., Chan K.Y., Heenan D.P., Chen W., Unkovich M.J., Robertson M.J., Cullis B.R., Bellotti W.D. (2008): Productivity and sustainability of a spring wheat-field pea rotation in a semi-arid envi-ronment under conventional and conservation tillage systems. Field Crops Research, 107: 43–55.
Huang M., Li Y. (2000): On the potential increasing pro-ductivity of dryland winter wheat in the Loess Plateau. Journal of Natural Resources, 15: 143–148. (in Chinese) Jansson P.-E., Karlberg L. (2004): Coupled Heat and Mass
Transfer Model for Soil-plant-atmosphere System. Stock-holm, Royal Institute of Technology.
Jin K., Cornelis W.M., Schiettecatte W., Lu J., Yao Y., Wu H., Gabriels D., De Neve S., Cai D., Jin J., Hartmann R. (2007): Effects of different management practices on the soil-wa-ter balance and crop yield for improved dryland farming in the Chinese Loess Plateau. Soil and Tillage Research, 96: 131–144.
Johnsson H., Jansson P.E. (1991): Water-balance and soil-moisture dynamics of field plots with barley and grass ley. Journal of Hydrology, 129: 149–173.
Latta J., O,Leary G.J. (2003): Long-term comparison of rotation and fallow tillage systems of wheat in Australia. Field Crops Research, 83: 173–190.
Li S. (2004): Chinese Dryland Agriculture. Beijing, Chinese Press of Agriculture.
Li Y. (1983): The properties of water cycle in soil and their effect on water cycle for land in the Loess Plateau. Acta Ecologica Sinica, 3: 91–101. (in Chinese)
Li Y., Shu S. (1991): A Comprehensive Research on High Ef-ficient Eco-economic System in Wangdonggou Watershed of Changwu County. Beijing, Sci-Tech Document Press. Mualem Y. (1976): A new model for predicting the hydraulic conductivity of unsaturated porous media. Water Re-sources Research, 12: 513–522.
Musick J.T., Jones O.R., Stewart B.A., Dusek D.A. (1994): Wa-ter–yield relationships for irrigated and dryland wheat in the U.S. Southern Plains. Agronomy Journal, 86: 980–986. O’Leary G.J., Connor D.J. (1997): Stubble retention and
tillage in a semi-arid environment: 1. Soil water accumu-lation during fallow. Field Crops Research, 52: 209–219. Penman H. (1948): Natural evaporation from open water,
bare soil and grass. Proceedings of the Royal Society, Series A, 193: 120–145.
Ritchie J.T. (1972): Model for predicting evaporation from a row crop with incomplete cover. Water Resources Re-search, 8: 1204–1211.
Steiner J.L. (1989): Tillage and surface residue effects on evaporation from soils. Soil Science Society of America Journal, 53: 911–916.
Su Z., Zhang J., Wu W., Cai D., Lv J., Jiang G., Huang J., Gao J., Hartmann R., Gabriels D. (2007): Effects of
con-servation tillage practices on winter wheat water-use efficiency and crop yield on the Loess Plateau, China. Agricultural Water Management, 87: 307–314.
Unger P.W. (1978): Straw-mulch rate effect on soil wa-ter storage and sorghum yield. Soil Science Society of America Journal, 42: 486–491.
Zhang S., Lovdahl L., Grip H., Jansson P-E, Tong Y. (2007a): Modelling the effects of mulching and fallow cropping on water balance in the Chinese Loess Plateau. Soil and Tillage Research, 93: 283–298.
Zhang S., Lovdahl L., Grip H., Tong Y. (2007b): Soil hy-draulic properties of two loess soils in China measured by various field-scale and laboratory methods. Catena, 69: 264–273.
Zhang S., Lovdahl L., Grip H., Tong Y., Yang X., Wang Q. (2009): Effects of mulching and catch cropping on soil temperature, soil moisture and wheat yield on the Loess Plateau of China. Soil and Tillage Research, 102: 78–86. Zhu X. (1989): Soil and Agriculture in the Loess Plateau.
Beijing, Agricultural Science Press.
Zhu X., Li Y., Peng X., Zhang S. (1983): Soils of the loess region in China. Geoderma, 29: 237–256.
Received for publication November 18, 2014 Accepted after corrections July 29, 2015
Corresponding Author: