The gray forest soils (Phaeozem) of the European part of Russia were cultivated approximately during 200 years. These soils are characterized by a low content of total carbon (1–1.5%) and nitrogen (0.11–0.12%). Since the application of organic fertilizers became rare during the last decade, at present the main source of organic matter for cultivated soils of Russia are roots and stubble residues of agricultural plants. The rate of CO2 emission from the soil is an important indicator of its microbial activity and intensity of organic matter decomposition. As a rule, the measurements of CO2 emission rate are carried out through the growing period under field conditions and at a temperature above 5°C in the model experiments. It is suggested that CO2 production and emission are very poor at low temperatures, and total CO2 emission is negligible beyond the growing season. However, our previous investigations (Lopes de Gerenyu et al. 2001b, Kurganova et al. 2001, 2003) have been shown that neglect of cold CO2 emission leads to
invalid assessments of the annual CO2 flux and the carbon balance as a whole.
Soil temperature and moisture are the main ecological factors controlling the process of soil organic matter decomposition, CO2 production and emission from soils (Kovalenko et al. 1978, Swift et al. 1979, Lomander et al. 1998, Rustad et al. 2000). A high positive correlation between CO2 emission rate and soil temperature was found for many soils under natural and agricultural con-ditions (Raich and Schlesinger 1992, Lloyd and Taylor 1994, Kudeyarov and Kurganova 1998, Kurganova and Kudeyarov 1998, Raich et al. 2002). Temperature (soil or air) is the best predic-tor of the annual and seasonal dynamics of CO2 evolution rate of soils (Fung et al. 1987, Kätterer et al. 1998, Kirschbaum 2000, Raich et al. 2002, Perrin et al. 2003). Temperature responses of CO2 evolution rates of soils are frequently described using exponential function with a constant Q10 (Kirschbaum 1995, Winkler et al. 1996, Kätterer et
Effect of soil temperature and moisture
on СO
2
evolution rate of cultivated Phaeozem:
analysis of a long-term field experiment
V.O. Lopes de Gerenyu, I.N. Kurganova, L.N. Rozanova, V.N. Kudeyarov
Institute of Physicochemical and Biological Problems of Soil Science, RAS, Pushchino,
Moscow Region, Russia
ABSTRACT
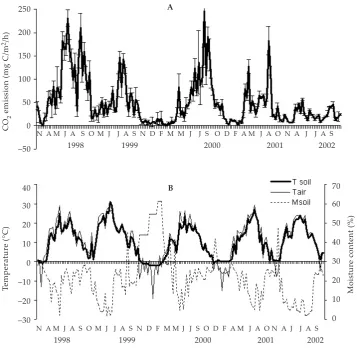
Soil temperature and moisture are the main ecological factors regulating the processes of production and emission of CO2 from soil surface. The CO2 evolution rate from cultivated clay Phaeozem (Russia, Moscow region; 54°50’N, 37°35’E) were studied under field conditions from November 1997 to October 2002. The daily mean CO2 evolution rate varied widely – from 0.9 to 246 mg C/m2/h. The total annual CO
2 flux from cultivated Phaeozem averaged
352 ± 148 g C/m2/year, the interannual variability amounted to 42%. We found significant linear trends (R = 0.46–
0.55, P < 0.001) reflecting the relationship between CO2 emission and soil temperature through the whole observation period and during spring and autumn seasons as well. The exponential equations described these relationships for the same periods more adequately than the simple linear equations (R = 0.62–0.68, P < 0.01). The temperature coeffici-ent Q10 comprised 2.3 (for the whole data set) and was essentially higher 3.2–3.6 during the spring and autumn. The correlation between CO2 evolution rate and soil moisture was insignificant for the whole period, winter, spring and autumn seasons as well. During the summer, correlation between CO2 evolution rate and soil moisture was positive and very close (R = 0.74, P < 0.001), indicating that the soil moisture content was a main factor limitative the rate of CO2 emission from soil for this period.
Keywords: CO2 evolution rate; annual and seasonal CO2 flux; cultivated Phaeozem; temperature dependence; Q10; effect of soil moisture
al. 1998, Kurganova et al. 2001, Lopes de Gerenyu et al. 2001a). However, models using a Q10 func-tion for describing the temperature dependence are adequate at confined interval of temperature (Kätterer et al. 1998, Tjoelker et al. 2001).
The aims of the present study was to quantify the annual and seasonal fluxes of CO2 from culti-vated Phaeozem and to determine the impact of soil temperature and moisture on CO2 evolution rate on the basis of long-term year-round in situ measurements.
MATERIAL AND METHODS
Site description
The experimental site was located on clay grey forest soils (Phaeozems Albic) – we cite soil names according to Russian Soil Classification and corresponding name of soils (in baskets) ac-cording to Soil Classification the FAO (Stolbovoi 2000) – 4 km west of Pushchino (Moscow region, Russia, 54°50’N, 37°35’E). This region belongs to the southern Taiga zone (coniferous forests). The mean annual air temperature is ca. +5.4°C and the mean monthly temperatures of July and January are +18°C and –6°C, respectively (Lopes de Gerenyu et al. 2001a). The annual precipitation amounts to 670 mm. Snow cover usually appears during November and stays until the end of April. The plot is an unfertilised arable soil (Ctotal 1.09%, Ntotal 0.11; рНH
2O 6.0) with winter wheat (grown from end September to early August).
CO2 emission measurements
Soil CO2 emission rates were measured by a closed chamber method over the period from November 1997 through October 2002 at 7–10 day intervals. Measurements were carried out between 9 and 11 a.m., when the current value of the soil respiration rate was approximately equal to the daily mean value (Larionova et al. 1989). The number of replicates was 3 during the cold period (November–April) and 5 during the warm period (May–October). Chamber techniques were differ-ent for each of these periods.
During the warm period steel (lightproof) cy-lindrical chambers 10 cm in diameter by 10 cm in height were used. Chambers were inserted into the soil between growing plants to a depth of 3–5 cm before the gas was sampled. Thus, the total soil respiration (root respiration + heterotrophic soil respiration) without above ground plant respiration was determined. The rise of CO2 concentrations in a chamber was determined during 45 minutes
with 15-min intervals. To reduce the temperature and gas pressure changes in a chamber during the sampling procedure, the chambers were painted with a light colour and the period of gas sample withdrawal was shortened as much as possible. During the cold snowy period (November–April), 32 × 32 cm steel bases (with water seal) were dug permanently to a depth of 20 cm into the soil and steel boxes 32 × 32 × 15 cm were inserted. To exclude disturbances from the snow cover, special sections as required built up the bases. The increase of CO2 concentrations in the chamber was measured for 135 minutes with 45-min intervals. Due to weak soil respiration and low air temperature during the cold season the pressure and temperature changes in the chambers were negligible.
The gas samples (20 cm3) were collected by a syringe, transported to the laboratory in her-metically sealed vacuumed flasks and analysed by gas chromatography. Simultaneously, soil moisture and temperature in the upper soil layer (0–5 cm) were determined.
The CO2 flux was calculated according to the following equation (Larionova et al. 1998):
F = (C – C 0) × H/t
where: F is the C-СО2 flux, mg С/m2/h; С
0 – are the initial head-space concentrations of СО2, mg С/m3; С is the head-space concentration of СО2 in time t (hour); H is the height of the head-space layer in the chamber (m).
RESULTS AND DISCUSSION
Monthly, seasonal and annual CO2 emissions
in July–August or September, when the combina-tion of hydrothermal condicombina-tions were optimal and fresh organic materials were sufficient for intensive microbial activity in the soils.
Mean monthly, mean seasonal, and mean annual CO2 fluxes from the studied soils were calculated (Table 1). Maximal CO2 fluxes from cultivated soil were observed in July–September. During the cold season, when soil was usually completely frozen, the fluxes of CO2 were very low. The CO2 emissions from agricultural soils during winter, spring, summer and autumn were 18, 61, 175 and 98 g C/m2, respectively. Total annual carbon di-oxide flux (ACDF) from cultivated Phaeozem averaged to 352 g C/m2/year, ranging from 156 to 537 g C/m2/year depending on the weather con-ditions of the year studied. Actually, the CO2 fluxes from soils can be estimated to be approximately 10% greater because the closed chamber technique was reported to give a general underestimation of ca. 10% as compared to results obtained with an open system (Rayment 2000).
Literature review showed that CO2 emission from arable Phaeozem of the Siberia region during
growing season were evaluated at 150–180 g C/m2 (Pomazkina et al. 1999). The annual CO2 flux from the similar cultivated Phaeozem (Moscow region) was estimated at 180 g C/m2/year (Larionova et al. 2001). In our opinion, the inequality between assessments cited above and our estimations caused by both a different observation regions and weather conditions. Evidently the assess-ments cited above are less objective because of shorter studied period and single measurements during the cold season. To obtain real estimations of annual and season CO2 fluxes it is necessary to carry out long-term-year-round measurements of carbon dioxide emission.
[image:3.595.122.480.376.727.2]The coefficient of temporal variation (CV) for individual monthly CO2 flux measurements ranged from 0.7 to 81% (Table 1). The highest temporal vari-ation of the CO2 flux (CV = 77–81%) was observed in September and October. As a rule, the seasonal CO2 fluxes varied less than the monthly ones. The vari-ability of CO2 fluxes for cold (November–March) and warm (April–October) periods between differ-ent observed years was 33% and 51%, respectively. The interannual variability for total annual CO2 flux
Figure 1. CO2 emission rate of cultivated Phaeozem (A), soil and air temperatures and soil moisture content (B) during 5 years of measurements
Te
m
pe
ra
tu
re
(°
C
)
40
30
20
10
0
–10
–20
–30
M
oi
st
ur
e
co
nt
en
t (
%
)
70 60
50
40
30
20
10
0 N A M J A S O M J J A S N D F M M J J S O D F A M J A O N A J J A S 1998 1999 2000 2001 2002
B
C
O2
e
m
is
si
on
(m
g
C
/m
2/h
)
A
N A M J A S O M J J A S N D F M M J J S O D F A M J A O N A J J A S 1998 1999 2000 2001 2002 250
200
150
100
50
0
was high enough and amounted to 42%. Mainly, the variability of monthly, seasonal and annual fluxes was caused by the difference in climatic conditions during the periods studied.
Share of different periods to the annual CO2 flux
The shares of individual months, calendar seasons (winter, spring, summer, autumn) and warm and cold periods to annual CO2 flux were calculated. The mean contribution from individual months to the total CO2 flux varied from 1.2% (February) to 18.1% (July). The CO2 fluxes comprised approximately 47% in summer, 26% in autumn, 21% in spring, and 6% in winter of the total CO2 emission. The contribution of the cold period (November–April) to the annual CO2 flux averaged 21% changing from 11 to 33%. So, our estimations showed that the emission of CO2 from cultivated soils during the cold period was an essential part of the annual emissions, which should be taken into account while
calculating the carbon budget for the whole year. According to other studies (Sommerfeld et al. 1993, Pajary 1995, Oechel et al. 1997, Alm et al. 1999, Zamolodchikov and Karelin 2001, Kurganova et al. 2003) the winter soil respiration has been es-timated to contribute 10% or more to the annual CO2 flux from tundra soil and 20% or more from boreal ecosystems.
The effect of soil temperature and moisture on CO2 fluxes
[image:4.595.65.533.97.463.2]In this study, we try to quantify the temperature impact on the mean CO2 fluxes from the cultivated Phaeozem during the different periods (Table 2). We found significant linear trends (R = 0.46–0.55, P < 0.001) reflecting the relationship between daily mean CO2 emission and soil temperature through the whole period of observations and during spring and autumn seasons as well. The exponential equa-tions described these relaequa-tionships for the same periods more adequately than the simple linear Table 1. Mean monthly and seasonal CO2 fluxes from cultivated Phaeozem and its contributions to total annual flux
Observation period CO2 fluxes (g C/m
2/period) Contribution (%)
mean S.D. CV (%) mean S.D. CV (%)
January 9.3 0.4 4.0 3.2 1.7 53.1
February 3.5 1.3 37.2 1.2 0.7 61.2
March 4.2 0.2 5.2 1.4 0.8 53.4
April 26.5 14.5 54.6 8.7 5.0 57.6
May 30.4 7.0 23.1 10.1 5.0 49.6
June 40.5 20.4 50.3 11.2 1.4 12.5
July 69.3 41.9 60.4 18.1 5.6 30.9
August 65.0 35.5 54.6 17.7 8.5 48.2
September 57.4 46.7 81.3 15.2 7.7 50.8
October 26.4 20.3 77.0 7.1 3.1 44.1
November 14.1 8.2 58.3 4.3 2.1 47.8
December 5.6 0.0 0.7 1.9 1.0 52.7
December–February (winter) 18.4 0.9 5.0 6.3 3.4 53.3
March–May (spring) 61.1 15.6 25.5 20.1 9.5 46.9
June–August (summer) 174.8 87.4 50.0 47.0 12.8 27.2
September–October (autumn) 97.9 66.8 68.2 26.6 9.1 34.1
November–April (cold) 63.2 20.9 33.0 20.7 9.8 47.2
May–October (warm) 289.0 146.5 50.7 79.3 9.8 12.3
equations (R = 0.62–0.68, P < 0.01). The tempera-ture coefficient Q10 comprised 2.3 (for the whole data set) and was essentially higher 3.2–3.6 during the spring and autumn. The correlation between CO2 evolution rate and soil moisture content was insignificant for the whole period and winter, spring and autumn seasons as well. During the summer correlation between CO2 evolution rate and soil moisture was positive and very close (R = 0.74, P < 0.001), indicating that the soil moisture content was a main factor limiting the rate of CO2 emission from the soil for this period.
We found significant linear trends (R = 0.59, P < 0.001) reflecting the relationship between mean monthly CO2 emission rate and mean monthly soil temperature (Table 2). The obtained simple models will allow us to estimate CO2 fluxes from soils using mean daily and mean monthly soil temperatures.
To assess the influence of soil temperature on CO2 evolution rate more accurately, the mean daily values of CO2 fluxes were grouped into classes of soil temperature (Ts, step 5°C) and furthermore subdivided into classes of soil moisture (Ms, step 10%). This procedure allowed us to find the combinations of soil temperature and moisture at which CO2 evolution rate was highest. We found
that the largest CO2 emission from the cultivated Phaeozem was revealed at intervals Ts = 10–20°C. Optimal soil moisture was 50–70% of maximal water holding capacity (WHC).
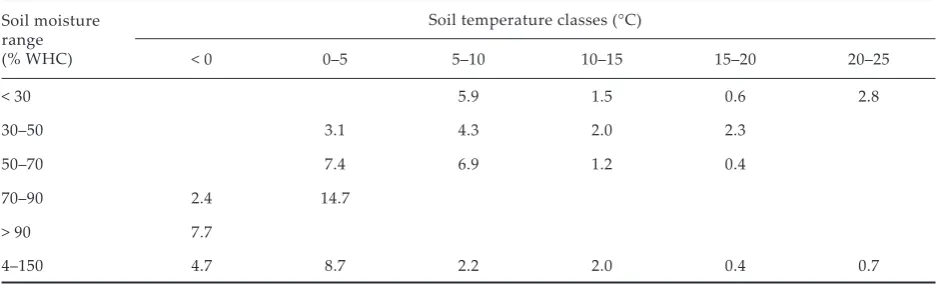
[image:5.595.64.531.110.216.2]The Q10 values have been shown to vary with soil temperature and moisture content (Table 3). As a rule, Q10 values were maximal (7.7–14.7) at low tem-peratures (< 10°C) and decreased with the increase of soil temperature. Schleiser (1982), Kirschbaum (1995, 2000) and Kä�erer et al. (1998) also reported that Q10 values were higher at low temperatures (< 5°C). Possibly, this variation in Q10 values is due to temperature optima, which can differ in time and space between the microbial community (Kä�erer et al. 1998). Kirschbaum (1995) supposed that the actual decomposition rate might not be the highest at the highest temperatures. Higher Q10 values at lower temperatures probably indicate low-temperature thresholds being reached that lead to inhibition of some ensymatic reactions (Kirschbaum 2000). To give an actual prediction of decomposition rates, it is necessary to know the soil water content through-out the year, and the dependence of decomposition rates on the soil water content. Kätterer et al. (1998) concluded that Q10 function is more adequate for describing temperature dependence for the 5–35°C Table 2. Coefficients of correlation (R), Q10 values and regression models, describing the relationship between mean daily/monthly CO2 emission rate (Ed/Em, mg С/m2/h), mean daily/monthly soil temperature (T
d/Tm) and
moisture content (Md) for the different period
Observation period Parameters R Linear regression model Q10 n*
Whole period (5 years)
Daily emission – temperature (Td) 0.46 Ed = 2.8Td + 21 2.29 170 Monthly emission – temperature (Tm) 0.59 Em = 3.2Tm + 16 2.45 49 Spring Daily emission – temperature (Td) 0.54 Ed = 2.2Td + 16 3.15 42 Autumn Daily emission – temperature (Td) 0.55 Ed = 5.6Td + 11 3.60 53 Summer Daily emission – moisture content (Md) 0.74 Ed = 2.1Md + 5.4 – 56
*n = number of observations
Table 3. Q10-values of СО2 emission of different classes of soil temperature and moisture for cultivated soil
Soil moisture range (% WHC)
Soil temperature classes (°С)
< 0 0–5 5–10 10–15 15–20 20–25
< 30 5.9 1.5 0.6 2.8
30–50 3.1 4.3 2.0 2.3
50–70 7.4 6.9 1.2 0.4
70–90 2.4 14.7
> 90 7.7
[image:5.595.63.537.621.763.2]interval. Thus, in order to use the Q10 function for describing the dependence of CO2 evolution rate on temperature, it is necessary to range the data according to Ts and Ms values.
Acknowledgements
We would like to thank researches D. Sapronov and T. Myaksnina for providing of gas samples collection during November 1999–July 2002.
REFERENCES
Alm J., Saarnio S., Nykanen H., Silvova J., Martikainen P. (1999): Winter CO2, CH4 and N2O fluxes on some natu-ral and drained boreal peatlands. Biogeochemistry, 44: 163–186.
Fung I.Y., Tucker C.J., Prentice K.C. (1987): Application of advanced very high resolution radiometer vegetation index to study atmosphere-biosphere exchange of CO2. Journal of Geophysical Research, 93: 2999–3015. Kätterer T., Reichstein M., Andren O., Lomander A.
(1998): Temperature dependence of organic matter decomposition: a critical review using literature data analyzed with different model. Biology and Fertility of Soils, 27: 258–262.
Kirschbaum M.U.F. (1995): The temperature dependence of soil organic matter decomposition, and the effect of global warming on soil organic C storage. Soil Biology and Biochemistry, 27: 753–760.
Kirschbaum M.U.F. (2000): Will changes in soil organic carbon act as a positive or negative feedback on global warming. Biogeochemistry, 48: 21–51.
Kovalenko C.G., Ivarson K.S., Cameron D.R. (1978): Ef-fect of moisture content, temperature and nitrogen fertilization on carbon dioxide evolution from field soils. Soil Biology and Biochemistry, 10: 417–423. Kudeyarov V.N., Kurganova I.N. (1998): Carbon
diox-ide emissions and net primary production of Russian terrestrial ecosystems. Biology and Fertility of Soils, 27: 246–250.
Kurganova I.N., Kudeyarov V.N. (1998): The assessment of carbon dioxide flux from Russian south taiga soils. Eurasian Soil Science, 31: 954–965.
Kurganova I.N., Lopes-de-Gerenyu V.O., Rozanova L.N., Sapronov D.V., Myakshina T.N., Kudeyarov V.N. (2003): Annual and seasonal CO2 fluxes from Russian southern taiga soils. Tellus, 55B: 338–344.
Kurganova I.N., Lopes-de-Gerenyu, Sapronov D.V. (2001): CO2 Emissions from Russian South-taiga soils as affected by temperature and land use. In: 6th International Carbon Dioxide Conference, Extended
Abstracts, Sendai, Japan, 1: 540–543.
Larionova A.A., Rozanova L.N., Dyemkina T.S., Yev-dokimov I.V., Blagodatsky S.A. (2001): Annual CO2
emission from gray forest soils. Eurasian Soil Science, 1: 72–80.
Larionova A.A., Rozanova L.N., Samoilov T.I. (1989): Dynamics of gas exchange in the profile of a gray forest soil. Soviet Soil Science, 3: 104–110.
Larionova A.A., Yermolaev A.M., Blagodatsky S.A., Ro-zanova L.N., Yevdokimov I.V., Orlinsky D.B. (1998): Soil respiration and carbon balance of gray forest soils as affected by land use. Biology and Fertility of Soils, 27: 251–257.
Lloyd J., Taylor J.A. (1994): On the temperature de-pendence of soil respiration. Functional Ecology, 8: 315–323.
Lomander A., Kätterer T., Andren O. (1998): Carbon dioxide evolution from top- and subsoil as affected by moisture and constant and fluctuation temperature. Soil Biology and Biochemistry, 30, 14: 2017–2022. Lopes de Gerenyu V.O., Kurganova I.N., Rozanova L.N.,
Kudeyarov V.N. (2001a): Annual emission of carbon dioxide from soils of the Southern taiga zone of Rus-sia. Eurasian Soil Science, 34: 931–944.
Lopes-de-Gerenyu V.O., Kurganova I.N., Sapronov D.V. (2001b): Carbon dioxide fluxes from arable soils as affected by temperature and moisture. In: I. World Congress on Conservation Agriculture, Extend Ab-stract, Madrid, 2: 109–113.
Oechel W., Vourlitis G., Hastings S. (1997): Cold season CO2 emissions from arctic soils. Global Biogeochem-istry Cycles, 11: 163–172.
Pajary B. (1995): Soil respiration in a poor upland site of Scots pine stand subject to elevated temperatures and atmospheric carbon concentration. Plant and Soil, 168–169: 563–570.
Perrin D., Laitat E., Yernaux M., Mezoesy Q., Aubinet M. (2003): Temporal and spatial changes in the soil CO2 efflux in a mixed temperate forest (Vielsalm, Belgium). Comparative biochemistry and Physiology: SEB Ab-stracts, 134, 3: 191.
Pomazkina L.V., Lubnina E.V., Zorina S.Yu., Kotova L.G., Khortolomey I.V. (1996): Dynamic of CO2 emission from gray forest soil in the forest-steepe of Transbaikal region. Eurasian Soil Science, 12: 1454–1459.
Raich J.W., Potter C.S., Bhagavatti D. (2002): Interannual variability in global soil respiration, 1980–94. Global Change Biology, 8: 800–812.
Raich J.W., Schlesinger W.H. (1992): The global carbon dioxide flux in soil respiration and its relationship to vegetation and climate. Tellus, 44B: 81–89.
Rayment M.V. (2000): Closed chamber systems under-estimate soil CO2 efflux. European Journal of Soil Science, 51: 107–110.
Rustad L.E., Huntington T.G., Boone R.D. (2000): Controls on soil respiration: Implication for climate change. Biogeochemistry, 48: 1–6.
Sommerfeld R.A., Mosier A.R., Musselman R.S. (1993): CO2, CH4 and N2O flux through a Wyoming snow-park and implications for global budgets. Nature, 361: 140–142.
Stolbovoi V. (2000): Soils of Russia: Correlated with the revised legend of the FAO soil map of the world and world reference base for soil resources. International Institute for Applied System Analysis, Laxenburg, Austria: 1–113.
Swift M.J., Heal O.W., Anderson J.M. (1979): Decompo-sition in terrestrial ecosystems. Blackwell Scientific Publication, Oxford.
Tjoelker M.G., Oleksyn J., Reich P.B. (2001): Model-ling respiration of vegetation: evidence for a general temperature-dependent Q10. Global Change Biology, 7: 223–230.
Winkler J.P., Cherry R.S., Schlesinger W.H. (1996): The Q10 relationship of microbial respiration in a tem-perate forest soil. Soil Biology and Biochemistry, 28: 1067–1072.
Zamolodchikov D.G., Karelin D.V. (2001): An empiri-cal model of carbon fluxes in Russian tundra. Global Change Biology, 7: 147–161.
Received on November 27, 2003
ABSTRAKT
Vliv teploty a vlhkosti půdy na produkci СO2 na obdělávané černici v dlouhodobém polním pokuse
Teplota a vlhkost půdy jsou hlavní ekologické faktory regulující procesy produkce a emise CO2 z povrchu půdy. Úroveň produkce CO2 z obdělávané jílovité černice (Rusko, Moskevská oblast; 54°50’S, 37°35’V) byla studována v polních podmínkách od listopadu 1997 do října 2002. Denní průměrné hodnoty produkce CO2 se pohybovaly v širokém rozpětí od 0,9 to 246 mg C/m/2/h. Celková roční produkce CO
2 na obdělávané černici byla v průměru
352 ± 148 g C/m2/rok, meziroční variabilita činila 42%. Prokázali jsme signifikantní lineární závislost (R = 0,46–0,55, P < 0,001) mezi emisemi CO2 a teplotou půdy nejen během celého experimentálního období, ale i v jarním a podzim-ním období. Exponenciální rovnice vystihovala tento vztah přesněji než jednoduchý lineární vztah (R = 0,62–0,68, P < 0,01). Teplotní koeficient Q10 dosáhl hodnoty 2,3 (pro celý soubor), v jarním a podzimním období byl významně vyšší (3,2–3,6). Korelace mezi produkcí CO2 a půdní vlhkostí byla za celé období nevýznamná obdobně jako v zim-ním, jarním a podzimním období. V letním období byla korelace mezi produkcí CO2 a půdní vlhkostí pozitivní a velice úzká (R = 0,74, P < 0,001), což indikuje, že půdní vlhkost byla hlavním faktorem limitujícím úroveň emisí CO2 z půdy v tomto období.
Klíčová slova: produkce CO2;roční a sezonní produkce CO2; černice; teplotní závislost; Q10; vliv půdní vlhkosti
Corresponding author:
I.N. Kurganova, Institute of Physicochemical and Biological Problems of Soil Science, RAS, Pushchino, Moscow region, 142290, Russia