D uring the past half-century, food production has increased obviously, owing to nitrogen (N) fertilizers (Dobermann and Cassman 2005). However, crops production would not increase unlimitedly as ris-ing applied N, worldwide nitrogen use efficiency (NUE) is approximately 33% (Raun and Johnson 1999). More attention was paid to the increasing N application rationally (Galloway et al. 2004). Since the 1980s, N recommendation for maize production in China relied extensively on a yield-based strategy, developed to represent regional averages. I n recent years, i ssues for maize production such as excessive N application and ineffective application stage strat-egies have become common in the pursuit of high yield. As a result, overall efficiency has decreased. In 2004 the domestic N recovery efficiency of maize farmland was just 26.1% (Ma et al. 2009). Nutrient use efficiencies of the major cereal crops was obvi-ously much lower than the world average, which is due to the excessive use of chemical fertilizer and the ignorance of nutrients contribution from the cultivated techniques and the soil (Zhang et al. 2008).
The average yield of summer maize in the Shandong Province was 6586 kg/ha in 2009. S ince 2007 the yield of small area land has exceeded 15 t/ha in more a reas, but the N rate w as more than 457.9 kg/ha (Zhang et al. 2008). However, high N rate in exchange for high yield causes wasted re-sources and environmental pollution. In addition, the production process typically uses a method of one-off N applied at V6, leading to wilting at the seedling stage and decreasing the yield or the NUE. So it is necessary to m anage N a pplication for summer maize scientifically (Hawkins et al. 2007). The yield may be increased by using split application method under irrigated conditions (Randall et al. 2003, Gehl et al. 2005). Cui et al. (2008) reported that improved soil N manage-ment based on the minimum N requiremanage-ment can be applied to summer maize production in the North China Plain.
The objective of this paper was to study the ef-fects of variable N application stages and ratios on the uptake and translocation of N in high-yield
Effects of nitrogen application stage on grain yield
and nitrogen use efficiency of high-yield summer maize
P. Lü, J.W. Zhang, L.B. Jin, W. Liu, S.T. Dong, P. Liu
State Key Laboratory of Crop Biology and College of Agronomy, Shandong Agricultural
University, Tai’an, Shandong, P.R. China
ABSTRACT
This study aims to explore the optimum nitrogen (N) application method by analyzing effects of variable N ap-plication stages and ratios on the N absorption and translocation of high-yield summer maize (DH661). The study included field experiments and 15N isotopic dilutions for pot experiments. Results showed that the yield was not
increased in a one-off N application at the jointing stage. The uptake of fertilizer-derived N in the grain increased with the increasing of N applied t imes. Compared to a single or double application, total N uptake (Nup) and bio-mass increased significantly by supplying N at the six-leaf stage (V6), ten-leaf stage (V10) and 10 days after anthesis in ratios of 3:5:2 and 2:4:4. The fertilizer-derived recovery rates were 67.5% and 78.1%, respectively. The uptake and utilization of fertilizer-derived N was enhanced by increasing the recovery rate of N supplied after anthesis, and reducing the absorption of soil-derived N. Therefore, the 2:4:4 application ratios was the optimal N application method.
Keywords: N application method; 15N isotope tracer; N uptake and translocation; soil N; N fertilizer
summer maize, and to explore the optimal N ap-plication method.
MATERIAL AND METHODS
Plant material and experimental site. The ex-periment was done in the test farm of the Shandong Agricultural University (36°09'N, 117°09'E). The field experiment was done in 2008 and 2009. The pot experiment was done in 2009, and the dimen-sions of a pot are 37 cm (diameter) × 50 cm (height). Each pot was composed topsoil (0–20 cm deep),
blended, cribrated and mixed with river sand in a 5:1 volume ratio. The soil nutrients and climatic conditions were listed in Table 1. Denghai661 (DH661) was used as experimental material. The previous crop was winter wheat, sown on June 12th and harvested on October 5th.
Experimental design
Field experiment. Planting density was 75 000 plants/ha, with equal row spacing of 60 cm. The
each plot area was 100 m2, including 3 replicate test areas arranged randomly. The amount of ap-plied N was 360 kg/ha. Urea, 46% N content, was used as the N fertilizer. 857 kg/ha of triple super-phosphate and 400 kg/ha of KCl were applied at the pre-sowing and V6, respectively.
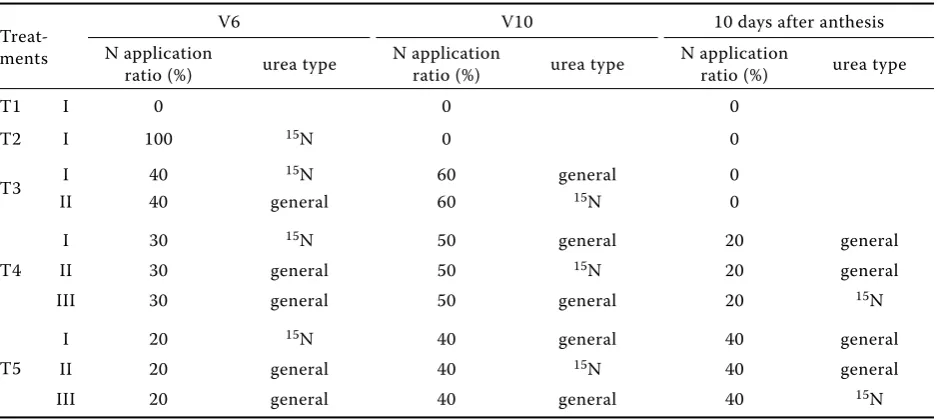
Pot experiment. The pots were filled 30 days before sowing, sunk steadily and then placed in square pits which were 45 cm deep. Distance be-tween plants was 37 cm, with 60 cm row spacing. Guard rows were planted around the pits. The amount of applied N was 4.8 g/plant (which is equivalent to 360 kg N/ha in the field experiment planted by 75 000 plants/ha), and the N fertilizer used was 15N urea (the 15N content is 10.41%). In addition, 11.4 g/plant of triple superphosphate and 5.3 g/plant KCl were applied at the pre-sowing and V6, respectively. The N application stages and ratios are shown in Table 2.
[image:2.595.64.532.75.161.2]Analytical measurements. Three plant samples were taken continuously from each treatment at the V6, V10, tasseling stage (VT) and maturity stage (R6). The root was preserved after rinsing clean. The whole plants were preserved at V6, while plants were separated into leaf and stem sheath
Table 1. The test soil nutrients content before sowing and the climatic conditions during the growing period
Soil type Total N (g/kg)
Alkaline hydrolysable
N (mg/kg)
Rapidly available P (mg/kg)
Exchange-able K (mg/kg)
Organic matter
(g/kg)
Rainfall (mm)
Average temperature
(°C)
Sunlight (h)
Field 08 brown soil 0.94 86.9 57.4 113.45 9.21 459.1 23.8 813.0
09 brown soil 0.95 86.5 62.4 109.36 9.21 463.8 23.9 809.2
Pot 09 brown soil 0.61 64.5 47.8 102.19 0.85 463.8 23.9 809.2
Table 2. Nitrogen application stages and ratios of different treatments
Treat-ments
V6 V10 10 days after anthesis
N application
ratio (%) urea type
N application
ratio (%) urea type
N application
ratio (%) urea type
T1 I 0 0 0
T2 I 100 15N 0 0
T3 I 40
15N 60 general 0
II 40 general 60 15N 0
T4
I 30 15N 50 general 20 general
II 30 general 50 15N 20 general
III 30 general 50 general 20 15N
T5
I 20 15N 40 general 40 general
II 20 general 40 15N 40 general
III 20 general 40 general 40 15N
[image:2.595.64.533.537.747.2]at V10 and VT, and were divided into leaf, stem sheath, ear bract, the cob, and the grain at R6. After dried at 85°C, plant samples were pulverized and determined after weighing. The yield was es-timated at maturity. Total N was measured by th e continuous flow analytical system of AutoAnalyzer 3-AA3 (Isoprime, Manchester, UK) after sulfuric aid-hydrogen peroxide digestion of plant sample. 15N content was measured by an Is oPrime100
stable isotope analyzer (Camin et al. 2007). The determination procedures as follows: weighing 5.00 mg of pulverized plant samples, packed up by the tinfoil paper and placed in the automatic sample feeding disc, burned fully into the gas in combus-tion tube, the gas was imported to the measuring tank and determined by standard sample of 15N.
Evaluation of nitrogen uptake efficiency. The following parameters were derived according to Moll et al. (1982):
N Harvest Index (NHI, %) = Nup by grain/total Nup by plant × 100;
N Agriculture Efficiency (NAE, g grain/g Nf) = (grain yield with ad ded N – grain yield with no N)/N ap plication amount;
N recovery efficiency (NRE, %) = (plant N absorp-tion am ount wi th ad ded N – plant N absorpabsorp-tion amount with no N)/N a pp lication amount × 100; N partial factor productivity (NPFP, g grain/g Nf) = plant yield with added N app lication/N app lication amount;
N proportion derived from fertilizer (NDFF, %) = 15N atom percentage excess in plant (%)/15N atom percentage excess in fertilizer (%) × 100; N amount derived from fertilizer (NDFF, mg) =
dry weight of organ (g) × total N in organ (%) × NDFF (%) × 1000/104;
N distribution rate (NDR, %) = NDFF of organ (mg)/NDFF of plant (mg) × 100;
N amount derived from soil (NDFS, mg) = total N of plant (mg) – NDFF (mg);
N proportion derived from soil (NDFS, %) = 100% – NDFF (%);
N recovery rate (NRR, %) = NDFF of plant (mg)/N application amount (mg) × 100;
N translocation efficiency (NTE, %) = N trans-location in vegetative organs/Nup by vegetative organs at anthesis × 100;
N assimilation amount after anthesis (NAAA, kg/ ha) = Nup by grains at maturity stage – N trans-location in vegetative organs.
Statistical analysis. All data were analyzed using LSD tests, within the SPSS 16.0 Statistical Software Package. Results were considered significant in all statistical calculations where P ≤ 0.05.
RESULTS AND DISCUSSION
Yield, NHI, NAE and NPFP. Results of the two-year field experiment are consistent (Table 3). Yield of one-off applied N at V6 (T2) was not increased significantly compared to T1. The yield improved with an increasing N application ratio (T3 lowest, T5 highest). In the field experiment, the yield of T5 increased by 15.3%, 14.2% and 7.1% compared to T1, T2 and T3, respectively. In the pot experiment, the yield increased compared to T1, T2 and T3 by 58.2%, 56.9% and 27.6%. Additionally, the NHI, the NAE and NPFP were influenced, and marked by T5 > T4 > T3 > T2 remarkably. So splitting applications of N could significantly increase the yield, the NHI, the NAE and the NPFP of DH661. In 2 006 and 2007, the average yield of the top three in Corn High Yield Contest in America were 17 297.2 kg/ha and 18 749.5 kg/ha. The average applied N rate was 284.5 kg/ha and 300 kg/ha, 51.85% of which was applied before sowing and supplied several times during the growing period. So the preferable method was to apply N in 3:5:2 and 2:4:4 ratios at the V6, V10 and grains filling stage, respectively.
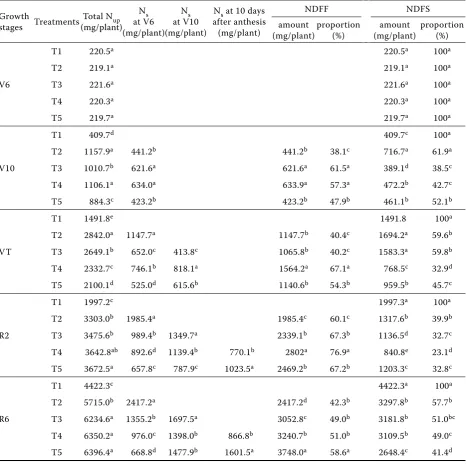
N uptake and distribution from different sources. The whole plant Nup of T2 and T3 at V10 and VT were higher than the other treatments. At VT, Nup decreased with the increasing applied N ratio (T2 > T3 > T4 > T5). After VT, Nup of T4 and T5 were significantly increased. Compared to T1 and T2, total N of T5 was increased by 44.6% and 11.9%. Compared to T2, T3 and T4, NDFF of T5 was enhanced by 55.1%, 22.8%, and 15.7%, respectively. Accordingly, the proportion of NDFF in the total Nup of T5 was also remarkably higher, but NDFS decreased (T2 > T3 > T4 > T5), as shown in Table 4.
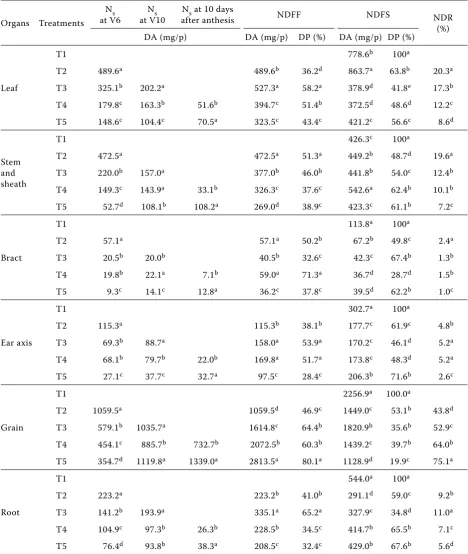
The Nup of the grains, leaf blade, stem sheath, root system, ear axis and the bud leaf at maturity decreased. With an increasing N application ratio, NDFF reduced significantly in the leaf blade and in the stem sheath, but increased in the grain. NDR of the grain in T5 was higher than in other treatments, compared to T2, T3, and T4, NDFF of T5 increased by 165.5%, 74.2% and 35.8%, the grain NDR of T5 was increased by 31.2%, 22.2% and 11.1%, respectively (Table 5).
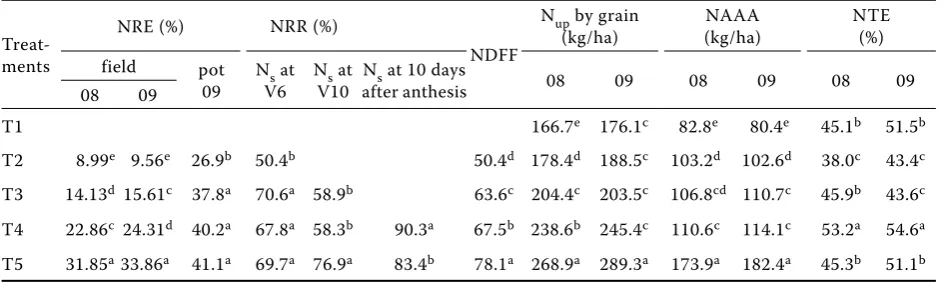
rate and longer duration of active growing period. The results showed that splitting applications of N could increase the total Nup of the plant by en-hancing the NDFF, and increasing the grain NDR. N recovery efficiency and N recovery rate. The NRE of T5 in the field experiment was improved by 23.6% and 18.0% compared to T2 and T3, re-spectively. For the pot experiment, compared to T2, the NRE of T3, T4, and T5 was increased by 10.8%, 13.2% and 14.2%. Applying N at different stages had significant impacts on the recovery rate of NDFF. The NRR of T5 was higher than other treatments, increasing by 27.7%, 14.5% and 10.6% compared to T2, T3 and T4.
The Nup after V10 in high-yield varieties ac-counted for over 60% of the total uptake (Subedi and Ma 2005). N deficiency reduced the yield and Nup in later stages of development (Rajcan and Tollenaar 1999). The N requirement of grain was the main force for uptake at the grain filling stage. The average NRR at the V6 and V10 were 64.6% and 64.7%, and 86.9% after anthesis. Therefore, the higher NRR after anthesis led to higher overall NRR in T4 and T5 (Table 6).
[image:4.595.65.532.74.538.2]Nitrogen translocation efficiency. The grain filling stage is a crucial stage not only for grain formation but also for the N absorption and trans-port in the plant. Osaki et al. (1991) retrans-ported that Table 4. Effects of N application stage on Nup from different source
Growth
stages Treatments
Total Nup (mg/plant)
Ns at V6 (mg/plant)
Ns at V10 (mg/plant)
Ns at 10 days after anthesis (mg/plant)
NDFF NDFS
amount (mg/plant)
proportion (%)
amount (mg/plant)
proportion (%)
V6
T1 220.5a 220.5a 100a
T2 219.1a 219.1a 100a
T3 221.6a 221.6a 100a
T4 220.3a 220.3a 100a
T5 219.7a 219.7a 100a
V10
T1 409.7d 409.7c 100a
T2 1157.9a 441.2b 441.2b 38.1c 716.7a 61.9a
T3 1010.7b 621.6a 621.6a 61.5a 389.1d 38.5c
T4 1106.1a 634.0a 633.9a 57.3a 472.2b 42.7c
T5 884.3c 423.2b 423.2b 47.9b 461.1b 52.1b
VT
T1 1491.8e 1491.8 100a
T2 2842.0a 1147.7a 1147.7b 40.4c 1694.2a 59.6b
T3 2649.1b 652.0c 413.8c 1065.8b 40.2c 1583.3a 59.8b
T4 2332.7c 746.1b 818.1a 1564.2a 67.1a 768.5c 32.9d
T5 2100.1d 525.0d 615.6b 1140.6b 54.3b 959.5b 45.7c
R2
T1 1997.2c 1997.3a 100a
T2 3303.0b 1985.4a 1985.4c 60.1c 1317.6b 39.9b
T3 3475.6b 989.4b 1349.7a 2339.1b 67.3b 1136.5d 32.7c
T4 3642.8ab 892.6d 1139.4b 770.1b 2802a 76.9a 840.8e 23.1d
T5 3672.5a 657.8c 787.9c 1023.5a 2469.2b 67.2b 1203.3c 32.8c
R6
T1 4422.3c 4422.3a 100a
T2 5715.0b 2417.2a 2417.2d 42.3b 3297.8b 57.7b
T3 6234.6a 1355.2b 1697.5a 3052.8c 49.0b 3181.8b 51.0bc
T4 6350.2a 976.0c 1398.0b 866.8b 3240.7b 51.0b 3109.5b 49.0c
T5 6396.4a 668.8d 1477.9b 1601.5a 3748.0a 58.6a 2648.4c 41.4d
grain N was partly derived from the N accumulated in the stem and leaves before male tetrad stage and partly redirected from the root system after flowering. With an increasing N application ratio in the field experiment, NAAA of grain increased at maturity. Total Nup in the grain of T5 was in-creased by 62.8%, 52.1% and 36.8%, compared to
Table 5. Nup efficiency from different sources and N distribution rate (NDR) at maturity
Organs Treatments Ns at V6
Ns at V10
Ns at 10 days
after anthesis NDFF NDFS NDR
(%) DA (mg/p) DA (mg/p) DP (%) DA (mg/p) DP (%)
Leaf
T1 778.6b 100a
T2 489.6a 489.6b 36.2d 863.7a 63.8b 20.3a
T3 325.1b 202.2a 527.3a 58.2a 378.9d 41.8e 17.3b
T4 179.8c 163.3b 51.6b 394.7c 51.4b 372.5d 48.6d 12.2c
T5 148.6c 104.4c 70.5a 323.5c 43.4c 421.2c 56.6c 8.6d
Stem and sheath
T1 426.3c 100a
T2 472.5a 472.5a 51.3a 449.2b 48.7d 19.6a
T3 220.0b 157.0a 377.0b 46.0b 441.8b 54.0c 12.4b
T4 149.3c 143.9a 33.1b 326.3c 37.6c 542.6a 62.4b 10.1b
T5 52.7d 108.1b 108.2a 269.0d 38.9c 423.3c 61.1b 7.2c
Bract
T1 113.8a 100a
T2 57.1a 57.1a 50.2b 67.2b 49.8c 2.4a
T3 20.5b 20.0b 40.5b 32.6c 42.3c 67.4b 1.3b
T4 19.8b 22.1a 7.1b 59.0a 71.3a 36.7d 28.7d 1.5b
T5 9.3c 14.1c 12.8a 36.2c 37.8c 39.5d 62.2b 1.0c
Ear axis
T1 302.7a 100a
T2 115.3a 115.3b 38.1b 177.7c 61.9c 4.8b
T3 69.3b 88.7a 158.0a 53.9a 170.2c 46.1d 5.2a
T4 68.1b 79.7b 22.0b 169.8a 51.7a 173.8c 48.3d 5.2a
T5 27.1c 37.7c 32.7a 97.5c 28.4c 206.3b 71.6b 2.6c
Grain
T1 2256.9a 100.0a
T2 1059.5a 1059.5d 46.9c 1449.0c 53.1b 43.8d
T3 579.1b 1035.7a 1614.8c 64.4b 1820.9b 35.6b 52.9c
T4 454.1c 885.7b 732.7b 2072.5b 60.3b 1439.2c 39.7b 64.0b
T5 354.7d 1119.8a 1339.0a 2813.5a 80.1a 1128.9d 19.9c 75.1a
Root
T1 544.0a 100a
T2 223.2a 223.2b 41.0b 291.1d 59.0c 9.2b
T3 141.2b 193.9a 335.1a 65.2a 327.9c 34.8d 11.0a
T4 104.9c 97.3b 26.3b 228.5b 34.5c 414.7b 65.5b 7.1c
T5 76.4d 93.8b 38.3a 208.5c 32.4c 429.0b 67.6b 5.6d
DA – distribution amount; DP – distribution proportion; Ns – N supplied; NDFF – N proportion derived from fertilizer; NDFS – N amount derived from soil
Corresponding author:
Prof. Dr. Zhang Jiwang, Shandong Agricultural University, State Key Laboratory of Crop Biology and College of Agronomy, Tai’an, Shandong, P.R. China
e-mail: [email protected]
Therefore, N supply should be increased after anthesis to promote overall Nup in the grain.
In summary, splitting applications of N could increase N absorbed by the plant and the grain, the NUE, the uptake of fertilizer-derived N, and reduce the consumption of N in the soil. Therefore, the 2:4:4 application ratio is the optimal N appli-cation method for DH661.
REFERENCES
Camin F., Bontempo L., Heinrich K., Horacek M., Kelly S.D., Schlicht C., Thomas F., Monahan F.J., Hoogewerff J., Rossmann A. (2007): Multi-element (H, C, N, S) stable isotope character-isticsof lamb meat from different European regions. Analytical and Bioanalytical Chemistry, 389: 309–320.
Cui Z.L., Chen X.P., Miao Y.X., Zhang F.S., Sun Q.P., Schroder J. (2008): On-farm evaluation of the improved soil Nmin–based nitrogen management for summer maize in North China Plain. Agronomy Journal, 100: 517–525.
Dobermann A., Cassman K.G. (2005): Cereal area and nitrogen use efficiency are drivers of future nitrogen fertilizer consump-tion. Science in China Series C, 48: 745–758.
Galloway J.N., Dentener F.J., Capone D.G., Boyer E.W., Howarth R.W., Seitzinger S.P., Asner G.P., Cleveland C.C., Green P.A., Holland E.A., Karl D.M., Michaels A.F., Porter J.H., Townsend A.R. (2004): Nitrogen cycles: Past, present, and future. Bio-geochemistry, 70: 153–226.
Gehl R.J., Schmidt J.P., Maddux L.D., Gordon W.B. (2005): Corn yield response to nitrogen rate and timing in sandy irrigated soils. Agronomy Journal, 97: 1230–1238.
Hawkins J.A., Sawyer J.E., Barker D.W., Lundvall J.P. (2007): Us-ing rela tive chlorophyll meter values to determine nitrogen application rates for corn. Agronomy Journal, 99: 1034–1040. Ma W.Q., Li J.H., Ma L., Wang F.H., Sisák I., Cushman G., Zhang
F.S. (2009): Nitrogen flow and use efficiency in production and utilization of wheat, rice, and maize in China. Agricultural Systems, 99: 53–63.
Moll R.H., Kamprath E.J., Jackson W.A. (1982): Analysis and interpretation of factors which contribute to efficiency of nitrogen utilization. Agronomy Journal, 74: 562–564. Osaki M., Shinano T., Tadano T. (1991): Redistribution of carbon
and nitrogen compounds from the shoot to the harvesting or-gans during maturation in field crops. Soil Science and Plant Nutrition, 37: 117–128.
Rajcan I., Tol lenaar M. ( 1999): Source: sink r atio and leaf senes-cence in maize: II. Nitrogen metabolism during grain filling. Field Crops Research, 60: 255–265.
Randall G.W., Vetsch J.A., Huffman J.R. (2003): Corn production on a subsurface-drained mollisol as affected by time of nitrogen application and nitrapyrin. Agronomy Journal, 95: 1213–1219. Raun W.R., Johnson G.V. (1999): Improving nitrogen use efficiency
for cereal production. Agronomy Journal, 91: 357–363. Subedi K.D., Ma B.L. (2005): Nitrogen uptake and partitioning in
stay-green and leafy maize hybrids. Crop Science, 45: 740–747. Zhang F.S., Wang J.Q., Zhang W.F., Cui Z.L., Ma W.Q., Chen X.P., Jiang R.F. (2008): Nutrient use efficiencies of major cereal crops in China and measures for improvement. Acta Pedologica Sinica, 45: 916–924. (In Chinese)
[image:6.595.63.536.87.228.2]Received on September 7, 2011
Table 6. Effects of N application stage on N recovery efficiency (NRE), N recovery rate (NRR), N assimilation amount after N assimilation amount after anthesis (NAAA) and N translocation efficiency (NTE)
Treat-ments
NRE (%) NRR (%)
NDFF
Nup by grain (kg/ha)
NAAA (kg/ha)
NTE (%)
field pot 09
Ns at V6
Ns at V10
Ns at 10 days
after anthesis 08 09 08 09 08 09
08 09
T1 166.7e 176.1c 82.8e 80.4e 45.1b 51.5b
T2 8.99e 9.56e 26.9b 50.4b 50.4d 178.4d 188.5c 103.2d 102.6d 38.0c 43.4c
T3 14.13d 15.61c 37.8a 70.6a 58.9b 63.6c 204.4c 203.5c 106.8cd 110.7c 45.9b 43.6c
T4 22.86c 24.31d 40.2a 67.8a 58.3b 90.3a 67.5b 238.6b 245.4c 110.6c 114.1c 53.2a 54.6a