The position and importance of the trade sphere as one of the sectors of national economy is more and more increasing and strengthening. Surveys in the Member States of the European Union in their national economies can serve as a confirmation of
this fact. Especially in the more advanced countries we can find a relatively high share of trade in the macro-economic indicators, such as gross domestic product, number of persons employed or number of enterprises. however, it is necessary to mention
Agricultural and food wholesale and retail trade
in the intra-community trade
Velkoobchod a maloobchod se zemědělskými a potravinářskými
produkty v intrakomunitárním obchodu
M. Záboj
Department of Marketing and Trade, Faculty of Business and Economics,
Mendel University of Agriculture and Forestry, Brno, Czech Republic
Abstract: The paper focuses on the evaluation of the contemporary situation of two economic sectors in the frame of the European Union, namely the wholesale and retail of agricultural and food products. For these industries, the structural profile with the indicators of turnover, value added and employment was elaborated. hereafter the costs, productivity and profitability indicators ranking of the top 5 Member States were compared to the EU-25 averages. After a 3.1% increase in the turnover index in 2000, the evolution of sales for the agricultural wholesaling sector recorded a series of small increases and decreases in the turnover, ranging from – 0.6% in 2002 to 1.5% in 2004. Between 2000 and 2005, the agricultural who-lesaling sector generally recorded a slower rate of expansion for turnover than the wholesale trade average. The specialised store food retailing sector generated EUr 120.4 billion of turnover in 2003. The wealth creation of the specialised in-store food retailing was valued at EUr 23.8 billion; equivalent to 6.5% of the retail trade and repair total, while this activity employed 1.4 million persons, some 9.0% of the retail trade and repair workforce. half (49.9%) of the turnover in the spe-cialised in-store food retailing sector in the EU was generated by enterprises selling fruit, vegetables, meat, fish or bakery products.
Key words: trade, wholesale, retail, European Union, turnover, value added, costs, productivity, profitability
Abstrakt: Příspěvek se zabývá hodnocením současného stavu dvou hospodářských sektorů v rámci Evropské unie, a sice velkoobchodu a maloobchodu se zemědělskými a potravinářskými produkty. Pro tyto oblasti byl zpracován strukturální profil s ukazateli tržeb, přidané hodnoty a zaměstnanosti. Dále byly srovnány náklady, produktivita a rentabilita u prvních pěti členských států s průměrem EU-25. Poté, co došlo k 3,1% nárůstu tržeb v roce 2000, vývoj prodeje v sektoru zeměděl-ského velkoobchodu zaznamenal řadu nízkých zvýšení a snížení tržeb v rozmezí 0,6 % v roce 2002 až 1,5 % v roce 2004. Mezi rokem 2000 a 2005 sektor zemědělského obchodu obecně zaznamenal nižší míru nárůstu tržeb než průměr velko-obchodu celkem. Sektor malovelko-obchodu s potravinářskými prodejnami dosáhl v roce 2003 tržeb 120,4 miliard EUr. Tvorba majetku maloobchodu s potravinářskými prodejnami byla ohodnocena ve výši 23,8 miliard EUr, což představovalo 6,5 % v maloobchodu a opravách celkem, zatímco toto odvětví zaměstnávalo 1,4 milionu osob, což je přibližně 9,0 % pracovní síly v maloobchodu a opravách. Polovinu (49,9 %) tržeb v sektoru maloobchodu s potravinářskými prodejnami v EU dosáhly podniky prodávající ovoce, zeleninu, maso, ryby nebo pekárenské výrobky.
Klíčová slova: obchod, velkoobchod, maloobchod, Evropská unie, tržby, přidaná hodnota, náklady, produktivita, rentabilita
that there is, on the one hand, a high share of newly rising firms in the trade and services sector, but on the other hand, there is also a high share of ceasing firms. Further, the dominance of trade sector in the distribution channel is proved by the multinational trade chains with a great size, a huge financial capacity, professional management and a sophisticated logistic system. These companies have partly a stress to their suppliers, which is showing in trade conditions, and partly they reduce the competitiveness of small and medium-sized retail enterprises trying to face this threat they are affiliating into various cooperation coalitions, trade unions, purchasing alliances or retail networks and cooperatives. in the frame of trade in the internal Single European Market, it is important to pay attention to the structure, development and general position of the wholesale and retail trades, namely from both functional and institutional con-ceptions.
The intermediary, the wholesaler, is in effect a dis-tributor of goods from the manufacturer or supplier to the retailer. Wholesalers have traditionally been responsible for holding large stocks of products, at-tempting to anticipate demands and seasonal trends, etc. Traditionally the wholesaler has also provided a warehousing function for both the supplier and the retailer. This ensures that the supplier does not end up with stockpiles in the factory and is able to continue or switch productions; the retailer has similarly benefited from the use of this intermediary in the supply channel by avoiding the need to hold large quantities of stock. This enables the retailer to free up capital, which would otherwise be tied up in stock, for other purposes (gilbert 2003).
retailing has historically been viewed as the sale of goods to the consumer through retail shops. however, retailing today should be viewed as being a rather broader. retailing is the sale of goods and services to the ultimate consumer for the personal, family or household use. Thus retailing involves more than sell-ing tangible products. The purchase of a service such as a haircut or dry cleaning is also a retail transaction. Purchases for the business or industrial use are not retail transactions (cox, Brittain 2004).
in the frame of price levels of consumer expendi-tures, the adaptation process toward the high level of mutual convergence has to continue for at least two decades in 21st century. The converging trend
is unambiguous in the case of the new EU members, while the analysis of the core EU countries resulted in the presence of divergent signs for the food and housing expenditures. The new EU member countries converge from significantly different initial positions not only in shares of expenditures but also in
compara-tive price levels. in these countries, the convergence process is running simultaneously through more channels. The exchange rate channel is used in a greater extent only by the czech republic, Lithuania and Slovakia. These countries also proved the high-est speed of the price level convergence. The other countries rely mainly on changes in domestic prices, i.e. the inflation channel (Ševela 2006).
MATERIAL AND METHODS
Materials of the European commission using the EUroSTAT and leading world wide companies en-gage in the problem of trade and researches focusing mainly on wholesale and retail sectors were used to elaborate and fulfil successfully the described tasks. The nAcE (classification of Economic Activities in the EU) was used for the wholesale as well as retail. The activities in the nAcE Division 51 cover all wholesale trade except that concerning motor trade. This paper covers the resale (sale without transforma-tion) of new and used products, as well as wholesale activities carried out on a fee or contract basis: 51: wholesale trade and commission trade, except
of motor vehicles and motorcycles; 51.1: wholesale on a fee or contract basis;
51.2: wholesale of agricultural raw materials and live animals;
51.3: wholesale of food, beverages and tobacco; 51.4: wholesale of household goods;
51.5: wholesale of non-agricultural intermediate products, waste and scrap;
51.8: wholesale of machinery, equipment and sup- plies;
51.9: other wholesale.
Division 52 of the nAcE covers the retail trade as well as the repair of personal and household goods; the retail trade of motor vehicles and motorcycles is covered by the nAcE Division 50. The activity of retailing covers the resale without transformation of new and used goods to the general public for personal or household use and consumption:
52: retail trade, except of motor vehicles and mo- torcycles; repair of personal and household goods;
52.1: retail sale in non-specialised stores;
52.2: retail sale of food, beverages and tobacco in specialised stores;
52.3: retail sale of pharmaceuticals and medical goods, cosmetic and toilet articles;
52.5: retail sale of second-hand goods in stores; 52.6: retail sale not in stores;
52.7: repair of personal and household goods.
The indicators of turnover, value added, share of non-financial services value added, number of per-sons employed and share of non-financial services employment were used and compared to description of structural profile in wholesale and retail sectors. Then investment in tangible goods relative to the total operating costs, purchases of goods and services as a share of total operating costs, personnel costs as a share of total operating costs, labour productiv-ity, average personnel costs, wage adjusted labour productivity and gross operating rate.
RESULTS AND DISCUSSION
Structural profile of wholesale
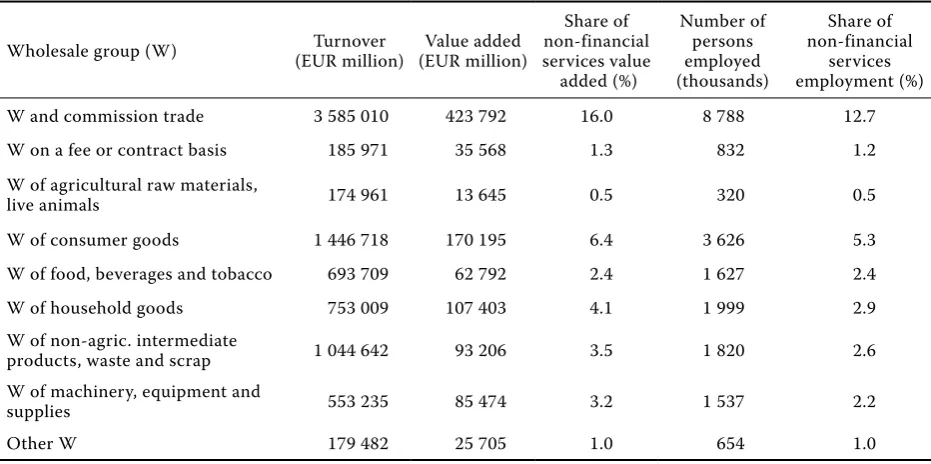
Value added in the EU-25 wholesale trade sector (nAcE Division 51) was EUr 423.8 billion in 2003, 45.5% of the value added generated within the whole of distributive trades (nAcE Section g), and 16.0% of the total for non-financial services (nAcE Sections g to i and K). There were 8.8 million persons employed in the EU-25 wholesale trade sector in 2003, which equated to 30.7% of the EU-25 total distributive trades workforce and 12.7% of the non-financial services workforce. As such, this sector contribution to the distributive trades and non-financial services was
much higher in the value added terms than in the employment terms. The structural profile of wholesale according to the nAcE is indicated in Table 1.
Among the activities that compose the wholesale trade sector, own-account wholesale trade (nAcE groups 51.2 to 51.9) accounted for 91.6% of the EU-25 wholesale trade value added in 2003, and wholesale on a fee or contract basis (nAcE group 51.1) for the reminder. The largest wholesale trade subsector in the value added and employment terms was the wholesale trade of consumer goods (nAcE groups 51.3 and 51.4) followed by the wholesale of non-agricultural intermediate products, waste and scrap (nAcE group 51.5) and machinery, equipment and supplies (nAcE group 51.8), both of which made a larger contribution to sectoral value added than employment.
The own-account wholesale trade generated EUr 3 399 billion of turnover in the EU-25 in 2003. The wholesaling of consumer goods was the largest activity and accounted for 64.8% of own-account wholesale turnover in Malta (2002), and also exceeded 50% in Portugal, cyprus and Spain, while the average share of consumer goods wholesaling for the EU-25 was 42.6%. The wholesale of non-agricultural intermediate products, waste and scrap was the second largest of the own-account wholesale trade subsectors in three quarters of the Member States, averaging 30.7% of own-account wholesale trade turnover in the EU-25. The importance of the wholesale trade of machinery, equipment and supplies varied greatly between the Member States, from just 3.7% in Poland to 28.8% in the netherlands. The wholesale trade of
agricul-Table 1. Structural profile of wholesale trade and commission trade (nAcE Division 51) in EU-25 in 2003
Wholesale group (W) (EUr million)Turnover (EUr million)Value added
Share of non-financial services value
added (%)
number of persons employed (thousands)
Share of non-financial
services employment (%)
W and commission trade 3 585 010 423 792 16.0 8 788 12.7
W on a fee or contract basis 185 971 35 568 1.3 832 1.2
W of agricultural raw materials,
live animals 174 961 13 645 0.5 320 0.5
W of consumer goods 1 446 718 170 195 6.4 3 626 5.3
W of food, beverages and tobacco 693 709 62 792 2.4 1 627 2.4
W of household goods 753 009 107 403 4.1 1 999 2.9
W of non-agric. intermediate
products, waste and scrap 1 044 642 93 206 3.5 1 820 2.6
W of machinery, equipment and
supplies 553 235 85 474 3.2 1 537 2.2
other W 179 482 25 705 1.0 654 1.0
[image:3.595.64.530.513.745.2]tural raw materials and live animals (nAcE group 51.2) accounted for one tenth of the own-account wholesale trade turnover in France (10.1); nearly double the EU-25 average (5.1%). other wholesale trade (nAcE group 51.9) accounted for 5.3% of the own-account wholesale trade turnover in the EU-25, although this share rose to more than one quarter of the total in Slovenia and Slovakia and exceeded one third in Poland.
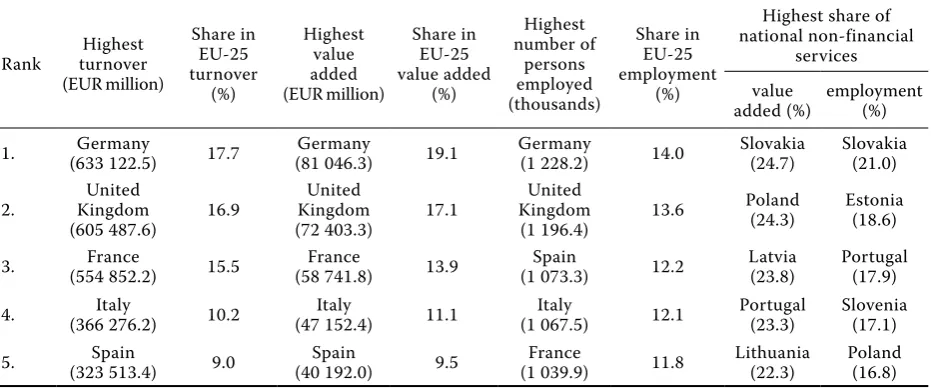
Among the Member States, germany and the United Kingdom had the largest wholesale trade sectors in the turnover, value added and employment terms (Table 2). relative to all non-financial services, Slovakia and Poland were the most specialised in wholesale trade in the value added terms, generating close to one quarter of their non-financial services value added in this sector in 2003 (Ec European Business – Facts and Figures).
Costs, productivity and profitability in wholesale trade
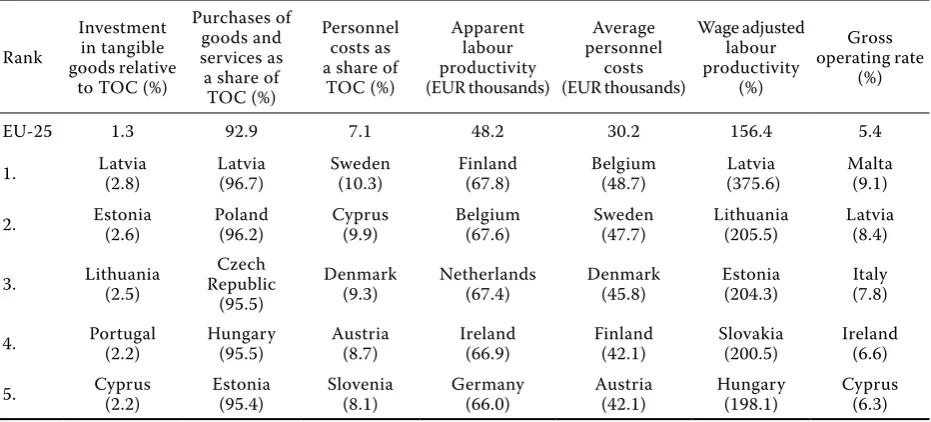
The level of gross tangible investment relative to operating expenditure was low in the wholesale trade sector, just 1.3% in the EU. not only was this much lower than the non-financial services average, it was also low compared with the other two distributive trades sectors (which were both also low), less than half the level registered for retail trade and repair (2.7%). This particularly low ratio in wholesale trade reflects the high level of operating expenditure as-sociated with wholesale trade (and the other distribu-tive trades as well), boosted by high expenditure on goods purchased for resale in the same condition.
An analysis of operating expenditure confirms that purchases of goods and services accounted for 92.9% of total operating expenditure in the wholesale trade sector, the same as for motor trades but higher than for retail trade and repair (87.7%); indeed, this was the highest proportion among all non-financial services nAcE divisions.
The apparent labour productivity was EUr 48 200 per 1 person employed in the EU-25 wholesale trade sector in 2003, higher than in the other distributive trades sectors and more than double the level for retail trade and repair, reflecting at least in part the higher full-time employment rate in wholesale trade. All of the wholesale trade nAcE groups recorded the apparent labour productivity ratios that were above the non-financial services average (EUr 38 200 per person employed), ranging from EUr 38 600 for the wholesale of food, beverages and tobacco and EUr 39 300 for other wholesale trade, up to more than EUr 50 000 per person employed for the wholesale of machinery, equipment and supplies (EUr 55 600), of household products (EUr 53 700), and of inter-mediate goods (EUr 51 200).
[image:4.595.66.532.98.293.2]The average personnel costs in the wholesale trade sector were EUr 30 200 per 1 employee in the EU-25 in 2002 which, as with the apparent labour productivity, was higher than in the other two distributive trades sectors and also above the non-financial services average. The wage adjusted labour productivity ratio was 156.4% in 2002, comparable with that for motor trades (156.0%) and notably higher than for retail trade and repair (132.5%). in 2003 the wage adjusted labour productivity of the Member States ranged from 119.8% in Sweden to 375.6% in Latvia.
Table 2. Turnover, value added and employment in wholesale and commission trade (nAcE Division 51): ranking of the top 5 Member States in 2003
rank turnover highest (EUr million)
Share in EU-25 turnover
(%)
highest value added (EUr million)
Share in EU-25 value added
(%)
highest number of
persons employed (thousands)
Share in EU-25 employment
(%)
highest share of national non-financial
services value
added (%) employment (%) 1. (633 122.5)germany 17.7 (81 046.3)germany 19.1 germany (1 228.2) 14.0 Slovakia (24.7) Slovakia (21.0)
2. Kingdom United
(605 487.6) 16.9
United Kingdom
(72 403.3) 17.1
United Kingdom
(1 196.4) 13.6
Poland
The gross operating surplus (value added minus personnel costs) in the EU-25 wholesale trade sector was equivalent to 5.4% of turnover in 2002, lower than in the two other distributive trades sectors, reflecting the high turnover and purchases (mainly for resale in the same condition as purchased) and relatively low margins typically associated with wholesale trade. Wholesale trade gross operating rates among the Member States did not vary greatly as well were situated within the range of 3.0% (France) to 9.1% (Malta, 2002), narrower than for both of the other distributive trades sectors. cost, productivity and profitability indicators ranking of the top 5 Member States compared to the EU-25 averages in wholesale and commission trade are indicated in Table 3.
Structural profile of agricultural wholesaling
Agricultural wholesaling covers the wholesaling of raw materials for agricultural activities (such as seeds and animal feed), as well as live animals. it does not cover the wholesaling of outputs from farming other than hides, skins and leather, and unmanufactured tobacco (nAcE group 51.2).
Agricultural wholesaling was the smallest own-ac-count wholesale trade subsector at the nAcE group level, whether measured in terms of turnover, value added or employment. indeed, the turnover generated by agricultural wholesaling was EUr 175.0 billion and value added EUr 13.6 billion in the EU-25 in 2003, which represented around 5.1% of own-account wholesale (nAcE groups 51.2 to 51.9) turnover and
3.2% of wholesale trade (nAcE Division 51) value added. There were 319 800 persons employed in this sector in the EU-25 in 2003, some 3.6% of the total number of persons employed in the wholesale trade sector.
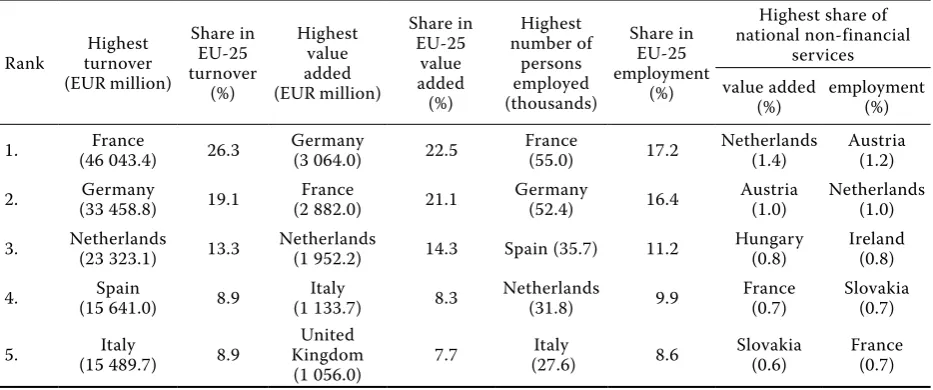
Among the Member States, France recorded the highest turnover and number of persons employed in the agricultural wholesale sector, while germany generated the highest level of value added (Table 4). France’s high shares made it one of the most spe-cialised Member States in this sector in terms of the sector’s contribution to non-financial services (nAcE Sections g to i and K) value added and employment, however, the netherlands and Austria were the most specialised.
The average size of agricultural wholesalers in the EU-25, as measured by the turnover, was EUr 2.8 mil-lion per enterprise, some EUr 0.4 milmil-lion below the own-account wholesale trade average in 2003. An analy-sis of this sector turnover by activity for the EU shows that the wholesale trade of grain, seeds and animal feeds (nAcE class 51.21) dominated with more than three fifths (63.0%) of sectoral turnover. The wholesale of live animals (nAcE class 51.23) contributed one fifth (20.6%) of sectoral turnover, and the wholesale of flowers and plants (nAcE class 51.22) just over one tenth (11.9%). The wholesale of hides, skins and leather (nAcE class 51.24) and the wholesale of un-manufactured tobacco (nAcE class 51.25) combined to contribute 4.5% of sectoral turnover.
After a 3.1% increase in the turnover index in 2000, the evolution of sales for the agricultural
wholesal-Table 3. cost, productivity and profitability indicators in wholesale and commission trade (nAcE Division 51), ranking of the top 5 Member States compared to EU-25 averages in 2003
rank
investment in tangible goods relative
to Toc (%)
Purchases of goods and services as a share of
Toc (%)
Personnel costs as a share of
Toc (%)
Apparent labour productivity (EUr thousands)
Average personnel
costs (EUr thousands)
Wage adjusted labour productivity
(%)
gross operating rate
(%)
EU-25 1.3 92.9 7.1 48.2 30.2 156.4 5.4
1. Latvia (2.8) Latvia (96.7) Sweden (10.3) Finland (67.8) Belgium (48.7) (375.6)Latvia Malta (9.1) 2. Estonia (2.6) Poland (96.2) cyprus (9.9) Belgium (67.6) Sweden (47.7) Lithuania (205.5) Latvia (8.4)
3. Lithuania (2.5) republic czech (95.5)
Denmark
(9.3) netherlands (67.4) Denmark (45.8) Estonia (204.3) italy (7.8) 4. Portugal (2.2) hungary (95.5) Austria (8.7) ireland (66.9) Finland (42.1) Slovakia (200.5) ireland (6.6) 5. cyprus (2.2) Estonia (95.4) Slovenia (8.1) germany (66.0) Austria (42.1) hungary (198.1) cyprus (6.3) Toc = total operating costs
[image:5.595.66.532.97.308.2]ing sector recorded a series of small increases and decreases in turnover, ranging from –0.6% in 2002 to 1.5% in 2004. Between 2000 and 2005 the agricultural wholesaling sector generally recorded a slower rate of expansion for turnover than the wholesale trade aver-age (Ec European Business – Facts and Figures).
Costs, productivity and profitability in agricultural wholesaling
in 2003 the apparent labour productivity of the agricultural wholesaling sector was EUr 42 700 per person employed in the EU-25, some EUr 5 500 below the wholesale trade average. At EUr 26 600 per 1 employee in 2002, the average personnel costs in this sector were also below the wholesale trade average (by EUr 3 600). The wage adjusted labour productivity ratio was 148.7%, some 7.7 percentage points below the average for the wholesale trade. The gross operating rate of the agricultural wholesal-ing sector was relatively low, as the gross operatwholesal-ing surplus was equivalent to just 3.2% of turnover in the EU-25 in 2002, the lowest rate among all of the wholesale trade activities (nAcE groups). The gross operating rate was below the wholesale trade aver-age in all Member States in 2003 except for Estonia, Slovakia and the United Kingdom.
Structural profile of retail
retail trade services are covered by the European commission proposal for the Directive on Services in the internal Market. The objective of the proposal is to achieve a genuine internal market in services
by removing legal and administrative barriers to the development of service activities between the Member States, facilitating the provision and use of cross-border services in the EU. it is expected that this Directive will be adopted in the near future.
retail trade provides an interface between produc-ers or wholesalproduc-ers and consumproduc-ers. Typically, one or several distributors intervene before a product, which leaves the factory gate, reaches the final consumer, the last of which is a retailer. retailers represent the largest proportion of enterprises within the distribu-tive trades (nAcE Section g) activities, accounting for slightly over 60% of all distribution enterprises in the EU-25 in 2003.
According to a ranking made by the Deloitte for 2005 (Deloitte 2007 ) (Table 5) among the top retailers in the EU-25, there were five german groups, three French, and one each from the netherlands and the United Kingdom. These large retailers generally op-erate in a wide range of countries inside the EU-25, in other areas of Europe, as well as in the Americas and Asia. Most of the large EU-25 retailers were principally retailers of food and beverages.
[image:6.595.65.532.97.292.2]E-commerce has in recent years played an increasing role in the shopping patterns of consumers, who may prefer to order goods from their home for conven-ience, or alternatively purchase items from afar, that are not on offer locally. According to the EUroSTAT information society statistics, some 8% of the turno-ver of distributive trades including motor trades – the nAcE Division 50 and wholesale trades – the nAcE Division 51, as well as retail trade and repair) enterprises with ten or more persons employed was derived from e-commerce in 2005. According to the
Table 4. Turnover, value added and employment in agricultural wholesaling (nAcE group 51.2): ranking of the top 5 Member States in 2003
rank turnover highest (EUr million)
Share in EU-25 turnover
(%)
highest value added (EUr million)
Share in EU-25
value added
(%)
highest number of
persons employed (thousands)
Share in EU-25 employment
(%)
highest share of national non-financial
services value added
(%) employment (%) 1. (46 043.4)France 26.3 germany (3 064.0) 22.5 France (55.0) 17.2 netherlands (1.4) Austria (1.2) 2. (33 458.8)germany 19.1 (2 882.0)France 21.1 germany (52.4) 16.4 Austria (1.0) netherlands (1.0) 3. netherlands (23 323.1) 13.3 netherlands (1 952.2) 14.3 Spain (35.7) 11.2 hungary (0.8) ireland (0.8) 4. (15 641.0)Spain 8.9 (1 133.7)italy 8.3 netherlands (31.8) 9.9 France (0.7) Slovakia (0.7)
5. (15 489.7)italy 8.9 Kingdom United
(1 056.0) 7.7
italy
same source 18% of the EU-25 population ordered or bought goods or services for private use through the internet in 2005 (during the three months preceding the survey). When restricting the reference popula-tion to only those individuals living in a household with the broadband internet access, the proportion increased to 39%. note that these figures refer to goods and services supplied to individuals by all sectors of the economy, not just enterprises that are specialised in retail sales.
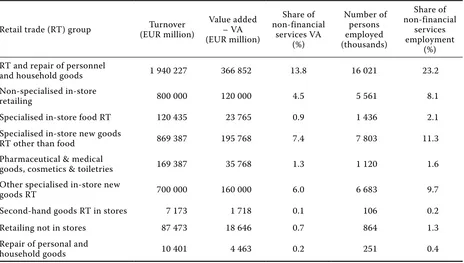
[image:7.595.67.534.237.427.2]in 2003, the retail trade and repair sector (nAcE Division 52) employed some 16.0 million persons in the EU-25 while the value added was EUr 366.9 bil-lion (Table 6). The relative size of the retail trade and repair sector varies considerably according to which economic indicator is used to measure its importance: in value added terms it accounted for 39.4% of the distributive trades (nAcE Section g) total, while in terms of employment it was the largest of the distributive trades sectors with 56.0% of the
Table 5. Top global retailers originating from within the EU-25, 2005
retailer World rank country of origin retail sales (EUr mil.)
1. carrefour S.A. 2 France 57 986.25
2. Metro Ag 4 germany 43 208.75
3. Tesco plc 5 United Kingdom 43 041.25
4. Schwarz group 10 germany 28 681.88
5. Aldi gmbh 11 germany 28 185.00
6. rewe-zentral Ag 11 germany 27 524.38
7. groupe Auchan SA 15 France 25 737.5
8. Edeka zentrale Ag 17 germany 24 653.13
9. Koninklijke Ahold n.V. 21 netherlands 23 058.13
10. E. Leclerc 22 France 22 183.75
retail sales values converted from USD (USD/EUr = 1.60) Source: Deloitte (2007)
Table 6. Structural profile of retail trade and repair (nAcE Division 52) in EU-25, 2003
retail trade (rT) group (EUr million)Turnover Value added – VA (EUr million)
Share of non-financial
services VA (%)
number of persons employed (thousands)
Share of non-financial
services employment
(%) rT and repair of personnel
and household goods 1 940 227 366 852 13.8 16 021 23.2
non-specialised in-store
retailing 800 000 120 000 4.5 5 561 8.1
Specialised in-store food rT 120 435 23 765 0.9 1 436 2.1
Specialised in-store new goods
rT other than food 869 387 195 768 7.4 7 803 11.3
Pharmaceutical & medical
goods, cosmetics & toiletries 169 387 35 768 1.3 1 120 1.6
other specialised in-store new
goods rT 700 000 160 000 6.0 6 683 9.7
Second-hand goods rT in stores 7 173 1 718 0.1 106 0.2
retailing not in stores 87 473 18 646 0.7 864 1.3
repair of personal and
household goods 10 401 4 463 0.2 251 0.4
[image:7.595.68.532.488.751.2]workforce. its contribution to non-financial services (nAcE Sections g to i and K) was 13.8% in value added terms and 23.2% in employment terms. These relatively high employment shares indicate that retail trade and repair had a lower apparent labour pro-ductivity (value added per 1 person employed) than the distributive trades or the non-financial services average.
in 2003, the retail trade activities (nAcE groups 52.1 to 52.6, excluding repair of personnel and house-hold goods) generated EUr 1 930 billion of turnover in the EU-25. A breakdown of turnover for retail trade highlights the split between specialised (nAcE groups 52.2 to 52.5) and non-specialised (nAcE group 52.1) in-store retailing, as well as the importance of retail-ing not in-stores (nAcE group 52.6).
Specialised in-store retailing was predominant in the EU-25 retail trade sector in 2003, generating 52.9% of turnover, some 10.5% more than the share of non-specialised in-store retailing. in 10 of the 23 Member States with data available at least 50% or more of retail trade turnover in eight Member States. The highest share for specialised in-store retailers was 68.8% in Malta, while many other southern Member States, as well as Austria, also had a majority of their turnover accounted for by specialised in-store retail-ers. The highest proportion of turnover generated by non-specialised in-store retailers was recorded in Slovenia (63.4%).
Some 4.6% of retail trade turnover was generated by retailing not in-stores (nAcE group 52.6) in the EU-25, a proportion that ranged from as much as 8.4% in germany (where mail order sales were particularly high) to a low of 1.3% in Denmark.
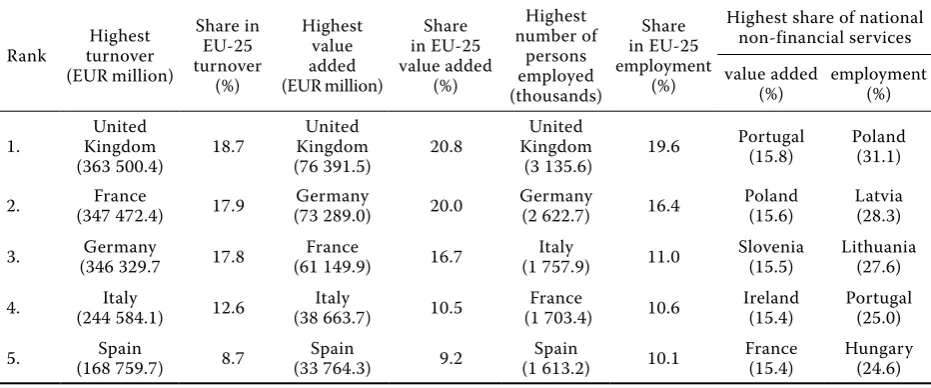
in terms of value added and employment, the United Kingdom and germany accounted for the largest shares of the EU-25 retail trade and repair sector in 2003, each generating around one fifth of the value added; while their employment shares were lower (19.6% and 16.4% respectively). given the essential nature of retail trade, providing services directly to consumers, it is not surprising that there was a lit-tle difference in specialisation between the Member States: the share of retail trade and repair in non-financial services value added ranged from 10.2% in Denmark to 15.8% in Portugal. The turnover, value added and employment indicators ranking of the top 5 Members States are indicated in Table 7.
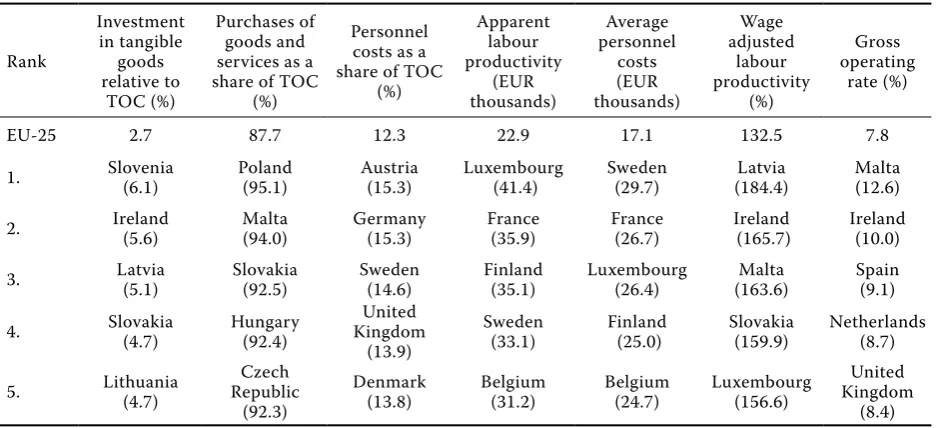
Costs, productivity and profitability in retail trade
[image:8.595.64.530.557.751.2]Typically for a distributive trades activity, the level of gross tangible investment relative to operating expenditure was low in the retail trade and repair sector, at just 2.7% in the EU, which was around half the average recorded for non-financial services, although higher than the equivalent ratios for motor trades or wholesale trade. This low ratio reflects the high level of operating expenditure associated with distributive trades activities, boosted by the high expenditure on goods purchased for resale in the same condition. An analysis of operating expenditure confirms that purchases of goods and services ac-counted for 87.7% of total operating expenditure in the EU retail trade and repair sector (again somewhat below the corresponding ratios for motor trades or wholesale trade).
Table 7. Turnover, value added and employment (ranking of the top Member States) in retail trade and repair of personal and household goods (nAcE Division 52), 2003
rank turnover highest (EUr million)
Share in EU-25 turnover
(%)
highest value added (EUr million)
Share in EU-25 value added
(%)
highest number of
persons employed (thousands)
Share in EU-25 employment
(%)
highest share of national non-financial services value added
(%) employment (%)
1. Kingdom United
(363 500.4) 18.7
United Kingdom
(76 391.5) 20.8
United Kingdom
(3 135.6) 19.6
Portugal
The EU-25 apparent labour productivity in the retail trade and repair sector was EUr 22 900 in 2003 and average personnel costs were EUr 17 100 per 1 employee in 2002. Because of the high incidence of part-time employment in the retail trade and repair sector care should be taken when comparing these ratios based on simple head counts across the Member States or activities. note also that the analysis of personnel costs only reflects the cost of paid em-ployees, and that the proportion of paid employees in the total number of persons employed within the retail trade and repair sector was relatively low at 77.1% in 2002, indicating a high proportion of self-employment and unpaid family workers. The wage adjusted labour productivity ratio is less influenced by these two important characteristics of retail trade and repair activities; it stood at 132.5% for the EU-25 retail trade and repair sector in 2002, compared with averages of 144.4% for distributive trades and 145.9% for non-financial services. An analysis of this ratio for the Member States shows that in 2003 only italy (97.5%) recorded a wage adjusted labour productiv-ity ratio below 100%, resulting from higher average personnel costs than apparent labour productivity; the highest ratios were recorded in Latvia (184.4%) and ireland (165.7%). The gross operating rate, cal-culated as the ratio of gross operating surplus to turnover, is an indicator of profitability. in 2002 this rate in the EU-25’s retail trade and repair sector was 7.8%, more than for either motor trades or wholesale trade, but below the non-financial services average of 11.2%. cost, productivity and profitability
indica-tors in retail trade for the top 5 Member States are indicated in Table 8.
Structural profile of non-specialised in-store retailing
non-specialised in store retailing covers retail sales in non-specialised stores with food, beverages and tobacco predominating (nAcE class 52.11) or not (nAcE class 52.12). The latter nAcE class princi-pally includes department stores that stock a general line of merchandise. non-specialised retailers offer consumers the opportunity to buy a broader range of products at a sole point of purchase (for example, supermarkets, hypermarkets or convenience stores). Large, non-specialised food retailers, in particular, may have a greater price flexibility, as they are able to accept lower margins on certain products, as well as exerting a greater purchasing power on their sup-pliers; furthermore, they may have their own inte-grated wholesale activities. While the number of pan-European brands has increased significantly and consumers can find most of them in a wide range of the Member States, it is important to bear in mind that food retailers also work with local suppliers, often reflecting local supply as well as social and cultural characteristics, all of which influence the choice of food and beverages that are available within a particular region.
[image:9.595.64.533.95.309.2]The EU-25 non-specialised in-store retailing sec-tor (nAcE group 52.1) generated EUr 800 billion of turnover in 2003, EUr 120 billion of value added, while
Table 8. cost, productivity and profitability in retail trade, except of motor vehicles and motorcycles, repair of personal and household goods (nAcE Division 52), ranking of the top 5 Member States compared to EU-25 averages, 2003
rank
investment in tangible
goods relative to
Toc (%)
Purchases of goods and services as a share of Toc
(%)
Personnel costs as a share of Toc
(%)
Apparent labour productivity
(EUr thousands)
Average personnel
costs (EUr thousands)
Wage adjusted
labour productivity
(%)
gross operating
rate (%)
EU-25 2.7 87.7 12.3 22.9 17.1 132.5 7.8
1. Slovenia (6.1) Poland (95.1) Austria (15.3) Luxembourg (41.4) Sweden (29.7) (184.4)Latvia Malta (12.6) 2. ireland (5.6) Malta (94.0) germany (15.3) France (35.9) France (26.7) (165.7)ireland ireland (10.0) 3. Latvia (5.1) Slovakia (92.5) Sweden (14.6) Finland (35.1) Luxembourg (26.4) (163.6)Malta Spain (9.1) 4. Slovakia (4.7) hungary (92.4) Kingdom United
(13.9)
Sweden
(33.1) Finland (25.0) Slovakia (159.9) netherlands (8.7) 5. Lithuania (4.7) republic czech
(92.3)
Denmark
(13.8) Belgium (31.2) Belgium (24.7) Luxembourg (156.6)
United Kingdom
(8.4) Toc = total operating costs
employing 5.6 million persons; as such, it accounted for 32.9% of the value added created by the retail trade and repair sector (nAcE Division 52) and a slightly higher proportion (34.7%) of its workforce.
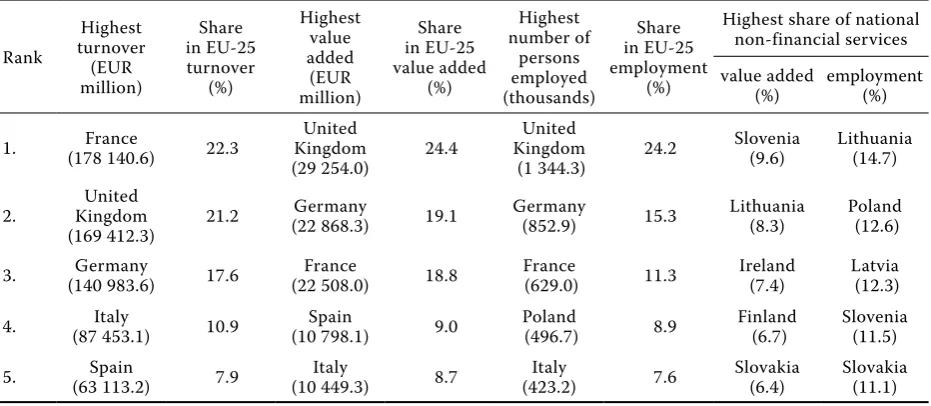
With EUr 29.3 billion of value added and 1.3 mil-lion persons employed in 2003, the United Kingdom was by far the largest contributor to the EU-25 value added and employment, although France recorded a higher share of turnover (Table 9). in the value added terms, Slovenia and Lithuania (2002) were the most specialised of the Member States, while the non-specialised in-store retailing sector was the least developed (in relation to non-financial services value added) in Malta (2002).
in the EU, the subsector with food, beverages or tobacco predominating (nAcE class 52.11) gener-ated 88.1% of sectoral turnover; it was dominant in all of the Member States for which data are avail-able, frequently generating more than four fifths of sectoral turnover, and only in Slovakia did its share fall below two thirds.
Large enterprises (with more than 250 persons employed) were particularly dominant in the EU non-specialised in-store retailing sector as they con-tributed 72.8% of sectoral value added. An alterna-tive indicator that can be used to analyse the size of enterprises is the average turnover generated per 1 enterprise (not the number of outlets). in 2003, the average turnover per 1 enterprise in the EU-25 non-specialised in-store retailing sector was around EUr 1.6 million. The largest average enterprise size (in turnover terms) was recorded in Luxembourg (at just under EUr 10 million), nearly double the
next highest value recorded in France. A relatively high turnover per 1 enterprise was also recorded in some of the north-western Member States, notably in Denmark, the United Kingdom and germany.
The structure of stores in the United Kingdom, the netherlands and Denmark stands out from the other countries due to the high proportion of very large stores (with at least 1 000 m2 of sales space),
which represented more than one in five of all stores in each of these three countries. The same Member States reported a low proportion of small retail stores (with less than 120 m2 of sales space), particularly
Denmark.
over the period 1995 to 2005, there was a steady growth in the volume of sales index for the EU-25 non-specialised in-store retailing, but large differences between the two subsectors. comparing over the period 1998 to 2005, non-specialised in-store retail-ers with food, beverages and tobacco predominating averaged 2.7% sales growth per annum compared with 1.2% for other non-specialised in-store retailers.
Costs, productivity and profitability in non-specialised in-store retailing
[image:10.595.66.532.97.300.2]The apparent labour productivity ratio of the EU-25 non-specialised in-store retailing sector was EUr 20 000 per 1 person employed in 2003. The wage adjusted labour productivity ratio for the EU was 132.4%, ranging among the Member States from just over 100% in italy (102.4%) and hungary (105.7%) to over 180% in Luxembourg (180.2%), ireland (181.2%) and Malta (183.8%, 2002). ireland (11.2%) and Malta
Table 9. Turnover, value added and employment (ranking of the top Member States) in non-specialised in-store retail-ing (nAcE group 52.1), 2003
rank
highest turnover (EUr million)
Share in EU-25 turnover
(%)
highest value added (EUr million)
Share in EU-25 value added
(%)
highest number of
persons employed (thousands)
Share in EU-25 employment
(%)
highest share of national non-financial services value added
(%) employment (%) 1. (178 140.6)France 22.3 Kingdom United
(29 254.0) 24.4
United Kingdom
(1 344.3) 24.2
Slovenia
(9.6) Lithuania (14.7)
2. Kingdom United
(169 412.3) 21.2
germany
(9.2%, 2002) also recorded the highest gross operat-ing rates in 2003, while the lowest levels of profit-ability were registered in hungary, Estonia and italy (below 3%).
Structural profile of specialised in-store food retailing
The activities covered by the specialised in-store food retailing are retail sale in the specialised stores of food, beverages or tobacco (nAcE group 52.2%). in-store food, beverages and tobacco retailing has been split between two subsectors, distinguishing specialised (nAcE group 52.2) from non-specialised (nAcE class 52.11) retailers. Data for 2003 shows that the Baltic States and Slovenia had the lowest proportion of in-store food, beverages and tobacco retailing turnover from specialised retailers (under 6% of the total). Specialised retailers also generated relatively high shares of turnover in many of the other southern European countries – notably Spain, cyprus, Portugal and italy – but they also accounted for more than one fifth of the turnover generated by the in-store retailing of food, beverages and tobacco in Austria and Poland.
Food retailing specialists are generally small retail outlets that do not belong to the national or inter-national chains, for example, fruit and vegetable shops, bakers, butchers and fishmongers. contrary to many non-food items, food is typically inelastic goods, which means that when prices rise, consum-ers generally do not cut back as much on the total
quantity purchased, although price increases may influence the choice of brand or retailer chosen by the individual customers.
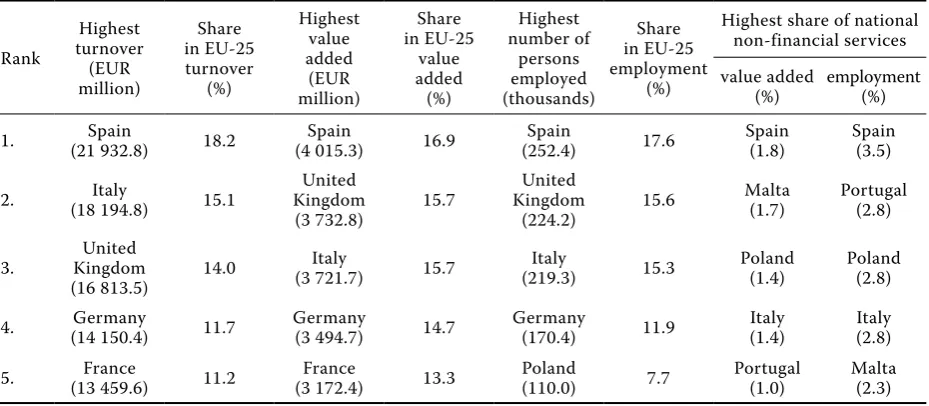
The EU-25 specialised in-store food retailing sector (nAcE group 52.2) generated EUr 120.4 billion of turnover in 2003. The wealth creation of specialised in-store food retailing was valued at EUr 23.8 bil-lion, equivalent to 6.5% of the retail trade and repair (nAcE Division 52) total, while this activity employed 1.4 million persons, some 9.0% of the retail trade and repair workforce.
Table 10 highlights the importance of this sector in Spain which had the highest turnover, value added and employment among the Member States in 2003. Unsurprisingly, Spain was the most specialised of the Member States in this sector as regards its con-tribution to non-financial services (particularly in employment terms), while the Baltic Member States (Lithuania, 2002), along with Finland, were the least specialised (in the value added terms).
[image:11.595.67.532.547.750.2]half (49.9%) the turnover in the specialised in-store food retailing sector in the EU was generated by en-terprises selling fruit, vegetables, meat, fish or bakery products (nAcE classes 52.21 to 52.24). Specialised in-store retailing of beverages (nAcE class 52.25) accounted for its highest proportion of turnover in Sweden where it reached 56.5%, some 3.7 times as high as the EU average (15.2%); it should be noted that in Sweden the sale of alcoholic beverages is only allowed in publicly controlled, specialised stores. The special-ised in-store retailing of tobacco products (nAcE class 52.26) was particularly high in Austria (58.5%), 3.2 times as high as the EU average (18.4%).
Table 10. Turnover, value added and employment (ranking of the top Member States) in specialised in-store food retail-ing (nAcE group 52.2), 2003
rank
highest turnover (EUr million)
Share in EU-25 turnover
(%)
highest value added
(EUr million)
Share in EU-25
value added
(%)
highest number of
persons employed (thousands)
Share in EU-25 employment
(%)
highest share of national non-financial services value added
(%) employment (%) 1. (21 932.8)Spain 18.2 (4 015.3)Spain 16.9 (252.4)Spain 17.6 Spain (1.8) Spain (3.5)
2. (18 194.8)italy 15.1 Kingdom United
(3 732.8) 15.7
United Kingdom
(224.2) 15.6
Malta
(1.7) Portugal (2.8)
3. Kingdom United
(16 813.5) 14.0
italy
The average turnover per 1 enterprise in the EU-25 specialised in-store food retailing sector was EUr 227 000 in 2003, considerably smaller than the average for other forms of in-store retailing. Finland had the largest average enterprise size (in turnover terms), as it was the only Member State where the turnover per 1 enterprise was greater than EUr 1 million. Unlike other in-store retailing sectors, one of the Member States that joined the EU in 2004 figured near the top of the ranking, with the average turnover per 1 enter-prise in Slovakia reaching EUr 715 000. Portugal, italy and Spain were grouped with several Member States that joined the EU in 2004 with the average turnover per enterprise well below the EU-25 average.
Costs, productivity and profitability in specialised in-store food retailing
The EU-25 apparent labour productivity for the specialised in-store food retailing sector (nAcE group 52.2) in 2003 was EUr 16 500 per person employed, while average personnel costs in 2002 were EUr 13 400 per employee. These values were approximately 25% below the retail trade and repair (nAcE Division 52) average. The wage adjusted labour productivity ratio for this sector was 127.8% in 2002, compared with a retail trade and repair average of 132.5%. The wage adjusted labour productivity fell below parity (100%) in 2003 in cyprus (89.7%), italy (94.4%) and Slovenia (95.1%), while this ratio was at its highest among the Member States in Malta (182.1%, 2002). The gross operating rate, an indicator of profitability, shows that the gross operating surplus for the EU-25 specialised in-store food retailing sector was equivalent to 10.5% of turnover in 2002, higher than the retail trade and repair average (7.8%).
CONCLUSION
This paper has been structured so that the reader will have been exposed to the underlying structural profile of the intra-community trade and especially in agriculture and food wholesaling and retailing. The turnover, value added and number of persons employed indicators were described for the wholesale and retail sectors as well as for given subgroups
ac-cording to the classification of Economic Activities in the EU (nAcE). There were costs, productivity and profitability indicators presented and analysed in these sectors and subgroups.
There is a trend showing the consumer expenditure shifting from spending on goods to services. For ex-ample, catering (restaurants and cafés), holidays and home entertainment and financial services have all performed well during the period from 2000. Food expenditures have remained relatively static after tak-ing inflation into account, while the expenditures on clothing and footwear have shown a negative growth (cox, Brittain 2004).
nowadays, in the turbulent business world, there are many factors such as more sophisticated and more aware consumers, government pressure, some new legislations, new technologies, trade cooperation coalitions and the increasing media attention that forced wholesalers and retailers to pay more attention not only to the economic, but also environmental and social impact of their activities. There is no short-cut route to deciding on the future. it requires a great deal of analysis of the emerging trends and the signals of change. Wholesalers and especially retailers that can create a company culture, which seeks to understand and manage change, are the ones who are best suited to survive and prosper.
REFERENCES
cox r., Brittain P. (2004): retailing – An introduction. Prentice hall, harlow; iSBn 0-273-67819-1. gilbert D. (2003): retail Marketing Management.
Prentice hall, harlow; iSBn 0-273-65511-6. Ševela M. (2006): Price levels convergence of
con-sumer expenditures in the European Union. Agri-cultural Economics – czech, 52 (5): 197–204. Ec: European Business – Facts and Figures.
Avail-able at www://epp.eurostat.ec.europa.eu/portal/ page?_pageid=1073,46587259&_dad=portal&_ schema=PorTAL&p_product_code=KS-BW-06-001 [Quoted 24.4.2008].
Deloitte (2007): global Powers of retailing. Avail-able at www.deloitte.com/dtt/cda/doc/content/ us_cb_globalpowers_012207opt.pdf [Quoted 24.4.2008].
Arrived on 29th April 2008
Contact address: