December 15th, 2017
Coaching in eHealth
Exploratory research on the preference of
Dutch employees for Emotion-Focused or
Solution-Focused coaching to reduce
work-related stress.
Masterthesis Lieke Hovenga
2 COLOPHON
Lieke Hovenga
Twente University
Faculty Behavioural Management and Social Science
Department of Health Psychology & Applied Technology
Dr. L.M.A. Braakman – Jansen MSc A. Lentferink
3 INDEX
ABSTRACT ... 4
INTRODUCTION ... 5
METHODS ... 10
DESIGN ... 10
PARTICIPANTS ... 10
MATERIALS ... 10
A/B PREFERENCE TESTING: SCENARIOS, COACHING MESSAGES, AND CATEGORIES ... 10
WORK ENGAGEMENT: UBES-15 ... 17
RESEARCH ETHICS ... 17
PROCEDURE ... 18
DATA-ANALYSIS ... 19
RESULTS ... 21
DISCUSSION ... 26
REFERENCES ... 29
APPENDIX A – UBES (DUTCH) ... 34
4 ABSTRACT
Background: Work stress is the highest cause of absenteeism and may cause long-term illness such as a burnout. Since stressful situations are not always avoidable in the work place, tools are needed to learn how to cope with stress to prevent employees from becoming burned out.eCoaching holds promise for improving self-help techniques in dealing with stress. Because it is unclear what the needs for an online coaching tool are, it is important to investigate which kind of coaching employees prefer. A distinction is made between Emotion-Focused and Solution-Focused coaching style. Subsequently, the socio-demographic variables gender, age, and level of education were examined. Also, the level of work engagement has been measured to explore if engaged employees prefer a different coaching style than their less engaged colleagues. Method:70 female and 40 male
employees (N = 110) between the age of 23 till 65 participated in the online survey. To investigate the preference for coaching style, the A/B preference testing method (Ferris, 1958) was performed. Participants got presented with 4 scenarios in which they needed to choose which textual coaching message (Emotion-Focused or Solution-Focused) they preferred in the situations. In order to gain more insight into which elements of the coaching styles appeal to the employees, the participants had to rate the phrases of the coaching messages on a scale of 1 to 5. The phrases of each coaching message within the coaching style had been categorized. For the Emotion-Focused coaching style the categories consisted of Empathy, Acceptance, Awareness, and Regulation of Emotion. For the
Solution-Focused coaching style the categories were Setting Goals, Self-Solving Skills, Practical Information, and Active (Turn-to-Action). The level of work engagement was measured with the UBES-15 (Schaufeli & Bakker, 2003). Results: 52% (n=57) of the employees have a preference for Solution-Focused coaching, 19% (n=21) have a preference for Emotion-Focused coaching, and 29% (n=32) has no clear preference (Neutral). There is a significant difference in preference between male and female employees (p = .04). In general men and women prefer Solution-Focused coaching. Female employees prefer Emotion-Focused coaching more than male employees. 36% of the female employees are indifferent about their preference, which is more often than male employees (17.5%). No statistically significant difference was found between age and preference (p = .93), between type of preference and level of education (p = .16), and no statistically significant relationship was found (p = .98) between the level of work engagement and preference for coaching style. When analysing the categories within the coaching styles it can be concluded that employees with a preference for Emotion-Focused coaching give significant higher ratings of all 4 categories within this coaching style. Within the Solution-Focused coaching style 2 (Setting Goals and Active) of the 4 categories appeal significantly more to employees with a preference for Solution-Focused coaching. Discussion:
5 INTRODUCTION
Stress in daily life is a near constant for many people, particularly in the workplace. 69% of individuals describe work as being a significant source of stress in their lives (American Psychological Association, 2009). Chronic stress, even if present for as little as 3 months, can result in reduced brain volume in regions important for attention, memory, and mood regulation (Arnsten, 2009; Goleman, Boyatzis, & McKee, 2002; Papagni, et al., 2011). Chronic stress can lead to overstrain, which eventually can lead to a burnout; a long-term consequence of impairing mental strain (Demerouti, Bakker, Nachreiner, & Ebbinghaus, 2002).
Approximately one fourth of all the absenteeism at work is caused by psychological complaints due to overstrain and burnout. In The Netherlands the amount of people with burnout complaints expanded from 11% in 2007 to 14% in 2015. According to the study of Centraal Bureau voor de Statistiek (CBS) (2016) the amount of employees with burnout complaints are more or less the same among male and female workers, although females report having slightly more burnout complaints than males. In both the male and female working population, the CBS reports the highest percentage of burnout complaints among young adults (age 25 to 35) with respectively 16% of the male employees and 18% of the female workers.
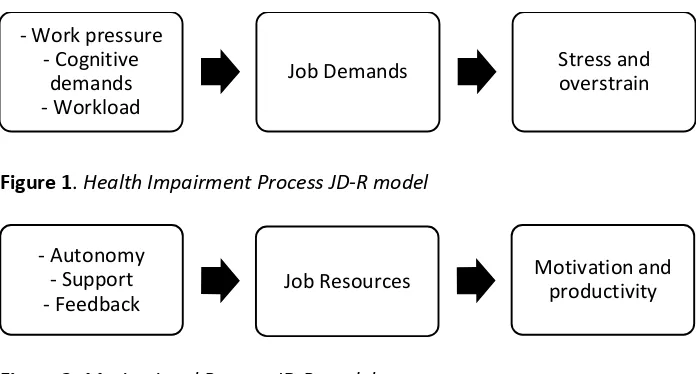
The main cause of work stress is high workload and high work pressure (Arbobalans, 2016; Bakker, Demerouti, & Sanz-Vergel, 2014). When it comes to work stress, the Job Demands-Resources model (JD-R model) by Schaufeli & Taris (2013), suggest a transactional pathway between multiple processes and recourses. The JD-R model suggest that high job demands leads to stress responses and overstrain (burnout), whilst high job resources lead to higher motivation and productivity (work engagement). Respectively figure 1 and figure 2.
[image:5.595.71.419.544.731.2]Figure 1. Health Impairment Process JD-R model
Figure 2.Motivational Process JD-R model
- Work pressure - Cognitive
demands - Workload
Job Demands Stress and overstrain
- Autonomy - Support
- Feedback Job Resources
6 Job demands are aspects of the job that require sustained physical, emotional, or cognitive effort (Demerouti E. , Bakker, Janssen, & Schaufeli, 2001). High job demands are associated with physiological (elevated blood pressure, increased hormonal activity, increased heart rate) and
psychological costs (e.g., fatigue, psychological need thwarting). After prolonged exposure to high job demands, employees may start to experience burnout (Bakker, Schaufeli, Sixma, Bosveld, & Van Dierendonck, 2000). Findings indicate that job resources prevent the development of negative attitudes and play a buffering role in the relationship between job demands and burnout (Bakker, Demerouti, & Euwema, 2005; Bakker, Hakanen, Demerouti, & Xanthopoulou, 2007; Xanthopoulou, Bakker, Demerouti, & Schaufeli, 2007). Job resources are those physical, psychological, social, or organizational aspects of the job that help to either achieve work goals, reduce job demands and the associated physiological and psychological costs, or stimulate growth, learning, and development (Bakker & Demerouti, 2007). Even though Lee and Ashfort’s (1996) meta-analysis showed that job demands were more important predictors of burnout than were (lack of) job resources, job resources do foster employee motivation and thus may produce work engagement (Schaufeli, Bakker, & van Rhenen, 2009). Unlike those who suffer from burnout, engaged employees have a sense of energetic and effective connection with their work, and they look upon their work as challenging, as opposed to stressful and demanding (Schaufeli, Bakker, & van Rhenen, 2009). The availability of job resources, for instance stress management interventions, might enhance work engagement levels of employees (Bakker & Demerouti, 2007; Schaufeli, Bakker, & van Rhenen, 2009; Naudé & Rothmann, 2006).
There is considerable evidence that stress management can lead to improved quality of life and have positive effects on well-being and cognition (Richardson & Rothstein, 2008; Bond & Bunce, 2000).Most stress management interventions focus on coping. Coping refers to how to deal with stressful situations and it depends on the secondary appraisal of the stressful event (Lazarus, 2000). Lazarus states in his Transactional Model of Stress and Coping (2000) that when the primary
appraisal of the stressor is perceived as dangerous or threatening, the reaction will be a stress response (e.g., negative emotions, increased physiological arousal) in which a coping response (e.g., using strategies to decrease stress) will follow. When a person is insufficient in using coping
strategies, the stress response remains. Therefore it is important to use efficient coping strategies when stressful situations occur. Coping strategies are divided in two global concepts, that is to say Emotion-Focused coping and Problem-Focused coping (Selmer, 1999; Stahl & Caligiuri, 2005). Problem-Focused coping is also referred to as Solution-Focused coping. In view of the current modern Positive Psychology and because of the dominancy of the term in recent research studies, in this research the name Solution-Focused was chosen instead of Problem-Focused. Whereby
7 and beliefs which arise in stressful events, Solution-Focused coping is the use of strategies to solve the problem (stressor) instead of analysing the issue. Both concepts have their base in the Third Force Psychology which is the humanistic approach in psychology founded by Rogers (1946) and Maslow (1943). The most applied humanistic psychology in practice is the Cognitive Behavioural Therapy, in which elements of both Emotion-Focused and Solution-Focused coping strategies are included. Other therapies that include the types of coping are Solution-Focused Therapy (SFT) and Emotion-Focused Therapy (EFT). In SFT goal-orientation and focus on the future are key concepts. How to take step forward with the focus on what is working instead of what is not. SFT uses the current existing strengths, resources, and problem-solving skills of a person (Gunterman, 2014). SFT is focused on the enhancement of the autonomy, whereby the focal point is on the solution instead of the problem (Bakker & Bannink, 2008). SFT has his foundation in Client-Centered Therapy, and can also be considered as a form of Cognitive Behavioural Therapy (Bannink, 2006). In EFT the
understanding of emotions are central. EFT is based on the analysis of the meaning of the emotions that occur during an (stressful) personal event. Goal of EFT is to enhance the self, regulate affect, and the creation of new meaning. This is done by multiple strategies which focusses around being more aware, acceptant and expressive of the emotions (Greenberg & Safran, 1989). For instance,
relaxation techniques -such as meditation- may help to reduce stress (Murphy, 1996). Evidence indicates that incidental emotional regulation can be effective at reducing negative emotional responses (Berkman & Lieberman, 2009). Another example of an Emotion-Focused strategy is labelling an affective state, this can dampen negative emotions and result in reduced physiological signs of stress (Lieberman, et al., 2007; Lieberman, Inagaki, Tabibnia, & Crockett, 2011). Acceptance and understanding of emotions and empathic communication are the main focus of EFT (Yazar, 2010).
Some researcher suggest that Solution-Focused coping techniques are more helpful in
stressful situations, because they find that focussing and venting of emotions (Emotion-Focused) may distract people from active coping (Scheff, 1979; Scheier & Carver, 1977; Felton, Revenson, &
8 and older people cope with stress in the same way. But because of the current high numbers of burnout complains among young adults in the age of 25 to 35 (Arbobalans, 2016), the hypothesis is that employees of different ages might differ in their choice of coping. Also, several studies have found that people with lower educational status show a higher number of symptoms caused by stress (Byles, Gallienne, Blyth, & Banks, 2012; Myer, Stein, Grimsrud, Seedat, & Wiliams, 2008; Talala, Huurre, Aro, Martelin, & Prättälä, 2008). Thus differences in coping strategies might be of interest regarding educational level. Further, engaged employees seem to differ from other employees in terms of their coping style. Research suggests that engaged employees have an active (i.e., Solution-Focused) coping style (Bakker A. B., Schaufeli, Leiter, & Taris, 2008; Luthans, Norman, Avolio, & Avey, 2008).
Considering the increase of people with burnout complaints and the current financial cuts in health care, new formats for treatments need to be sought. Healthcare software applications may provide ease in the economic situation in public healthcare (Intille, 2003; Kraft, Drozd, & Olsen, 2008). There is a multitude of stress management apps available, but very few of these apps are evidence-based and many are with low-quality content (Huckvale, Car, Morrison, & Car, 2012; Pandey, Hasan, Dubey, & Sarangi, 2013; Rosser & Ecclecston, 2011). Also, several research studies suggests that these health-related apps are often hastily developed and may therefore not meet the users’ needs and/or expectations (Doarn & Merrell, 2013; BinDhim, Hawkey, & Trevena, 2015). Despite of the remarks on the development of health-related apps, technology can create
9 To develop applications that do require to the users’ needs, understanding of the user context is important. Thus, before a persuasive systems can be developed and/or designed, it is important to analyse the context. Therefore it needs to be clear what information will be relevant for the user. The understanding of the user context is the base of ‘tailoring’. Tailoring means that there are different information content for different user groups and is an important feature in health communication (Hawkins, Kreuter, Resnicow, Fishbein, & Dijkstra, 2008). Tailoring is one of the Primary Task Support design principle in the framework of Persuasive Systems Design (PSD) by Onias-Kukkonen and Harjumaa (2009). The PSD framework describes the process of developing a
persuasive system and consists three steps. First it is crucial to understand the fundamental issues behind persuasive systems. Second, the context for persuasive systems needs to be analysed. And third, system qualities may be designed or evaluated. This research focuses on the second phase of the development of a persuasive system, namely analysing the persuasion context.
Should eCoaching messages in work related stress situations be primarily focused on analysing emotions, or should they be focused on constructing solutions? Are there differences in preference in various user groups? This research aims to give insight in the characteristics of the different user groups. Based on the results of this study, an online prevention intervention concerning work-related stress can be more tailored and persuasive which enhances the possible effectiveness of the intervention. For this exploratory research the following questions are conducted:
1. What coaching style do employees prefer in work-related stress situations, Emotion-Focused or Solution-Focused?
2. Is there a difference in preference for coaching style to reduce work stress between male and female employees?
3. Is there a correlation between age and preference for coaching style?
4. Is there a difference in preference for coaching style between levels of education (low educated; VMBO/MAVO/HAVO, average educated; VWO/MBO, high educated; HBO/WO)? 5. Is there a correlation between the level of work engagement (UBES-15) and preference for
coaching style?
6. Which of the four categories in Emotion-Focused coaching messages (Empathy, Awareness, Acceptance, or Regulation of Emotion) appeal to the employees?
10 METHODS
DESIGN
To achieve the research goals, an exploratory research was conducted by means of an online survey. Data collection took place within a period of a month in June 2017. The duration to complete the online survey was on average 10 minutes. Completion of the survey was carried out behind the computer, in a non-clinical setting. To investigate the preference for coaching style, the A/B preference testing method was performed. Respondents needed to attend to which of the two coaching messages appeal to them the most in the outlined situations. To distinguish possible differences in preferences between men and woman, age, and level of education, an inventory of these demographic variables was made at the start of the survey. Also, the level of work engagement was measured with the UBES-15.
PARTICIPANTS
Participants were 110 Dutch employees, aged between 23 and 65 (average: 37 years). There were 70 female respondents and 40 male respondents. The average educational level of the participants was high (68%). They were recruited via social networks Facebook and LinkedIn. The criterion for
participation was being older than 18 years and younger than 67 years, having a payed job for more than 16 hours a week. The age criteria was set to only include the working population and the minimum working hours to exclude students who work a couple of hours a week next to their study.
MATERIALS
A/B PREFERENCE TESTING: SCENARIOS, COACHING MESSAGES, AND CATEGORIES
A/B preference testing is a forced choice method originated by George Ferris (1958). Participants needed to choose between either one or the other, even if they do not prefer one clearly. It is assumed that those who really prefer one type of message over the other will
consistently do so each time they are confronted with the choice, and that those with no consistent preference will chose sometimes for the one, sometimes for the other (Ferris, 1958).
11 The first scenario outlines an situation in which extra tasks need to be taken care of because of a sick colleague. This first scenario captures high workload. The second scenario sketches a condition where a resentful task needs urgent completion. Whereby an increase in work pressure is suggested. The third scenario communicates poor concentration, which is a cognitive job demand. The fourth, and last scenario, states that there is limited time left to finish the urgent task. In this last scenario another stressful event is suggested which is another important job demand (Bakker, Demerouti, & Sanz-Vergel, 2014). The scenarios are as follows:
Scenario 1:It is Monday morning and the employer comes to you with the announcement that you have to take additional work this week, because of a sick colleague. You begin to feel the work
pressure and the e-coach notes a change in the physical measurement (increased heart rate) and
sends a push-message to a mobile device (smartphone, tablet, laptop).
Scenario 2:At the end of the morning you receive an e-mail with the announcement that a certain task – one you are not looking forward to - needs to be finished with urgency. You consult the
e-coach for help and support.
Scenario 3:It is early in the afternoon and you notice that you cannot keep you focus on certain tasks. Because you have consulted the e-coach two times earlier this day, the system sends a message
asking how stressed you feel at the moment. You state that you are suffering from lack of
concentration.
Scenario 4:You have less than two hours to complete the urgent task and a lot of work still needs to be done. The smart watch indicates a psychical reaction of stress. You receive a message.
To investigate whether employees have a preference for an Emotion-Focused coping in coaching messages or Solution-Focused, different coaching messages where composed. The content of the coaching messages is based on communication techniques of health message design by Lewis et al., (2016) which include message-related characteristics whereby the researchers suggests that the focus of the message is on the perceived benefits on adapting new behaviour and/or highlighting the perceived disadvantages current behaviour. Also, the framework of the Persuasive Systems Design (Oinas-Kukkonen & Harjumaa, 2009) was taken into account to set up the coaching messages.
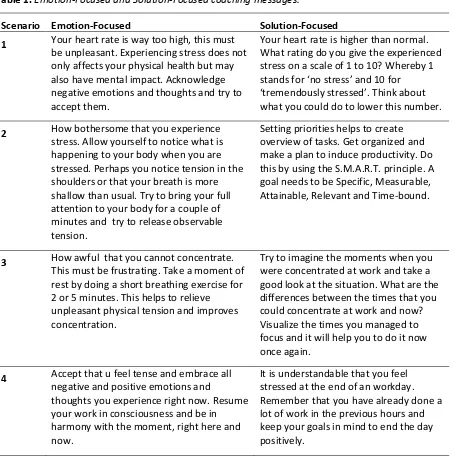
12 For example in Emotion-Focused Therapy strategies for emotional processing are expression of emotion, becoming aware of emotions, feelings, and thoughts (Greenberg & Safran, 1989), and empathic communication (Yazar, 2010). In Solution-Focused Therapy strategies the focus is on the solution by, for example, enhancing problem-solving skills and goal orientation (Bakker & Bannink, 2008; Bannink, 2010). Table 1 shows an overview of the Emotion-Focused and Solution-Focused coaching messages per scenario.
Table 1.Emotion-Focused and Solution-Focused coaching messages.
Scenario Emotion-Focused Solution-Focused
1 Your heart rate is way too high, this must be unpleasant. Experiencing stress does not only affects your physical health but may also have mental impact. Acknowledge negative emotions and thoughts and try to accept them.
Your heart rate is higher than normal. What rating do you give the experienced stress on a scale of 1 to 10? Whereby 1 stands for ‘no stress’ and 10 for
‘tremendously stressed’. Think about what you could do to lower this number.
2 How bothersome that you experience
stress. Allow yourself to notice what is happening to your body when you are stressed. Perhaps you notice tension in the shoulders or that your breath is more shallow than usual. Try to bring your full attention to your body for a couple of minutes and try to release observable tension.
Setting priorities helps to create overview of tasks. Get organized and make a plan to induce productivity. Do this by using the S.M.A.R.T. principle. A goal needs to be Specific, Measurable, Attainable, Relevant and Time-bound.
3 How awful that you cannot concentrate. This must be frustrating. Take a moment of rest by doing a short breathing exercise for 2 or 5 minutes. This helps to relieve unpleasant physical tension and improves concentration.
Try to imagine the moments when you were concentrated at work and take a good look at the situation. What are the differences between the times that you could concentrate at work and now? Visualize the times you managed to focus and it will help you to do it now once again.
4 Accept that u feel tense and embrace all negative and positive emotions and
thoughts you experience right now. Resume your work in consciousness and be in harmony with the moment, right here and now.
It is understandable that you feel stressed at the end of an workday. Remember that you have already done a lot of work in the previous hours and keep your goals in mind to end the day positively.
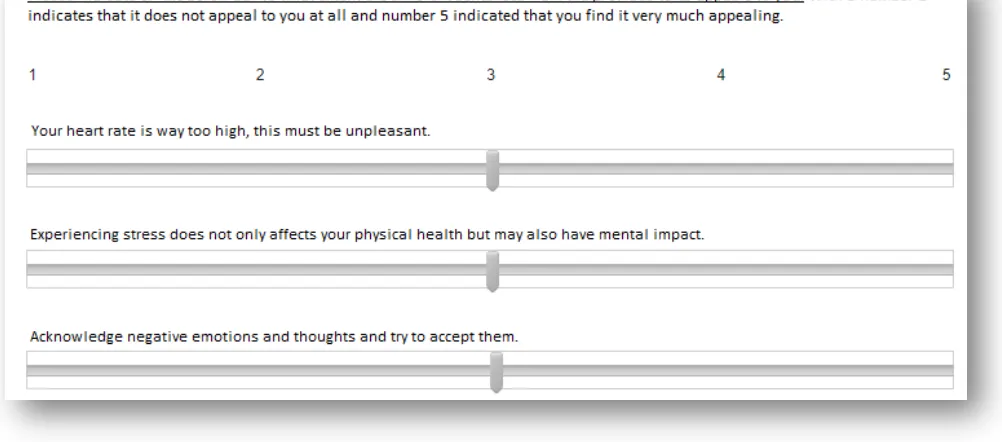
13 With 4 scenarios and 2 answer possibilities, it means that there were 8 different orders of presentation of the coaching messages. Participants were required to select one coaching message they would want to receive if they were in the situation of the scenarios. Figure 3 shows an example of the A/B preference testing procedure.
Figure 3. Example A/B preference testing (scenario 1 in online survey).
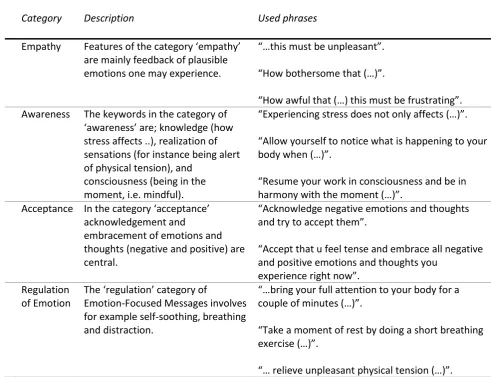
After the participants made a preference for one of the coaching messages, they needed to rate the phrases of both messages. The phrases of Emotion-Focused and Solution-Focused coaching messages were divided into categories. The Emotion-Focused messages contains of 11 phrases divided into 4 categories, namely: 1) Empathy, 2) Awareness, 3) Acceptance, and 4) Regulation messages. The categories are based on Emotion-Focused coping techniques, and the principles and strategies of EFT. An example of a phrase in the category Acceptance include items like:
“Acknowledge negative emotions and thoughts, and try to accept them”. Table 2 gives the description of each category in the Emotion-Focused coaching style and the used phrases. The categories Empathy, Awareness, and Regulation of Emotion all contain 3 phrases. The category Acceptance contains 2 phrases.
A
14 Table 2. Categories, description, and used phrases of Emotion-Focused messages.
Category Description Used phrases
Empathy Features of the category ‘empathy’ are mainly feedback of plausible emotions one may experience.
“…this must be unpleasant”.
“How bothersome that (…)”.
“How awful that (…) this must be frustrating”. Awareness The keywords in the category of
‘awareness’ are; knowledge (how stress affects ..), realization of sensations (for instance being alert of physical tension), and
consciousness (being in the moment, i.e. mindful).
“Experiencing stress does not only affects (…)”.
“Allow yourself to notice what is happening to your body when (…)”.
“Resume your work in consciousness and be in harmony with the moment (…)”.
Acceptance In the category ‘acceptance’ acknowledgement and
embracement of emotions and thoughts (negative and positive) are central.
“Acknowledge negative emotions and thoughts and try to accept them”.
“Accept that u feel tense and embrace all negative and positive emotions and thoughts you
experience right now”. Regulation
of Emotion
The ‘regulation’ category of
Emotion-Focused Messages involves for example self-soothing, breathing and distraction.
“…bring your full attention to your body for a couple of minutes (…)”.
“Take a moment of rest by doing a short breathing exercise (…)”.
“… relieve unpleasant physical tension (…)”.
15 Table 3. Categories, description, and used phrases of Solution-Focused messages.
Category Description Used phrases
Setting Goals ‘Setting Goals’ is mainly about prioritizing and how to set achievable goals.
“Setting priorities helps to create overview of tasks”.
“…A goal needs to be Specific, Measurable, Attainable, Relevant and Time-bound”.
“… keep your goals in mind to (…)”. Self-Solving
Skills
The category ‘Self-Solving Skills’ contains the scale question and the miracle question. Both examples of Solution-Focused techniques/methods used to improve self-solving skills for coping.
“What rating do you give the experienced stress on a scale of 1 to 10”?
“Try to imagine the moments when you were concentrated at work (…)”.
“What are the differences between (…)”.
Practical Information
This category contains no-nonsense facts (clear feedback).
“Your heart rate is higher than normal”.
“It is understandable that you feel stressed at the end of an workday”.
Active (Turn-to-Action)
The ‘active’ category of Solution-Focused messages include
instructions in which goals is to activate somebody to do something.
“Think about what you could do (…)”.
“Get organized and make a plan (…)”.
“Visualize the times you managed to focus (…)”.
17 WORK ENGAGEMENT: UBES-15
Work engagement was measured using a 15-item version of the Utrechtse Bevlogenheid Schaal (UBES) conducted by Schaufeli and Bakker (2003), see Appendix A. The UBES is a reliable measurement with high homogeneity (Cronbach’s α of the total score of the UBES is 0.92) which benefits the internal consistency (Montgomery, Peeters, Schaufeli, & Den Ouden, 2003; Demerouti E. , Bakker, Janssen, & Schaufeli, 2001; Schaufeli & Bakker, 2003).
The items of the UBES are answered on a Likert-scale with seven possibilities ranked from low to high and valued from zero to six. In which ‘0’ stands for ‘never’, ‘1’ for ‘almost never/a few times a month’, ‘2’ for ‘rarely/once a month or less’, ‘3’ for ‘sometimes/a few times a month’, ‘4’ for ‘often/once a week’, ‘5’ for ‘very often/a few times a week’, and ‘6’ stands for ‘always/every day’.
On each item the respondent values in what amount the statement applies to their personal experience. For this research the total mean score of the sample was calculated and compared to the norm scores (see table 4 below) to set the level of work engagement.
Table 4. Norm score UBES-15 (N = 9.679).
Total score Very low <_1,93
Low 1,94 – 3,06 Average 3,07 – 4,66 High 4,67 – 5,53 Very high >_5,54
M
3,82
SD
1,10
RESEARCH ETHICS
18 PROCEDURE
Selection of the population was done by the nonprobability sampling method called virtual snowball sampling (i.e., referral sampling). The virtual snowball effect arises due to the fact that if social connections comment, like or share the post, their connections get to see the message too. The social networks Facebook and LinkedIn were used to reach potential participants. The researcher used personal social media profiles to distribute the survey among the private and professional network.
When someone decided to participate in the survey, it was explained on the website what the purpose of this research was, how long it took to participate, and then they were thanked in advance for their participation. Participants voluntarily shared their personal information, like gender, age, educational level, amount of work hours per week, and computer hours a day. It was made clear that the personal information would only be used for the purpose of this research.
When the items of the UBES were provided to the participants, the word “work engagement” was not included in the title or the items. This was done to avoid possible answer tendencies that could be the result of certain connotations with the word “work-engagement”. Instead, the neutral designation “work experience” has been chosen as it has been advised in the manual (Schaufeli & Bakker, 2003).
Preparatory to the A/B preference testing, the participant was explained that the outlined situations are related to work stress. The participants were asked to sympathise with these situations and then make a choice between a coaching message. The participant did not know which one of the coaching messages belonged to what type of coaching, because the coaching messages were
randomized to ensure that the order of the different coaching messages could not have any influence on the preference or selection. Participants were required to select one message they would like to receive from an online coach if they were in the situation of the scenarios.
19 DATA-ANALYSIS
The software program IBM SPSS Statistics 24 has been used to give answers on the research questions. To answer the first research question – the global preference of the employees for coaching style – the total number of times chosen for either Emotion-Focused or Solution-Focused messages was counted. The total number of count could be between 0 and 4, whereas 0 – 1 stands for ‘no preference’, 2 stands for ‘neutral’, and 3 - 4 for ‘preference’. This was done for both of the two coaching styles. Because there were four scenarios, the following outcomes were possible:
4 x Emotion-Focused 0 x Solution-Focused preference Emotion-Focused messages 3 x Emotion-Focused 1 x Solution-Focused preference Emotion-Focused messages 2 x Emotion-Focused 2 x Solution-Focused neutral (no clear preference)
1 x Emotion-Focused 3 x Solution-Focused preference Solution-Focused messages 0 x Emotion-Focused 1 x Solution-Focused preference Solution-Focused messages
The descriptive statistics of the total amount of employees per group in numbers (n) and percentages (%) were used for the analysis of the global preference of the sample of employees in this research.
To see if there is a difference between male and female employees (research question 2) in preference for Emotion-Focused coaching messages or Solution-Focused coaching messages, the group of participants was split by gender (male = 1, female = 2). The amount of times each coaching message was chosen was counted (n (%)) by gender and coaching style. To see if the differences between male and female in preference is statistical significant, the Chi-square (χ²) was executed. This non-parametric test is used to analyse group differences. When the Chi-square outcome was significant, the strength statistic called the Cramer’s V was followed. The Cramer’s V is the most common strength test used to test data with a significant Chi-square result (McHugh, 2013). The value of the Cramer’s V is a number between 0 and 1 that indicated how strongly the variables are associated, whereby the closer to the 1 the stronger the association (Field, 2013). Cohen (1988) uses the following outcome for correlation: .10 = weak, .30 = medium, and .50 = strong.
20 The Chi-square test was used to analyse differences between level of education (research question 4) and preference for coaching style. The levels of education have been subdivided into three categories, namely: low educational level (VMBO/MAVO/HAVO), medium (or average) level of education (MBO/VWO), and high educational level (HBO/WO). These seven levels and the division into the three categories are based on the Dutch educational system. When the Chi-square outcome was significant, the strength statistic called the Cramer’s V was followed.
In order to analyse whether the level of work engagement correlates with preference for a type of coaching style (research question 5) the one-way ANOVA was conducted. This statistic test was used to see if there were differences between the three groups (Emotion-Focused/Solution-Focused/ Neutral) on the factor of work engagement. Work engagement was measured with the UBES (Schaufeli & Bakker, 2003). The total score of each participant was calculated by summing the items and dividing them by 15 (total number of items). Then the total mean score per group was calculated with SPSS and used to test for significant differences between groups with the ANOVA. For interpretation of the total mean scores the norm scores in the manual of the UBES (table 4) were used. When the outcome of the ANOVA was significant, the effect size (R²) was calculated.
The data-analysis of which of the categories in Emotion-Focused coaching messages (Empathy/Awareness/Acceptance/Regulation of Emotion) and which of the categories in Solution-Focused coaching messages (Setting Goals/Self-Solving Skills/Practical Information/Active (Turn-to-Action)) appeal to the employees (research question 6 and 7), started by first conducting a total mean score per category. This was done by summing up the rating points per phrase in the category and then dividing this number by the amount of phrases placed under the particular category. The total mean score consists of a number between 1 to 5. To interpret the level of appeal for each category, the same 5-point rating scale was used as in the phrase rating in the A/B preference testing whereby the number 1 stands for ‘does not appeal at all’, 2 for ‘does not appeal’, 3 for ‘neutral’, 4 for ‘does appeal’, and 5 stands for ‘appeals very much’. The total mean score was rounded up to one decimal. To see if there were statistical differences in rating of the categories per group, the one-way ANOVA was executed. If significant differences were found between the groups, the exact post hoc Turkeys HSD-test (honestly significant difference) was followed to analyse which groups significantly differ from each other. The Turkeys HSD is the most familiar post hoc test and is best used when the means of all groups needs to be compared (Ellis, 2006).
21 RESULTS
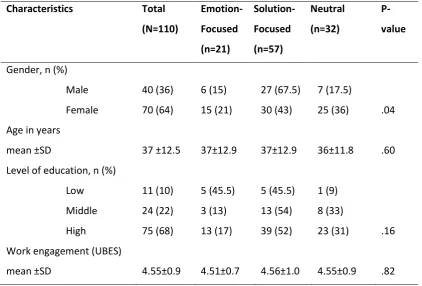
[image:21.595.70.493.247.533.2]Participants were 110 Dutch employees between the age of 23 till 65 with a payed job of more than 16 working hours per week. The mean age of the participants was 37 years (SD=12.5). 64% were female (n=70) 36% male (n= 40). The average educational level of the participants was high (68% ; HBO/WO), they work 36 hours a week (SD=7.7) of with on average work 6 hours per day (n=98, SD=1.9) behind the computer. The level of work engagement of the sample is average when compared with the norm scores. The characteristics of the sample are shown in table 5 below.
Table 5. Characteristics sample.
Characteristics Total
(N=110)
Emotion-Focused (n=21)
Solution-Focused (n=57)
Neutral (n=32)
P-value
Gender, n (%) Male Female
40 (36) 6 (15) 27 (67.5) 7 (17.5)
70 (64) 15 (21) 30 (43) 25 (36) .04
Age in years
mean ±SD 37 ±12.5 37±12.9 37±12.9 36±11.8 .60
Level of education, n (%) Low Middle High
11 (10) 5 (45.5) 5 (45.5) 1 (9)
24 (22) 3 (13) 13 (54) 8 (33)
75 (68) 13 (17) 39 (52) 23 (31) .16
Work engagement (UBES)
mean ±SD 4.55±0.9 4.51±0.7 4.56±1.0 4.55±0.9 .82
To answer research question one ‘what coaching style do employees prefer’, descriptive data analysis shows that 52% (n=57) of the employees have a preference for Solution-Focused coaching messages, 19% (n=21) of the respondents have reported having a preference for Emotion-Focused coaching messages, and 29% (n=32) has no clear preference (Neutral) for Emotion-focused or Solution-Focused coaching messages.
22 Figure 5. Percentage of male and female employees per preference group.
There is a significant difference in preference between male and female employees in preference for type of coaching (χ² (2)= 6.44, p = .04). In general male and female employees prefer Solution-Focused coaching. Female employees prefer Emotion-Solution-Focused coaching more than male employees. 36% of the female employees are indifferent (neutral) about their preference, which is more often than male employees (17.5%). The Cramer’s V strength test gives a value of .24, which indicates a weak correlation (Cohen, 1988) between gender and preference of coaching style.
The testing of the correlation of age and preference for coaching style (research question 3) was performed with the ANOVA. The mean age of the Emotion-Focused and Solution-Focused group was 37 years with a standard deviation of 12.9, and for the Neutral group 36 years with a standard deviation of 11.8. No statistically significant difference was found between age and preference [F(2,107) = 0.07, p = .93].
A Chi-Square test was performed to examine the relation between the preference in
coaching style and educational level (research question 4). Educational levels were divided into three categories (low/middle/high). Of the total sample 10% has an low educational level, 22% middle or medium level of education, and 68% of the sample is high educated. There was no statistically
significant differences found between type of preference and level of education in employees (χ²(4) = 6.51, p = .16). Educational level does not have an correlation in the preference for one of the two types of coaching styles.
15% 67,5% 17,5% 21% 43% 36% 0 10 20 30 40 50 60 70 80 90 100
Emotion-Focused Solution-Focused Neutral
23 Again the ANOVA was executed to analyse if work engagement has an correlation on the preference for type of coaching style (research question 5). The level of work engagement is average in all groups (Emotion-Focused 4.51±0.7, Solution-Focused 4.56±1.0, Neutral 4.55±.09) with total mean scores between 3.07 – 4.66 (see norm scores UBES, table 4). No statistically significant
relationship was found [F(2,107) = 0.02, p = .98]. The level of work engagement as measured with the UBES does not differ in the preference groups.
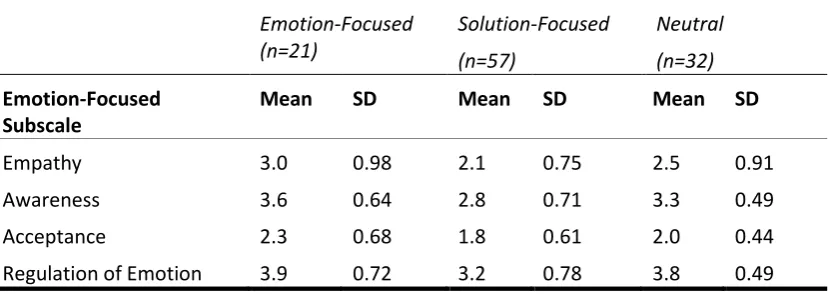
To give an answer to research question 6; ‘which of the four categories in Emotion-Focused coaching messages (Empathy, Awareness, Acceptance, or Regulation of Emotion) appeal to the employees’, analysis of the subscales of Emotion-Focused messages has been conducted.
[image:23.595.75.490.416.563.2]Table 6 below shows the total mean scores of the preference groups plus standard deviations per category in the Emotion-Focused coaching style. The table shows that employees with a preference for Emotion-Focused coaching messages give overall higher ratings on the categories of this coaching style compared to the employees with a preference for Solution-Focused or Neutral preference. To see if differences in rating between the groups are significant, the one-way ANOVA was conducted.
Table 6. Total mean scores and standard deviation (SD) of the subscales in Emotion-Focused coaching messages per preference group.
Emotion-Focused (n=21)
Solution-Focused (n=57)
Neutral (n=32)
Emotion-Focused Subscale
Mean SD Mean SD Mean SD
Empathy 3.0 0.98 2.1 0.75 2.5 0.91
Awareness 3.6 0.64 2.8 0.71 3.3 0.49
Acceptance 2.3 0.68 1.8 0.61 2.0 0.44
Regulation of Emotion 3.9 0.72 3.2 0.78 3.8 0.49
There was a statistically significant difference between groups as determined by one-way ANOVA (F(2,107) = 9.08, p = .00) on the Empathy category. A Turkey post hoc test revealed that the appealing of the Empathy category was statistically significant higher in rating in the Emotion-Focused group (3.0 ± 0.98 points, p = .00) compared to the Solution-Emotion-Focused group (2.1 ± 0.75 points). There was no statistically significant difference in rating points between the Neutral group and the Emotion-Focused (p = .11) and Solution-Focused groups ( p = .07).
24 was statistically significant higher in rating points in the Emotion-Focused group (3.6 ± 0.64 points, p = .00) compared to the Neutral group (3.3 ± 0.49) and compared to the Solution-Focused group (2.8 ± 0.71 points, p = .01). There was no statistically significant difference between the Neutral group and the Emotion-Focused (p = .30) group.
There was a statistically significant difference between groups as determined by one-way ANOVA (F(2,107) = 4.77, p = .01) on the Acceptance category. A Turkey post hoc test revealed that the appealing of the Acceptancecategory was statistically significant higher in rating points in the Emotion-Focused group (2.3 ± 0.68 points, p = .01) compared to the Solution-Focused group (1.8 ± 0.61 points). There was no statistically significant difference between the Neutral group and the Emotion-Focused (p = .23) and Solution-Focused groups ( p = .34).
Once more, there was a statistically significant difference between groups (F(2,107) = 13.61, p = .00) on the Regulation of Emotion category. A Turkey post hoc test revealed that the appealing of the Regulation of Emotion category was statistically significant higher in rating points in the Emotion-Focused group (4.0 ± 0.72 points, p = .00) compared to the Solution-Emotion-Focused group (3.2 ± 0.78 points) and the Neutral group (3.8 ± 0.49). There was no statistically significant difference between the Neutral group and the Emotion-Focused group (p = .69).
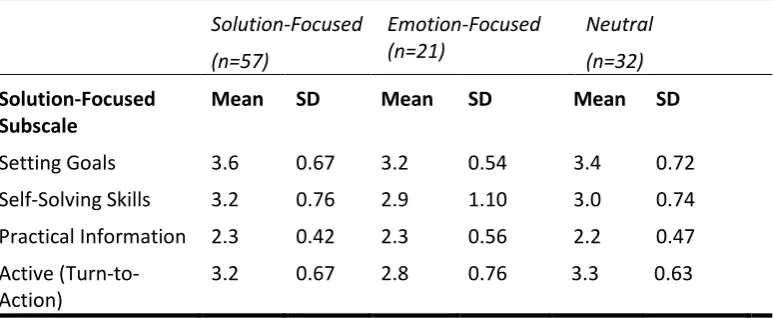
[image:24.595.77.464.577.736.2]For the subscales in Solution-Focused messages (research question7); ‘which of the four categories in Solution-Focused coaching messages (Setting Goals, Self-Solving Skills, Practical Information, or Active (Turn-to-Action)) appeal to the employees’, the same analysis has been executed as the previous with the Emotion-Focused subscales. Table 7 gives an overview of the total mean scores on each category of the Solution-Focused coaching messages of all the groups plus the standard deviations.
Table 7. Mean scores and standard deviation (SD) of the subscales in Emotion-Focused coaching messages per preference group.
Solution-Focused (n=57)
Emotion-Focused (n=21)
Neutral (n=32)
Solution-Focused Subscale
Mean SD Mean SD Mean SD
Setting Goals 3.6 0.67 3.2 0.54 3.4 0.72
Self-Solving Skills 3.2 0.76 2.9 1.10 3.0 0.74
Practical Information 2.3 0.42 2.3 0.56 2.2 0.47
Active (Turn-to-Action)
25 The table shows that employees in the Solution-Focused group give slightly higher ratings per
category compared to the other two preference groups. To see if differences in rating between the groups are significant, the one-way ANOVA was conducted.
There was a significant difference between groups (F(2,107) = 4.35, p = .01) for the category of Setting Goals. A Turkey post hoc test revealed that the appealing of the Setting Goals category was statistically significant higher in rating in the Solution-Focused group (3.6 ± 0.64 points, p = .01) compared to the Emotion-Focused group (3.2 ± 0.54 points). There was no statistically significant difference between the Neutral group and the Emotion-Focused (p = .41) and Solution-Focused groups (p = .23).
There was no significant difference between groups (F(2,107) = 0.59, p = .55) in the Self-Solving Skills category, and in the Practical Information category (F(2,107) = 1.14, p = .32) as determined by one-way ANOVA.
Again, a significant difference was found between groups (F(2,107) = 4.79, p = .01) this time on the Active (Turn-to-Action) category. A Turkey post hoc test revealed that the appealing of the Active (Turn-to-Action) category is statistically significant higher in rating points in the Solution-Focused group (3.3 ± 0.63 points, p = .01) compared to the Emotion-Focused group (2.8 ± 0.76 points). There was no statistically significant difference between the Neutral group and the Emotion-Focused (p = .07) and Solution-Focused groups (p = .73).
In conclusion of the results of which of the 4 categories in Emotion-Focused (Empathy, Acceptance, Awareness, and Regulation of Emotion) and which of the 4 categories in Solution-Focused (Setting Goals, Self-Solving Skills, Practical Information, and Active) coaching messages appeal to the employees, analysis reveals that the categories Empathy and Acceptance of the Focused coaching style appeal more to the employees with a preference for Emotion-Focused coaching messages compared to the group of employees with a preference for Solution-Focused coaching messages and the group of employees with no clear preference for one or the other. It appears that employees with a preference for Emotion-Focused messages and the group of employees in the Neutral group give higher ratings on the phrases of the Awareness category and Regulation of Emotion, compared to the employees with a preference for Solution-Focused
26 DISCUSSION
Based on the results, the answer of the research question: ‘what type of coaching do employees prefer when work related stress occurs’, is that 52% indicate having a preference for Solution-Focused. 19% of the sample have a preference for Emotion-Focused coaching and the remaining 29% has no clear preferences for either one of the two types of coaching. Because this research focusses on the question of how an online coaching tool should be set up, the subsequent aim was to examine socio-demographic characteristics such as gender, age, and level of education within the preference groups. Also the level of work engagement was measured to investigate if engaged employees prefer different coaching than less engaged employees.
When it comes to differences in gender, male employees report having a preference for the Solution-Focused coaching style (67.5%). Female employees also report having a preference for this coaching style (43%). The Emotion-Focused coaching style is preferred among 15% of male
employees compared to 21% of the female employees. This indicates that women have a higher preference for Emotion-Focused coaching than men. Merely 36% of the female employees report having a Neutral preference compared to 17.5% of the male employees, which means that they do not prefer one coaching style over the other in particular. Other outcomes of this study show that there are no significant differences between preference for coaching style and age, educational level or level of work engagement.
When analysing the categories within the coaching styles it can be conclude that employees with a preference for Emotion-Focused coaching give significant higher ratings of all 4 categories (Empathy/Acceptance/Awareness/Regulation of Emotion) within this coaching style compared to the Solution-Focused preference group. It is remarkable that when analysing the categories in the Solution-Focused coaching style it shows that 2 (Setting Goals and Active) of the 4 categories (Setting Goals/Self-Solving Skills/Practical Information/Active) appeal significantly more to employees with a preference for Solution-Focused coaching compared to the other groups. The remaining categories of Self-Solving Skills and Practical Information were rated more or less the same among all
preference groups.
27 The outcome that male employees prefer Solution-Focused coaching supports the findings of
Folkman and Lazarus (1980) and also of Bakker and Berenbaum (2007). Other research, for example Stanton et al. (2000), are consistent with the finding of this study that women are more engaged in the emotional-approach of coping then men. Based on literature search it was expected that engaged employees would prefer Solution-Focused coaching messages (Bakker A. B., Schaufeli, Leiter, & Taris, 2008; Luthans, Norman, Avolio, & Avey, 2008). To a certain extent this assumption can be confirmed with the outcomes of this research, because the overall preference is for the Solution-Focused coaching style and the sample of employees were highly engaged (M = 4.55, SD = 0.9).
Limitation of the study was the low variation of (socio-demographic) characteristics of the sample. The sample in this research contains for the most part women with a high educational level in their mid-twenties or early thirties. Which means that the outcomes of this explorative research therefore can only make statements about the preference for coaching style regarding highly educated, young, female employees. Furthermore, the sample contains of high engaged employees which can cause a distortion of the results. It might be that high engaged employees are less able to empathize with the stressful situations suggested in the scenarios because they may not perceive them as stressful situations. For future research it is recommended to use other sampling methods, for example the quota sampling method. This sampling procedure ensures that a certain
characteristic of a sample will be represented to the exact extent that is desired (Acharya, Prakash, Saxena, & Nigam, 2013).
One of the strengths of this research is gathering of detailed information about the two coaching styles to create the coaching messages and their corresponding categories. Methods, strategies, and techniques mentioned in relevant literature were used to gain insight in the needs for the content of the textual coaching messages and for the subdivision of the phrases into categories. The categories of Emotion-Focused and Solution-Focused coaching style have been conducted with great care and consideration. The categories of the Emotion-Focused coaching fit the content of this style since employees within this preference group give significant higher ratings on all 4 categories.
Interesting finding when analysing the categories in the Solution-Focused coaching style is that only the 2 (Setting Goals and Active) of the 4 categories appeal significant more to the
28 active components within the Solution-Focused coaching style. By conducting interviews with mental health psychologists, it can be further investigated what the specific elements and working
ingredients are of the coaching style since they use the different styles in practice.
Another strength is the use of the CeHRes roadmap (van Gemert-Pijnen, et al., 2011) which is a proven worthy instrument for the development of eHealth. The Roadmap has been used as a guideline for this research. This research mainly focused on the first two steps of the roadmap, namely the contextual inquiry and the value specification. In this steps the problem and needs are addressed. The possible end users have indicated which coaching style they prefer and what appeals to them within these styles. By involving the possible end users in the research process of developing an online coaching tool for the reduction of work-related stress, the first step towards well-designed persuasive technology was made. Well-designed persuasive technology can increase adherence to the intervention for they provide anonymity, high reach, high data capacity, have access to situations human persuaders are not allowed or able to be, and has the possibility to communicate through multiple routes and platforms (van Gemert - Pijnen & Kelders, 2013). These possibilities of the routes and platforms of communication should be further explored in a follow-up research. Because even though this research used textual coaching messages, it is not suggested that textual communication is the proper route for reaching the user in relation to eCoaching. It could be that the involvement of visuals (e.g., illustration, motion picture) may be more efficient and/or appealing to the user or for particular user groups.
29 REFERENCES
Acharya, A. S., Prakash, A., Saxena, P., & Nigam, A. (2013). Sampling: Why and How of it? Indian Journal of Medical Specialities, 4(2), 330-333.
American Psychological Association. (2009). Stress in America 2009. Retrieved from http://www.apa.org/news/press/releases/stress-exec-summary.pdf
Arnsten, A. (2009). Stress signaling pathways that impair prefrontal cortex structure and function.
Nature Review Neuroscience, 10(6), 410-422.
Baker, J. P., & Berenbaum, H. (2007). Emotional approach and problem-focused coping: A comparison of potentially adaptive strategies. Cognition and Emotion, 21(1), 95-118. Bakker, A. B., Demerouti, E., & Sanz-Vergel, A. (2014). Burnout and Work Engagement: The JD-R
Approach. Annual Review of Organizational Psychology and Organizational Behavior, 389-411.
Bakker, A. B., Schaufeli, W. B., Leiter, M. P., & Taris, T. W. (2008). Work engagement: An emerging concept in occupational health psychology. Work & Stress, 22(3), 187-200.
Bakker, A., & Demerouti, E. (2007). The job demands-resources model: state of the art. Journal Management Psychology, 309-328.
Bakker, A., Demerouti, E., & Euwema, M. (2005). Job resources buffer the impact of job demands on burnout. Journal of Occupational Health Psychology, 70-80.
Bakker, A., Hakanen, J., Demerouti, E., & Xanthopoulou, D. (2007). Job resources boost work engagement particulary when job demands are high. Journal of Educational Psychology, 74-84.
Bakker, A., Schaufeli, W., Sixma, H., Bosveld, W., & Van Dierendonck, D. (2000). Patient demands, lack of reciprocity, and burnout: a five-year longitudinal study among general practitioners.
Journal of Organic Behavior, 25-41.
Bakker, J., & Bannink, F. (2008). Oplossingsgerichte therapie in de psychiatrische praktijk. Tijdschrift voor Psychiatrie, 55-59.
Bannink, F. (2006). De geboorte van oplossingsgerichte cognitieve gedragstherapie. Gedragstherapie, 171-184.
Bannink, F. (2010). Oplossingsgerichte therapie. GZ-Psychologie, 10-15.
Berkman, E., & Lieberman, M. (2009). Using neuroscience to broaden emotion regulation:
Theoretical and methodological considerations. Social and Personality Psychology Compass, 475-493.
30 Bond, F., & Bunce, D. (2000). Mediators of change in emotion-focused and problem-focused worksite
stress management interventions. Journal of Occupational Health Psychology, 5(1), 156-163. Byles, J., Gallienne, L., Blyth, F., & Banks, E. (2012). Relationship of age and gender to the prevalence and correlates of psychological distress in later life. International Psychogeriatrics, 24, 1009-1018.
Cohen, J. (1988). Statistical power analysis for the behavioral sciences. Hillsdale, NJ: Erlbaum. Demerouti, E., Bakker, A., Janssen, P., & Schaufeli, W. (2001). Burnout and engagement at work as a
function of demands and control. Scandinavian Journal of Work, Environment & Health, 279-286.
Demerouti, E., Bakker, A., Nachreiner, F., & Ebbinghaus, M. (2002). From mental strain to burnout.
European Journal of Work and Organizational Psychology, 11(4), 423-442. Doarn, C., & Merrell, R. (2013). There's an app for that. Telemed J E Health, 811-812.
Ellis, J. L. (2006). Statistiek voor de psychologie: GLM en non-parametrische toetsen. Amsterdam: Uitgeverij Boom.
Ellis, J. L. (2006). Statistiek voor de psychologie: Variantieanalyse. Amsterdam: Uitgeverij Boom. Felton, B., Revenson, T., & Hinrichsen, G. (1984). Stress and coping in the explanation of
psychological adjustment among chronically ill adults. Social Science & Medicine, 18, 889-898.
Ferris, G. E. (1958). The k-visit method of consumer testing. Biometrics, 39-49. Field, A. (2013). Discovering Statistics with IBM SPSS. Newbury Park, CA: Sage.
Fogg, B. (2003). Persuasive Technology: Using computers to change what we think and do. San Francisco: CA: Morgan Kaufmann Publishers.
Folkman, S., & Lazarus, R. S. (1980). An Analysis of Coping in a Middle-Aged Community Sample.
Journal of Health and Social Behavior, 21(3), 219-239.
Goleman, D., Boyatzis, R., & McKee, A. (2002). Primal leadership: learning to lead with emotional intelligence. Boston, MA: Harvard Business School Press.
Greenberg, L. S., & Safran, J. D. (1989). Emotion in Psychotherapy. American Psycholist, 44(1), 19-29. Hawkins, R. P., Kreuter, M., Resnicow, K., Fishbein, M., & Dijkstra, A. (2008). Understanding tailoring
in communicating about health. Health Education Research, 23(3), 454-466.
Huckvale, K., Car, M., Morrison, C., & Car, J. (2012). Apps for asthma self-management: a systematic assessment of content and tools. BMC Medicine, 144.
Intille, S. (2003). Ubiquitous Computing Technology for just-in-time Motivation of Behavior Change.
Retrieved from Proceedings of the UbiHealth 2003:
31 Kelders, S., Pots, W., Oskam, M., Bohlmeijer, E., & van Gemert-Pijnen, J. (2013). Development of a
web-based intervention for the indicated prevention of depression. BMC Medical Informatics and Decision Making, 13(1), 26.
Kraft, P., Drozd, F., & Olsen, E. (2008). Digital Therapy: Addressing Willpower as Part of the Cognitive-Affective Processing System in the Service of Habit Change. International Conference on Persuasive Technology, 177-188.
Lazarus, R. S. (2000). Toward better research on stress and coping. American Psychologist, 665-673. Lee, R., & Ashfort, B. (1996). A meta-analytic examination of the correlates of the three dimensions
of job burnout. Journal of Applied Psychology, 23-33.
Lewis, I., Watson, B., & White, K. M. (2016). The Step Approach to Message Design and Testing (SatMDT): A conceptual framework to guide the development and evaluation of persuasive health messages. Elsevier, 309-314.
Lieberman, M., Eisenberger, N., Crockett, M., Tom, S., Pfeifer, J., & Way, B. (2007). Putting feelings into words: Affect labeling disrupts amygdala activity in response to affective stimuli.
Psychological Science, 18(5), 421-428.
Lieberman, M., Inagaki, T., Tabibnia, G., & Crockett, M. (2011). Subjective responses to emotional stimuli during labeling, reappraisal, and distraction. Emotion, 11(3), 468-480.
Luthans, F., Norman, S., Avolio, B., & Avey, J. (2008). The mediating role of psychological capital in the supportive organizational climate - employee performance relationship. Journal of Organizational Behavior, 29, 219-238.
Maslow, A. (1943). A Theory of Human Motivation. Psychological Review, 370-396.
McCrae, R. R. (1982). Age Differences in the Use of Coping Mechanisms. Journal of Gerontology, 37(4), 454-460.
McHugh, M. L. (2013). The Chi-square test of independence. Biochemia Medica, 23(2), 143-149. Ministerie van Sociale Zaken en Werkgelegenheid. (2016). Arbobalans. Leiden: TNO.
Montgomery, A., Peeters, M., Schaufeli, W., & Den Ouden, M. (2003). Work-home interference among newspaper managers: Its relationship with Burnout and engagement. Anxiety, Stress & Coping, 195-211.
Myer, L., Stein, D., Grimsrud, A., Seedat, S., & Wiliams, D. (2008). Social determinants of
psychological distress in a nationally-representative sample of South African adults. Social Science & Medicine, 66, 1828-1840.
Nass, C., & Moon, Y. (2000). Machines and mindlessness: Social responses to computers. Journal of Social Issues, 56(1), 81-103.
32 Naudé , J., & Rothmann, S. (2006). Work-related well-being of emergency workers in South Africa.
South African Journal of Psychology, 63-81.
Nijland, N., & Verhoeven, F. (2013). Human-Centered Design in eHealth. In J. van Gemert-Pijnen, O. Peters, & H. Ossebaard, Improving eHealth (pp. 49-64). Den Haag: Eleven International Publishing.
O'Connell, B. (2001). Solution-Focused Stress Counselling. Londen: SAGE Publications.
Oinas-Kukkonen, H., & Harjumaa, M. (2009). Persuasive Systems Design: Key Issues, Process Model, and System Features. Communications of the Association for Information Systems, 24(28), 486-500. Retrieved from http://aisel.aisnet.org/cais/vol24/issl/28
Pandey, A., Hasan, S., Dubey, D., & Sarangi, S. (2013). Smartphone Apps as a Source of Cancer Information: Changing Trends in Health Information-Seeking Behavior. Journal of Cancer Education, 138-142.
Papagni, S., Benetti, S., Arulanantham, S., McCory, S., McGruire, P., & Mechelli, A. (2011). Effects of stressful life events on human brain structure: A longitudinal voxel-based morphometry study. Stress, 227-232.
Plotnik, R., & Kouyoumdjian, H. (2013). Introduction to Psychology. Boston: Cengage Learning, Inc. Richardson, K., & Rothstein, H. (2008). Effects of occupational stress management intervention
programs: A meta-analysis. Journal of Occupational Health Psychology, 13(1), 69-93. Rogers, C. (1946). Significant aspects of client-centered therapy. American Psychologist, 415-422. Rosser, B., & Ecclecston, C. (2011). Smartphone applications for pain management. Journal
Telemedicine and Telecare, 308-312.
Schaufeli, W. B., Bakker, A. B., & van Rhenen, W. (2009). How changes in job demands and resources predict burnout, work engagement, and sickness absenteeism. Journal of Organizational Behavior, 30(7), 893-917.
Schaufeli, W., & Bakker, A. (2003). UBES: Utrechtse Bevlogenheidschaal Voorlopige Handleiding versie 1. Universiteit Utrecht: Sectie Psychologie van Arbeid, Gezondheid en Organisatie.
Scheff, T. (1979). Catharsis in healing, ritual, and drama. Berkeley: University of California Press. Scheier, M., & Carver, C. (1977). Self-focused attention and the experience of emotion: Attraction,
repulsion, elation, and depression. Journal of Personality and Social Psychology, 35, 625-636. Selmer, J. (1999). Effects of coping strategies on sociocultural and psychological adjustment of
Western expariate managers in the PRC. Journal of World Business, 34(1), 41-51.
33 Stahl, G., & Caligiuri, P. (2005). The effectiveness of expatraite coping strategies: The moderating role
of cultural distance, position level, and time on the international assignment. Journal of Applied Psychology, 90, 603-615.
Stanton, A., Kirk, S., Cameron, C., & Danoff-Burg, S. (2000). Coping through emotional approach: Scale construction and validation. Journal of Personality and Social Psychology, 78, 1150-1169.
Talala, K., Huurre, T., Aro, H., Martelin, T., & Prättälä, R. (2008). Socio-demographic differences in self-reported psychological distress among 25- to 64- year-old Finns. Social Indicators Research, 86, 323-335.
Tamres, L. K., Janicki, D., & Helgeson, V. S. (2002). Sex Differences in Coping Behavior: A Meta-Analytic Review and an Examination of Relative Coping. Personality and Social Psychology Review, 6(1), 2-30.
van Gemert - Pijnen, J., & Kelders, S. (2013). Persuasive eHealth technology. In J. van Gemert - Pijnen, O. Peters, & H. Ossebaard, Improving eHealth (pp. 87-109). Den Haag: Eleven International Publishing.
van Gemert-Pijnen, J., Nijland, N., van Limburg, M., Ossebaard, H., Kelders, S., Eysenbach, G., & Seydel, E. (2011). A holistic framework to improve the uptake and impact of eHealth technologies. Journal of Medical Internet Research, 13(4), 111.
Wentzel, J., van der Vaart, R., Bohlmeijer, E. T., & van Gemert-Pijnen, J. E. (2016). Mixing Online and Face-to-Face Therapy: How to Benefit From Blended Care in Mental Health Care. JMIR Mental Health, e9.
Xanthopoulou, D., Bakker, A., Demerouti, E., & Schaufeli, W. (2007). The role of personal resources in the job demands-resources model. International Journal of Stress Management, 21-41. Yazar, K. (2010). Emotion-Focused Therapy: An Overview. Turkish Psychological Counseling and
35 APPENDIX B – SCENARIOS AND COACHING MESSAGES
Translated from Dutch to English
Scenario 1
Monday morning, 9.10 a.m.
It is Monday morning and the employer comes to you with the announcement that you have to take additional work this week, because of a sick colleague. You begin to feel the work pressure and the eCoach notes a change in the physical measurement (increased heart rate) and sends a push-message to a mobile device (smartphone, tablet, laptop).
Which messages has your preference in this situation?
A. Your heart rate is way too high, this must be unpleasant. Experiencing stress does not only affects your physical health but may also have mental impact. Acknowledge negative emotions and thoughts and try to accept them.
B. Your heart rate is higher than normal. What rating do you give the experienced stress on a scale of 1 to 10? Whereby 1 stands for ‘no stress’ and 10 for ‘tremendously stressed’. Think about what you could do to lower this number.
Scenario 2
Monday morning, 11:20 a.m.
At the end of the morning you receive an e-mail with the announcement that a certain task – one you are not looking forward to - needs to be finished with urgency. You consult the eCoach for help and support.
Which of the following messages speaks to you the most?
A. How bothersome that you experience stress. Allow yourself to notice what is happening to your body when you are stressed. Perhaps you notice tension in the shoulders or that your breath is more shallow than usual. Try to bring your full attention to your body for a couple of minutes and try to release observable tension.
B. Setting priorities helps to create overview of tasks. Get organized and make a plan to induce productivity. Do this by using the S.M.A.R.T. principle. A goal needs to be Specific,
36 Scenario 3
Monday afternoon, 13:00 p.m.
It is early in the afternoon and you notice that you cannot keep you focus on certain tasks. Because you have consulted the eCoach two times earlier this day, the system sends a message asking how stressed you feel at the moment. You state that you are suffering from lack of concentration.
Which message would you prefer in this situation?
A. How awful that you cannot concentrate. This must be frustrating. Take a moment of rest by doing a short breathing exercise for 2 or 5 minutes. This helps to relieve unpleasant physical tension and improves concentration.
B. Try to imagine the moments when you were concentrated at work and take a good look at the situation. What are the differences between the times that you could concentrate at work and now? Visualize the times you managed to focus and it will help you to do it now once again.
Scenario 4
Monday afternoon, 15:15 p.m.
You have less than two hours to complete the urgent task and a lot of work still needs to be done. The smart watch indicates a psychical reaction of stress. You receive a message.
Which message has your preference?
A. Accept that u feel tense and embrace all negative and positive emotions and thoughts you experience right now. Resume your work in consciousness and be in harmony with the moment, right here and now.
37 Emotion-Focused Messages
1. Your heart rate is way too high, this must be unpleasant. Experiencing stress does not only affects your physical health but may also have mental impact. Acknowledge negative emotions and thoughts and try to accept them.
2. How bothersome that you experience stress. Allow yourself to notice what is happening to your body when you are stressed. Perhaps you notice tension in the shoulders or that your breath is more shallow than usual. Try to bring your full attention to your body for a couple of minutes and try to release observable tension.
3. How awful that you cannot concentrate. This must be frustrating. Take a moment of rest by doing a short breathing exercise for 2 or 5 minutes. This helps to relieve unpleasant physical tension and improves concentration.
4. Accept that u feel tense and embrace all negative and positive emotions and thoughts you experience right now. Resume your work in consciousness and be in harmony with the moment, right here and now.
Solution-Focused Messages
1. Your heart rate is higher than normal. What rating do you give the experienced stress on a scale of 1 to 10? Whereby 1 stands for ‘no stress’ and 10 for ‘tremendously stressed’. Think about what you could do to lower this number.
2. Setting priorities helps to create overview of tasks. Get organized and make a plan to induce productivity. Do this by using the S.M.A.R.T. principle. A goal needs to be Specific,
Measurable, Attainable, Relevant and Time-bound.
3. Try to imagine the moments when you were concentrated at work and take a good look at the situation. What are the differences between the times that you could concentrate at work and now? Visualize the times you managed to focus and it will help you to do it now once again.