Abstract— Human relationships in the workplace consist of
formal networks involved in work and informal networks away from work. Generally, workplaces based on formal networks are expected to progress efficiently in workplaces where informal networks work well. However, so far, few reports describe the efficiency of the workplace by combining the two networks. Therefore, in this research, a method to estimate the efficiency of the workplace by considering the relationship between the two networks is proposed. Firstly, from the results obtained by analyzing the relationship between efficiency of teams engaged in service operations and human relationships, it is pointed out that the factors related to efficiency of work are network that crosses job positions and a network that crosses the workplace. Furthermore, based on this result, a method to estimate the efficiency of the workplace is proposed.
By using the proposed method, it is possible to create an efficient team.
Index Terms— Informal Network, Formal Network,
Workplace Efficiency, Network Analysis Method
I. I
NTRODUCTIONuman relations in the workplace consist of formal networks and informal networks [1]. A formal network is formed top-down to achieve its workplace objectives. On the other hand, an informal network occurs naturally due to personal relationships of individuals. In this way, the two networks differ not only in their roles but also in the formation process, but the informal network is said to affect the formal network [2]. For example, as a concrete example, Hawthorne experiment is known [3]. The productivity of workers was thought to be influenced by the environment of the workplace, but from the results of this experiment it became clear that it is influenced by human relationships and psychological factors in the workplace rather than the environment. Therefore, it is effective to clarify the relationship between the formal network and the informal network, and to utilize the relationship between the two networks for organization formation in the workplace.
However, in the past, such studies have not been done sufficiently [4][5][6].
For example, as a research focusing on the relationship between informal human relationships and productivity, there is a report that analyzes the role that informal leaders
Manuscript received January 8, 2018; revised February 11, 2018.
Atsushi Shimoda is with Chiba Institute of Technology, 2-17-1 Tsudanuma, Narashino City, Chiba, Japan (e-mail: see http://www.shimodalab.it-chiba.ac.jp/).
Takumi Igarashi is with Chiba Institute of Technology, 2-17-1 Tsudanuma, Narashino City, Chiba, Japan.
play in improving efficiency at production sites [7]. In this report, focusing on the fact that the informal leader has the effect of spreading knowledge to the workplace, the method of specifying the leader and the effect of improving the work efficiency are reported. However, this study focuses on the active informality of individual informal exchanges, and does not consider informal networks such as who has exchanges with anyone. As a research focusing on informal networks, for example, there is a report that extracts informal networks from corporate SNS and compares them with formal networks [8]. However, when analyzing the informal network, this research focuses on only the number of exchanges and the number of people without considering the characteristics of the person to be interacted. Furthermore, in the analysis of the formal network, only the leader is focused on, and members constituting the organization are not considered.
The purpose of this research is to measure workability of the workplace by paying attention to the informal network. In order to achieve this objective, consider the organizational hierarchy and the workplace in formal networks of partners who have not been taken into consideration in the analysis of informal networks.
II. R
ESEARCHS
UBJECTANDP
ROBLEMS
ETTINGA. Analytical method of human relations in the workplace In this section, the analysis method of human relationships in the workplace will be explained in the order of visualization and quantification.
(1) Visualization of human relations
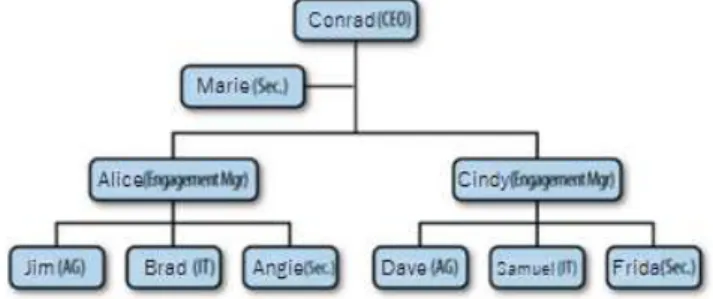
As mentioned above, human relationships in the workplace can be roughly divided into formal networks and informal networks. As a method to illustrate the formal network, the organization chart shown in Fig. 1 is common [9]. As shown in the figure, it is common to illustrate persons responsible for each workplace in descending order of positions and to show the names of individuals belonging to the workplace. From this figure, it is possible to grasp the job position and workplace for individuals. On the other hand, as a visualization method of informal network, a network diagram as shown in Fig. 2 is used [9]. As shown in the figure, it is common to express an individual as a node, a human relationship as an edge connecting a node and a node. In visualization of informal networks, it is common not to distinguish individual attributes, and to further consider node placement. In addition to the diagrams, there are cases
Proposal of Estimation Method for Workplace Efficiency Focusing on Informal Network
Atsushi Shimoda and Takumi Igarashi
H
where the nodes are annularly arranged so that the edges are displayed more easily.
(2) Quantification of human relations
Network analysis is a method to quantify human relations [9]. In network analysis, various objects are expressed as network diagrams and their structural features are quantified.
As an index of network analysis, there are centrality expressing the characteristics of individual nodes (individuals) and cluster coefficients representing characteristics of the entire network (workplace). The centrality is an index showing how central each node is in the network, and there is degree centrality, closeness centrality, betweenness centrality, and the like. The degree centrality is an index that highly appreciates nodes having more relations in the network. Closeness centricity is an index that highly appreciates nodes that are close in distance to other nodes in the network. Betweenness centrality is an index that highly appreciates nodes that mediate more nodes in the network.
On the other hand, the cluster coefficient indicates the ratio at which nodes adjacent to a certain node are adjacent nodes.
For example, from an individual's viewpoint, if the acquaintances are acquaintances, the cluster coefficient will be high. Cluster coefficients represent network cohesiveness, and organizations with higher coefficients have higher intimacy.
B. Estimation of efficiency considering informal network and workplace relationship
In order to grasp the efficiency of the workplace, human relation that combines both formal and informal is important, and analysis considering the relationship between both is required. For this purpose, as described above, formal
networks are represented by organization charts and informal networks are grasped by network analysis. However, the two networks are often handled separately. For this reason, there is room for discussion on a method of analyzing human relations considering the relationship between the two networks.
In this research, we propose a method to grasp the influence of the informal network in the workplace based on formal human relations and estimate the influence. In addition, by using this estimation method, a method for grasping efficiency of the workplace is proposed.
III. F
ACTORA
NALYSIS OFE
FFICIENCY OFW
ORKPLACEA. Projection of network diagram to coordinates
In order to analyze the characteristics of the efficiency of the workplace, a projection method of the network diagram to the coordinates shown in Fig. 1 was devised. In the conventional network diagram shown in Fig. 2, it is difficult to grasp the connection of the edges in consideration of the job position and workplace of the node. Therefore, by comparing Fig. 1 and Fig. 2, a method of visualizing both at the same time was investigated. As a result, a projection method of the network diagram to the coordinates as shown in Fig. 3 was devised. In order to visualize the framework of the organization chart of Fig. 1, the vertical axis of the figure is assigned job position and the horizontal axis is set to the workplace. The network diagram of Fig. 2 is superimposed on this. At that time, each node (individual) is placed in the corresponding job position and workplace. This figure makes it possible to visualize the informal network in consideration of the job position and workplace of the node, which has not been taken into consideration in the past. In other words, paying attention to edges, it is possible to grasp which hierarchy of positions are connected. Moreover, it is also grasped whether it is an edge connecting the same workplace or an edge that crosses the workplace.
B. Analysis of efficiency of workplaces using network diagram projection method to coordinate
(1) Workplace to be analyzed
The efficiency of workplace was analyzed using the
Fig. 1. Organization Chart. The organization chart is common to illustrate the formal network. From this figure, it is possible to grasp the job position and workplace for individuals.
Fig. 2. Network diagram. The network diagram is common to illustrate the informal network. In this diagram, it is common not to distinguish individual attributes, and to further consider node placement.
a b
Job position
Workplace
A E
B
D C
F
Fig. 3. Projection of network diagram to coordinates. The vertical axis of the figure is assigned job position and the horizontal axis is set to the workplace.
The network diagram is superimposed on this. This figure makes it possible to visualize the informal network in consideration of the job position and workplace of the node.
network diagram projection method to the coordinates. The workplace to be analyzed is the cooking work and the customer service of a certain family restaurant. In this workplace, a person in charge of customer service receives an order from the customer and takes over to the person in charge of cooking. After that, customer satisfaction is achieved by the customer service personnel providing the dish quickly to the customer. In this way, communication is required, so it is a workplace suitable for analysis. Fig. 4 shows the human relations of the workplace consisting of 23 members. Information on the informal network was created based on an interview with employee D. On the vertical axis of the figure, the positions of the five stages from the top to the bottom are indicated as captains, trainers, level A, level B, level C in the order of experts. The horizontal axis shows the workplace, the left side shows the cooking work and the right side shows the customer service. Communication between different workplaces is required for smooth task execution.
(2) Selection of analysis target team
In the analysis, teams (4 kitchens, 4 hospitals, a total of 8 people) working at the same time from the 23 people shown in Figure 4 were selected. Here, as the members of the team are changed, the network structure of human relations also changes. Therefore, by comparing the efficiency of different
network structures, the relationship between network structure and efficiency of operation can be analyzed.
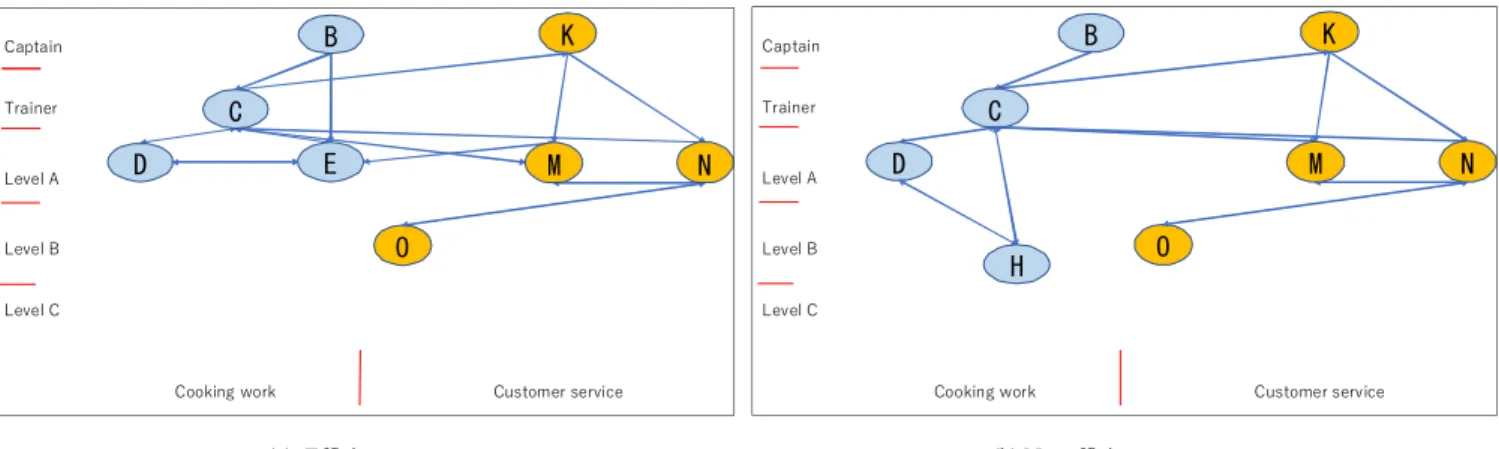
Efficiency of operation was evaluated by interviewing employee D. For this reason, teams analyzed this time always include Employee D. Fig. 5 shows the comparison of structure of informal network between an efficient team and a not efficient team. Fig. 5 (a) is a team that is efficient for employee D to work and Fig. 5 (b) is a not efficient team to work.
(3) Analysis result
First, the difference between the two figures (a) and (b) of Fig. 5 was examined. The difference between them is that employee E in figure (a) is replaced with employee H in figure (b). For employee E, edges are connected not only to employee D in the same workplace but also to employee M in different workplaces. In addition, Employee E is also connected to Captain B and Trainer C. On the other hand, the employee H has an edge between the employee D and the employee C, but there is no connection with the workplace of the customer service. In summary, the employee E in Fig. 5 (a) has an edge between the employee B and the employee M, but the employee H in Fig. 5 (b) does not have these edges.
Next, the relationship between the network structure in Figs. 5 (a) and (b) and the efficiency felt by employee D is examined. First, the meaning of the edge between employee E and Captain B in figure (a) is examined (This edge does not exist between employee H and captain B in figure (b)). When an employee E who has an informal network with Captain B is in the team, communication towards the upper position occurs. Formal networks tend to be one-way communication from the top to the bottom, but a two-way communication creates a sense of unity in the workplace. As a result, the sense of isolation that Captain B felt as a higher job position could be weakened, and Captain B would be able to give formal instructions with confidence. On the other hand, employee D can shorten the distance from captain B, making it easier to recover even if he makes a mistake, and can concentrate on work with confidence.
Next, the meaning of the edge between employee E in cooking work and Employee M in customer service in figure (a) is examined (This edge does not exist between employee
A
O Q
W K
I E B
D C
H
F G
J
L M N
P
U
T V
R S
キャ プ テン ト レ ーナ ー
レ ベル A
レベ ル B
レ ベ ルC
調理業 務 配膳業 務
Captain Trainer Level A
Level B Level C
Cooking work Customer service
Fig. 4. Informal network of workplace to be analyzed. The workplace is the cooking work and the customer service of a certain family restaurant consisting of 23 members. The job positions of the five stages from the top to the bottom are indicated as captains, trainers, level A, level B, level C in the order of experts. The left side workplace shows the cooking work and the right side shows the customer service.
O
K
E B
D C
N M
キャプテン トレーナー
レベルA
レベルB
レベルC
調理業務 配膳業務
Captain Trainer Level A
Level B Level C
Cooking work Customer service
O B K
D C
N M
H
キャプテン トレーナー
レベルA
レベルB
レベルC
調理業務 配膳業務
Captain Trainer Level A
Level B Level C
Cooking work Customer service
(a) Efficient team (b) Not efficient team
Fig. 5. Comparison of structure of informal network between an efficient team and a not efficient team. Efficiency of operation was evaluated by interviewing employee D. The difference between them is that employee E in figure (a) is replaced with employee H in figure (b). The employee E in figure (a) has an edge between the employee B and the employee M, but the employee H in figure (b) does not have these edges.
H and employee M in figure (b)). When an employee E having an informal network with an employee M in customer service is present in the team, a conversation always occurs between cooking work workplace and customer service workplace. Employee D who works in the same team as employee E can laugh with above mentioned conversation and can work happily. Furthermore, in addition to these spiritual aspects, employee E can naturally receive the situation of the customer service and the outlook of the serving in chatting with employee M. As a result, the cooking work will be promoted. On the other hand, when employee D works with employee H, he feels less conversation across the counterparts and is less workable than when working with employee E.
From the above, it was found that in a workplace like a service industry where active communication is required, informal networks straddling different job positions and different workplaces are features of an efficient workplace.
IV. E
STIMATIONM
ETHODFORE
FFICIENCYOFW
ORKPLACEA. Proposal of estimation method
In this section, a method to quantify the features of the structure of the informal network with the features of the efficient workplace mentioned in the previous chapter is proposed. In order to extract efficient workplace features, quantification methods of vertical connections connecting different job positions and horizontal connections connecting different workplaces are necessary. Here, it is considered that the relationship between the vertical connections and the horizontal connections has a low mutual relationship and they are highly independent indexes. In addition, if these two indexes can be measured individually, it is possible to grasp which index should be improved by deficiency in a certain team. Therefore, rather than combining the two indexes, a policy to quantify them separately was decided. The concept of quantification will be described below.
(1) VCI (Vertical Communication Index)
From the results of 3.2 (3), it became clear that if members with different job positions are intimate, a sense of unity is generated in the workplace, employees with higher job positions can give formal instructions with confidence, and employees with lower job positions can concentrate on their work with confidence. And it is thought that the effect increases as the number of hierarchies crossing job positions increases. Based on this concept, the following index named Vertical Communication Index (VCI) was formulated.
VCI = Σ VCI i / N (1) i
VCI i = R i / A i (2) Here,
VCI: Vertical communication Index of all workplaces VCI i : Vertical communication Index of workplace i
i: Workplace number (i = 1 to N)
A i : Total number of job positions crossed by edges (Here, the target edges are all combinations created by two nodes belonging to workplace i, and 1 is added for each crossing.)
R i : Total number of job positions crossed by edges (Here, the target edges are all existing edges belonging to workplace i, and 1 is added for each crossing.)
(2) HCI (Horizontal Communication Index)
From the results of 3.2 (3), it became clear that if members with different workplaces were intimate, it became clear that the chat that is exchanged between different workplaces will brighten the workplace. In addition, it was found that efficiency of workability is improved by understanding the state of different workplaces through chatting and easy to obtain prospects for work. And the effect is presumed to be larger as more connections cross the workplace. the following index named Horizontal Communication Index (HCI) was formulated.
HCI ij = R ij / A ij (3) Here,
HCI ij : Horizontal Communication Index of workplace i and workplace j
A ij : the number of all combinations of nodes at workplace i and nodes at workplace j
R ij : the number of actual edges among all combinations of nodes in workplace i and nodes in workplace j (3) Estimation of efficiency
Efficiency of working for each team is estimated using the VCI and HCI. Specifically, the team is plotted in the
0.60 0.65 0.70 0.75 0.80
0. 10 0.15 0.20 0.25 0.30
Efficient team a
Not efficient team b
HCI (Horizontal Communication index) VC I (
Ve rt ic al C om m un ic at io n in de x)
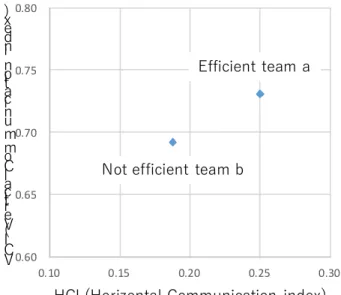
Fig. 6. Trial result of proposed method. The team a is located at the upper right of the team b. This shows that the proposed method yields an estimation result that the work efficiency of team a is higher than that of team b. On the other hand, the work efficiency of team a is high in the interview of employee D. Therefore, it can be seen that the proposed method can correctly estimate the work efficiency.
coordinate space with the VCI as the ordinate and HCI as the abscissa. As a result, the team that is more efficient will be plotted on the upper right. For this reason, when the manager of the workplace forms a team, it is possible to form an efficient team by giving priority to the team on the upper right.
B. Trial result of proposed method
The trial results of the estimation method proposed in the previous section are shown in Fig.6. The figure shows the results of estimation of efficiency of working by using VCI and HCI calculated by the proposed method for the two teams in Fig. 5. In Fig. 6, the team a is located at the upper right of the team b. This shows that the proposed method yields an estimation result that the work efficiency of team a is higher than that of team b. On the other hand, as shown in Fig. 5, the work efficiency of team a is high in the interview of employee D. Therefore, it can be seen that the proposed method can correctly estimate the work efficiency.
C. Discussion
First, the difference between the indexes of the two teams obtained in Fig. 6 will be considered. Differences in the efficiency of working of the two teams are estimated based on an interview with employee D. For this reason, the impression of efficiency of working may emphasize the difference in edges directly connected to employee D. In other words, considering efficiency of work in the entire workplace, it may be lower than the impression of employee D. For this reason, the difference in the indexes shown in Fig.
6 is considered to be not greater than the impression of the employee D, although there is a difference in superiority or inferiority. In order to more accurately evaluate the workability of the workplace, it is desirable to consolidate the impressions of all employees.
Next, a method of calculating VCI will be discussed. As shown in Equation (2), the difference in positions used for calculation of VCI is set to 1 in all adjacent job positions.
This premise assumes that the gap between job positions is equidistant. Therefore, when applying the proposed method to various workplaces, it may be necessary to adjust the weights in consideration of this assumption. Furthermore, for example, in the case of a workplace where the number of hierarchies of position is large and the management force is strong, it is necessary to increase the weight between hierarchies in high job position. On the other hand, for example, in the case of a workplace where the number of job positions is small and the work force of the site is strong, it is necessary to increase the weight between the lower job positions.
Next, the method of calculating HCI will be discussed. In calculating HCI, attention should be paid to the importance of exchange between workplaces by job position. In other words, the meaning of the network between the workers in low job position at the site and the network between the superior managers have different meanings. For this reason, in the future, it will be considered to calculate HCI taking into consideration the job position of networks.
Finally, the relation between the clustering coefficient,
which is a representative index of the organization network, and the proposal index is described. The clustering coefficients of the two teams shown in Fig. 6 are 0.63 for team a and 0.60 for team b. The clustering coefficient of team a, which is efficient to work, is larger and has the same tendency as the proposal index. More specifically, when comparing the ratio of team a and team b (the index of team a / the index of team b), the ratio of VCI is 1.06 and the ratio of HCI is 1.33, whereas the ratio of clustering coefficient is 1.05. Regarding the clustering coefficient, the reason why the value of team a is larger than the value of team b can be estimated from Fig.5. That is, the network of the cooking workplace is densely packed in the team a, while the team b is vertically long. The condensability of the network seen here is less related to the vertical and horizontal relationships which improve the efficiency revealed in this study.
Therefore, clustering coefficients cannot be used as an index to quantify the network structure that enhances efficiency.
Furthermore, the clustering coefficient does not distinguish between vertical and horizontal directions as shown in Fig. 6, and only one index is obtained for one organization. For this reason, in improving the efficiency of the workplace, the vertical and horizontal indexes proposed in this research can be linked to concrete measures such as strengthening vertical connections and reinforcing horizontal connections, whereas in clustering coefficients it is difficult to realize. For this reason, the proposed index is considered to be effective.
V. C
ONCLUSIONIn this research, a method to estimate the efficiency of the workplace was proposed by considering the relationship between formal network and informal network. Based on the analysis results obtained by comparing teams in the service operations, it was pointed out that factors related to efficiency of work are networks that cross over job positions and networks crossing the workplace. On the basis of this result, VCI (Vertical Communication Index) for quantifying the number of networks crossing job positions, HCI (Horizontal Communication Index) for quantifying the number of networks crossing the workplace, and a scatter chart with vertical and horizontal indexes as coordinate axes have been proposed. By using a scatter chart, a efficient workplace can be displayed on the upper right of the figure. Although it is a small number, feasibility was confirmed by trial with actual data. By using the proposed method, it is possible to create an efficient team.
As a future task, it is necessary to embody a method to continuously collect information on informal networks, which is the premise of the proposed method. For data collection in informal networks, questionnaire surveys are common. However, using SNS has the potential to collect informal networks without imposing burden on employees.
Also, it is desirable to consider the strength and direction of
the network, which was not considered this time. As a result,
there is a possibility that measurement of efficiency of
working with high accuracy can be made.
R
EFERENCES[1] G. B. Graen and J. A. Graen, Sharing Network Leadership, Information Age Publishing, Mar. 2009.
[2] S. Soda and A. Zaheer, "A network perspective on organizational architecture: performance effects of the interplay of formal and informal organization," Strategy and the Design of Organizational Architecture, Vol.33, Issue 6, pp.751–771, Jun. 2012.
[3] R. Gillespie, Manufacturing Knowledge: A History of the Hawthorne Experiments (Studies in Economic History and Policy: USA in the Twentieth Century), Cambridge University Press, May. 1993.
[4] R. Marschan, D. Welch, and L. Welch, "Control in less-hierarchical multinationals: The role of personal networks and informal communication," International Business Review, Vol.5, Issue 2, pp.137-150, Apr. 1996.
[5] P. Hinds and S. Kiesler, "Communication across Boundaries: Work, Structure, and Use of Communication Technologies in a Large Organization," Organization Science, Vol.6, Issue 4, pp.373 - 393, Aug.
1995.
[6] M. K. Ahuja and K. M. Carley, "Network Structure in Virtual Organizations," Journal of Computer-Mediated Communication, Vol.3, Issue 4, Jun. 1998.
[7] Y. Matsumura and K. Ohkura, "Effectiveness of Kaizen based on Informal Knowledge Management on the Improvement in Group Achievements," Journal of Japan Society for Fuzzy Theory and Intelligent Informatics, Vol.20, No.6, pp.972-980, 2008.
[8] M. Kanbe and S. Yamamoto, "Application of Social Network Analysis for Enterprise SNS," The Japanese Society for Artificial Intelligence, SIG-KSN-003-05, 2008.
[9] M. Tsvetovat and A. Kouznetsov, Social Network Analysis for Startups:
Finding connections on the social web 1st Edition, O'Reilly Media, Oct.
2011.