Calculating the overpressure in a tyre cavity due to tyre movement and
compression.
Name student: Jorn Reijmer
Student number: s1122738
Name company: Apollo Tyres R&D
Name department: Advanced Tyre Research
Name mentor company: P. Sankarganesh
Location company: Chennai, Tamil Nadu, India
Internship period: 7 September 2015 - 7 December 2015
Faculty University Twente: Engineering Technology
Department University Twente: Mechanics of Solids, Surfaces and Systems
Summery
When a tyre rolls over a cavity (tread patron of the tyre) an overpressure is created inside this cavity. When the tyre continues rolling, the cavity and the high pressure will be released. This will generate acoustic disturbance at the road/tyre interface. This disturbance passes into the air domain and creates noise. The objective of the assignment was to calculate the overpressure in the cavity due to tyre movement and compression. As well as accounting the amount of air pumping and noise generation due to the cavity release at the trailing edge of the tyre. Comparing this for different cavity dimensions and velocities, for a 2D and 3D situation.
A 2D Ansys Fluent model was build matching a model found in literature. This model described a cavity being pressurized as in figure 1. After verifying this model, the model was expanded towards more realistic conditions. Boundary conditions and dimensions were adjust to our case. By varying the input parameters (cavity volume, cavity shape, opening length of the cavity and multiple cavities) the influence on the output parameters (amount of pressure build up inside the cavity, frequency of
pressure wave and sound pressure level) was studied. With these results an overview was created which liked the effect of the input parameters to the output parameters. Also the case when the dimensions of the cavity was not fixed, but compressed, was studied. These results showed nonrealistic behavior. Thereafter the 2D model was converted towards a 3D model, but due to a lack of time, this model was not working properly.
Table of content
Contents
Summery ... 2
Table of content ... 3
Introduction ... 4
My work ... 5
Getting to know the program ... 5
Building model matching paper ... 5
Expanding model... 6
Generating results ... 8
Converting the 2D model towards 3D ... 11
Conclusions ... 12
Reflection ... 13
Apollo Tyres ... 13
My functioning ... 13
Personal experience ... 15
Hindu wedding ... 15
Chennai weather ... 16
Desai ... 17
Pressure of work ... 17
Introduction
As part of the curriculum of the Masters 'Mechanical Engineering' at the University of Twente, this internship was performed at Apollo Tyres R&D, located at Chennai, India. During this period of three months I worked on an assignment and discovered the Indian culture. In this report I will discuss both, as well as giving a reflection on Apollo and myself.
The assignment was within the field of aero acoustic research, and studied one part of the noise created during the rolling motion of a tyre. When a tyre rolls over a cavity (tread patron of the tyre) an
overpressure is created inside this cavity. When the tyre continues rolling, the cavity and the high pressure will be released. This will generate acoustic disturbance at the road/tyre interface. This disturbance passes into the air domain and creates noise. The objective of the assignment was to
calculate the overpressure in the cavity due to tyre movement and compression. As well as accounting the amount of air pumping and noise generation due to the cavity release at the trailing edge of the tyre. Comparing this for different cavity dimensions and velocities, for a 2D and 3D situation.
[image:4.612.70.315.413.538.2]The computation of overpressure due to tyre rolling is very complex due to influence of road, tyre and air. To simplify the situation, some assumptions where made: The road and tyre where assumed to have a smooth surface; the cavity will be modeled on the road and slides towards the tyre instead of the tyre rolling over the cavity at the tyre; only one semi-closed cavity will be used instead of a complete tread patron . A sketch of the situation can be seen in figure 1, the red arrow indicates the motion of the cavity.
Figure 1: sketch of the situation
My work
The work I have done can be divided in different stages. The first stage was getting used to the program named ‘Ansys Fluent’. After understanding how to use the program, I had to build a 2D model matching a Fluent model found in a paper, which was given to me by Apollo. The third stage was to expand this model towards more realistic conditions. When this 2D model was working as it should, the next step was to vary velocity and shape of the cavity and check the results to see the influence of these
parameters. Thereafter the 2D model was converted towards a 3D model and again the influence of the cavity geometry and velocity was studied. The last stage was documentation, in which a Standard Operating Procedure, presentation and this report had to be made.
Getting to know the program
The first two weeks of the internship where meanly focusing on how to work with the program Ansys Fluent. During the courses of University Twente, I had worked with Ansys before, but only with structural analysis. Unfortunately where was no one at the department who had worked with Ansys before, so I had to learn how to use the program myself. After reading and watching Ansys instruction files, I started to practice with tutorials related to my subject from the Ansys website.
Building model matching paper
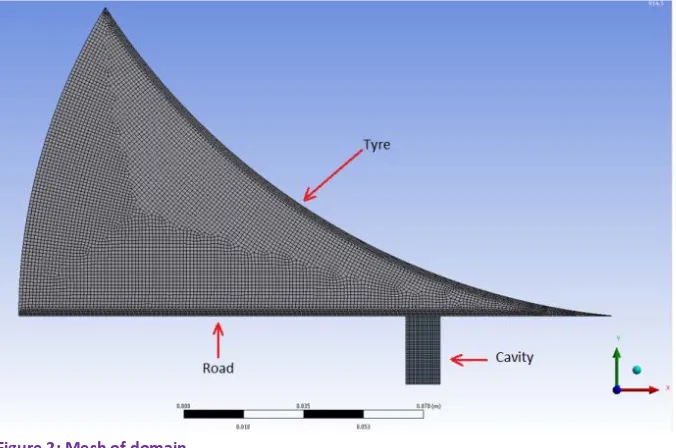
As a starting point Apollo gave me a paper with some background information, which also contains results of experimental research and of an Ansys Fluent simulation. My first goal was to create a model that was able to obtain the same outcome as the Fluent results in this paper. In the beginning I only focused on the pressure on the bottom of the cavity, because the paper did the same. A big challenge in this was that the paper did not say much about their model, only the dimensions and velocity of the cavity where given. By assuming most of the dimensions the first geometry was created as can be seen in figure 2. The biggest challenge was to create a moving cavity with moving mesh inside the cavity. Everything I tried resulted in the same error: when the cavity reached the end of the domain a negative element surface was created. It did not took long to figure out what the problem was, but I was not able to solve it. We decided to contact Ansys Costumer Support, which was very helpful. With their advice I was able to create a working model. It was important that the cavity would be modeled as a separate part so that it was able to move further than the tip of the domain. By defining an intersection part, the pressure was able to flow from the cavity into the 'normal' domain. Now the meshing was done the next step was the Fluent setup. There were so many different settings that this part took much time. Because I wanted to know the meaning of all the settings, I did a lot of research on internet. Also I wanted to know what the influence was of the parameters, so I performed many simulations with different settings. At the end of this stage a database was created with different graphs, all showing the pressure at the bottom of the cavity, for different settings. With this and the knowledge gained from the research, I was able to choose the settings to match the results from the paper the best. At the end of the first month I finished this stage.
Figure 2: Mesh of domain
Expanding model
Now that the model had shown to work (the outcome matches with the results of the paper) the next step was to make the model more look like was happens is reality. This resulted in the changes of some boundary conditions. In the first place the tyre and road did not have any velocity, only the cavity had a velocity and moved to the tyre. But as figure 3 illustrates, also the road and the tyre should have a velocity. In the simulation you could say that we are traveling with the tyre. So the tyre stands still and the road should have a velocity in opposite direction. To make the velocity difference at the contact point zero, the tyre should have a rotational velocity.
Figure 3: boundary velocities
Furthermore I wanted to include compression of the rubber when rolling over the cavity. This meant that because of the compression, the pressure inside the cavity would rise and probably this would affect the pressure wave at the trailing edge. After informing the Ansys Customer Support on the possibilities of Ansys and a consultation with my mentor, we decided to model this compression as
[image:6.612.78.491.462.631.2]follows. The three walls of the cavity will start to move inwards as the right wall comes into contact with the tyre and when the left wall loses contact with the tyre at the trailing edge, the cavity will have its original dimensions again, see figure 4. To get an idea of the deformation, I asked a colleague to run an Abaqus simulation on the deformed shape of a tyre being loaded with a velocity of 80km/h. These deformations where scaled towards the dimensions of my cavity. In Matlab I created a script that describes the parabolic velocity profile of every wall of the cavity at every time-step. This script is dependent of the starting distance between the cavity and tyre, cavity and tyre dimensions, cavity deformation and velocity. The variables time, v_x and v_y should be copied in an input file, which can be read by Ansys. The next thing was to create a dynamic mesh. I already knew how to do this because I tried this method for the moving cavity. The Layering technique was able to delete or create mesh lines of a rectangle mesh, when the boundary would move to close of far from the mesh.
Figure 4: Compression
In this stage I created the trailing edge as well as two measurement points in the air domain, see figure 5. These where able to measure the pressure at that specific point in space. Also it was possible to convert this pressure wave in time domain into sound pressure level in frequency domain.
Also I discovered a new way of meshing, with the technique called sphere of influence I was able to create a dense mesh at the tip. By defining the growth rate, a smooth mesh could be made, to compare see figure 5 and 2. By the end of this stage, one and a half month already past.
Figure 5: mesh and measurement points
[image:7.612.75.542.531.676.2]Generating results
In this stage the model was found to be ready to generate useful results. Together with my mentor we thought of which different simulations to perform in order to get the needed results. First a 'standard' rectangular cavity was defined. Then the length of the cavity would be doubled and halved to see the influence of the length and volume. Then a triangle cavity with the same length as the standard one and thus the same volume of the halved one. This simulation was needed to seen the influence of the shape. Thereafter a simulation was done with two standard cavities straight after each other. To see the influence of the cavities on each other. All these simulations where done without compression of the cavity.
To see the influence of compression also a standard cavity with compression was simulated. After that, again the compressed standard cavity was simulated but now onetime with a higher and onetime with a lower velocity.
Generating the results took much time. So I decided to run the program over night and during the day I could prepare the simulation and work on the report and the 'Standard Operating Procedure.
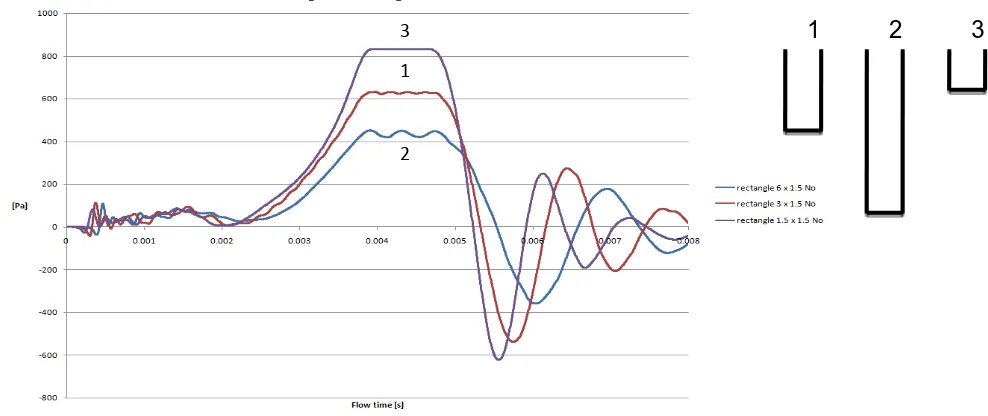
[image:8.612.73.567.357.565.2]Without going to much into detail, in figure 6 one result can be seen. In this graph three different simulation results are shown. The only difference is the length of the cavity. As you can see, is the pressure built up in a smaller cavity higher than in a lager cavity.
Figure 6: Pressure on the bottom of the cavity for varying cavity volume
As we look into figure 7, we can see the pressure waves experienced by one measurement point in the air domain when the cavity is released at the trailing edge. As you can see, causes a smaller cavity a pressure wave with a higher frequency, but it is damped faster. For all results we looked for physical explanations, like smaller volume means higher pressure according to the ideal-gas law. In this way we were able to understand the results and find errors in the simulation.
1
2
3
1
2 3
Figure 7: Pressure experienced by the measurement point at the trailing edge
In figure 8 can be seen the pressure buildup on the bottom of the cavity. But this time not the volume of the cavity, but the geometry of the cavity changes. Cavity geometry 1, 5 and 6 have the same volume and cavity’s 3 and 4 have the same volume. As can be seen in the figure, is the pressure the same for 3 and 4 and the same for 1 and 6. Geometry 5 had the same volume as 1 and 6, however the opening length is smaller.
Figure 8: Pressure on the bottom of the cavity for varying cavity geometries
1
3
4
5
6
1 & 6 3 & 4
5
3 1 2
[image:9.612.80.579.431.669.2]In figure 9 the pressure buildup for two cavities can be seen. In this case the pressure in the first cavity is of the same height as in the case of one single cavity, but the pressure inside the second cavity is higher. The reason for this is that the pressure leakage of the first cavity leaks into the second cavity.
Figure 9: Pressure on the bottom of the cavity for one and two cavity configuration
It can be seen in figure 10 that the pressure experienced by the measurement point is higher in the case of two cavities. Partly can this be explained by the higher pressure buildup in the second cavity, but more imported is the time between releases. If this is in phase this the first cavity then the pressure will be higher, if this is anti-phase then the pressure can be reduced.
Figure 10: Pressure experienced by the measurement point at the trailing edge for one and two cavities 7a
1 7b
1
7
b
a
7
1
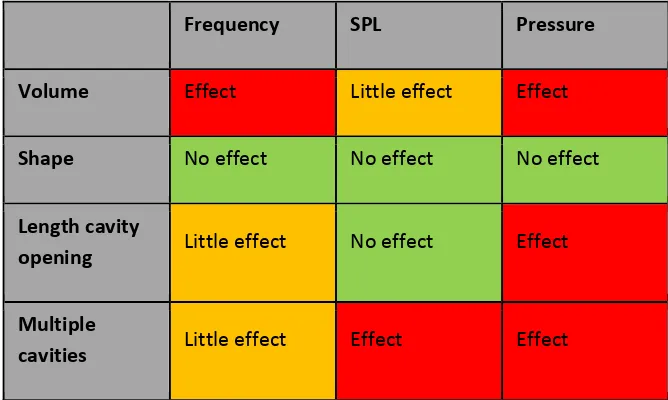
[image:10.612.78.460.469.689.2]With all results I was able to create a table (see conclusions) which liked the effect of the input parameters: cavity volume, cavity shape, opening length of the cavity and multiple cavities, to the output: amount of pressure build up inside the cavity, frequency of pressure wave and sound pressure level.
The compression simulations (deforming cavity) showed some strange results, namely a pressure built up which was 19 times higher. This was found unrealistic because the volume changes was only 7%. According to the ideal gas low, which the program uses to calculate the density, this pressure rise is impossible for a closed volume. Unfortunately there was not enough time left to look more into detail on this. We decided that it was more important to compere the 2D results without compression with 3D results. By the end of this stage already two months past.
Converting the 2D model towards 3D
Now that the 2D model without compression gave the results we were looking for, the aim was to create the same kind of model in 3D. Creating the 3D geometry was not that difficult, but creating the same kind of mesh as in 2D was. In 2D I used the technique called 'sphere of influence'. This basically means that you select one point and specify the element length in a sphere around this point. After that you specify a certain ranges of growth and a smooth mesh is created. But when I did this in 3D, only the element length in the 3e direction became smaller. After trying different things, I contacted Ansys customer support, and ones again they helped me out. They advised me to create a cylinder at the tip of the geometry and use this cylinder as body of influence in the meshing part. With this, the same mesh could be created as for the 2D situation. The problem however was that creating the mesh took too much time, because there where so many nodes. So I decided to shorten the geometry and increase the element size. With these adjustments, it was now less time consuming to create the mesh as well as to calculate the solution. With less nodes the mesh still took 3 hours to create. Thereafter the problem was visible, somehow at one region Ansys created a very dens mesh. This was only at the leading edge and not at the trailing edge, although these where identical created. After trying to solve this problem, Googled for solutions, trial and error with every time waiting for 3 hours, I finally succeeded. The next step was to insert the mesh in Fluent and setup the simulation. Then the next problem occurred, the solver gave instability errors. In order to make the model more stable I tried to lower the discretization order and changes the solver type, but nothing helped. Again I called with Ansys Customer Support but this error was to general to help over the phone, so I send them a simplified situation of my model. One week passed while we were trying to solve the problem, Ansys Customer Support and me discussing and trying. In the end we came up with the following idea. Changing the boundaries 'far pressure field' into 'presser outlet' would result in a more stable model. Then first perform a steady state simulation without velocity of the cavity and with a constant density. Let this simulation converge to the solution and save the result. Thereafter run a transient solution with cavity movement, which has the results of the steady state simulations as starting conditions. This resulted in a stable model, but the results were not anything like the results of the 2D simulations. So after 69 hours of simulation (only 3/4 of the simulation completed) we decided to stop it and changes the density for the transient part of the simulation from constant into dependent of the ideal gas low. Once again the simulation was started but due to power cut the simulation was stopped after two days. At that time the simulation was not even half way.
Conclusions
From the 2D simulation results the following conclusions can be drawn:
• Smaller cavity results in higher pressure buildup and higher frequency
• Cavity volume has not much influence on sound pressure level
• Cavity opening length influence on pressure
• Shape (except for opening cavity length) no influence
• Multiple cavities have influence on the pressure and sound pressure level
Frequency SPL Pressure
Volume Effect Little effect Effect
Shape No effect No effect No effect
Length cavity
opening Little effect No effect Effect
Multiple
[image:12.612.138.472.206.406.2]cavities Little effect Effect Effect
Figure 11: output parameters influenced by input parameter
From the compression and 3D simulations no conclusions can be drawn. All in all it was really disappointing that no 3D simulation was able to give proper results. We underestimated how long it look to convert the model from 2D to 3D. After three weeks of facing multiple problems, there was no time left to gather good results. Also because of the amount of time one 3D simulation took.
Reflection
In this part of the report I will reflect on Apollo Tyres R&D as an internship providing company, as well as my own functioning during the internship.
Apollo Tyres
During my stay Apollo treated me as a guest and I felt really welcome. The accommodation provided by Apollo was matching my European standard and at some points even above that. The food was good and there was a cab bringing me to office and back every day. The only drawback was that the guesthouse was quite isolated and therefore there were not much people to enjoy with apart from talking with other guests over diner and the caretakers in their spare time. So sometimes I felt a bit lonely.
At the office everybody was willing to help and was open for questions about everything. The people where really friendly and I felt part of the group within a couple of days. I got my own desk and the department looks really modern and professional. During work people are quiet and focused, there was a good working environment.
The mentoring part was a bit disappointing. Not that they did not want to help me, but no one had worked with the program before, so they simply were not able to help me. The only help they could provide, was helping me looking for help at the Ansys customer support. The fact that no one worked with Ansys Fluent before, also made it difficult to talk with people in detail about the assignment. One other thing that I missed was structure. Most of the time I was working without really knowing where I was going to and what else needed to be done. It would be better to have a planning and divide the project into sub-projects. For me in the beginning it was not clear where the complete projects consisted of, only the first part and what the end result should be was shown.
I think the scope of the assignment was not realistic to complete within 3 months. Especially when the student does not have experience with the program and is not really ´Fluid´ orientated.
My functioning
Due to different reasons I had the feeling that my functioning was not as good as I would like it to be. The first reason was that I was not used to the program, this took a lot of time. In the first stage to get to know the program, and to run many simulations to see the influence of the options. But also in a later stage when I was already running simulations and then discovered that I misused a boundary condition. All the data I gathered at that stage became useless and I had to start all over again.
The second reason was that none of the colleagues could help me with Ansys. For bigger problems I could call the customer support, but for the small issues the step was too large. Especially because it was hard for me to understand the man over the phone, because of his Indian accent. In that case a colleague of mine talked to the support man and then ‘translated’ it to me, which was far from ideal of course. For the smaller issues I went to different CFD forums on the internet, but most of the times the answer was not easy to find because it is very problem dependent. After two courses on Fluid Dynamics my knowledge on fluid behavior was not that good that I was able fully characterize the problem. No one at the department seems to have knowledge on this specific topic, so again I had to search the internet. The leg of knowledge and mentoring in this and the trial and error approached, did not feel very academic to me.
The last reason why I had the feeling that my potential was not used optimal was that the simulations took much time. The 2D simulations took 3 to 4 hours and the 3D even 4 days. During this time I could not work on another project simultaneously because there was only one Ansys license. During this time I worked on some paperwork or planed my weekend trips, but I spent many hours waiting for the
program to finish the simulation.
Personal experience
Looking back on my time in India, it was a great experience. A whole different world with very friendly people. In this part of my report I would like to share some experience of mine which made a big impression on me during my stay in India.
Hindu wedding
I was really lucky that one of my colleague was going to marry in the period that I was in Chennai. Because of his marriage I could ask him and other colleagues about Indian marriage, which I found very interesting. The Indian marriages are in general arranged marriages. This means that the parents will search for a good match for their child by coming into contact with other parents. So in the first stage the child does not come into play, only the parents exchanges the profile of their child. This profile contains general information about the child like age, work etc. But also a horoscope that 'predicts' the future of this person. This horoscope is very important, because this has to match to be a good marriage candidate. Marriage can only be done within the same cast, but the cast division is different than I thought it was. There are different levers in society and within these levels there are many different classes, so one class is not per se higher or lower than one other. After the parents have selected a good candidate, the child can refuse if he/she wants, so this is different than a forced marriage. When both the child's agree the first thing is to get engaged. It is normal that the bride and groom only met once (15 minutes) before getting engaged.
In the case of the wedding of my colleague it was a little bit different. He claimed not to do an arranged marriage but a lover marriage. In his case the mother of her came directly to him to ask if he likes her daughter. After seeing her profile he calls the girl by phone and he falls in love. Then the most difficult part starts, convincing his parents. This part was very difficult because she was from another cast. By the time he convinced him parents she visits him home ones and after that the engagement was planned. So the parents met the girl only ones and he only twice before the engagement. During the engagement they met once more. When I asked if he is not afraid to marry a girl he only met 4 times he answers that they have been calling each other many times, so he knows she is a good match for him.
When I ask people about love marriage the opinions differ. Most of the people say that a marriage should not be based on love, because love will not last and then you want to get a divorce. Like it is happening in Europe, they say. In a marriage not based on love, but on a need of having someone to take care for you, love will grow during time, and if not, it is not a problem because you have still someone cooking for you or earning money for you. As long as the other person does him task in that, the marriage is good. People don't get a divorce. It is seen a bad thing to get divorced, especial for the women. The women is considered worthless and a bad wife if the is divorced.
The wedding took three days in total, but we were only invited for 2 hours. During this period I
witnessed all kinds of rituals like washing the feet of the groom, the bride holding a coconut in her hand and a bag of rice under her shirt while walking around the groom who was blindfolded and throwing rice at the married couple to give your blessing. Also the bride and groom had to put some sticky past on a leaf and then stick the leaf on the head of the other and they had to throw an entire bowl of rice over the head of the other. I was really fun to watch and interesting to hear what the reason of all the different rituals were.
Chennai weather
The first two months of my stay it was hot, 36 degrees Celsius during the day and 28 during the night. But at the end of September this changes, more clouds came and the temperature dropped to a pleased 30 degrees Celsius during day time. This was the beginning of the monsoon. First there were
thunderstorms every afternoon/evening with heavy rains. But this was only for a couple hours. After a week of this weather the thunderstorms left and the rain increased. There raised a cyclone at the ocean and came weakened at land near Chennai, result: trees pulled out of the ground and more and more rain. It rained heavily for one week, continuously. Undeveloped land changed into lakes, streets changed into rivers. Because of the bad drainage systems the water could not go anywhere and half of the city changes into a kind of waterpark.
For me personally it did not changes much, I could still go to work and back, only in my spare time I did not go outside anymore. But what did affect me was what I saw. On the first days I saw the garbage floating everywhere, I saw the homeless and limping people crawling in the water ponds with garbage. As the rain continuous I saw the lower class people work on their houses, trying to reinforce. I saw small villages at the side of the road who ware completely drowned. After one week of rain I watched the news, the army trying to rescue people from floated areas, helicopters providing food packages and already 71 people died in this state because of the rain. A couple days later the number raised to 120. For me this was really shocking, but none of my colleagues talked about it. So I asked one why nobody did talk about it, do people not care about this? He said that the people how died are the poor people, it is normal that they die. They don’t have proper houses and they don’t have a place to go. For me this was really shocking, it felt like nobody cared about these poor people.
Two weeks later again Chennai had to face very heavy rain. Because all lakes, rivers and ground was still soaked from last time the water could not go anywhere, so again all streets where blocked. That day we left office early to be sure everybody could reach their homes. At 4 p.m. we left by company bus to drive to the city. We were able to drive really slowly because of the water everywhere. I was also in the bus because the plan was that I could sleep at a colleagues place in the city, nearby the airport. Because next morning my girlfriend would arrive at the airport. But after 2 hours the bus driver decided to turn around because the road was completely blocked. It took again 2 hours to reach the Apollo plant and from there we needed to walk to de R&D department. Everywhere the water level was above ankle height. All employees had to sleep at the office or in the plant. Luckily for my, the road to the
guesthouse was not blocked, so I could sleep at the guesthouse. But now I would not be able to pick up my girlfriend from the airport. Next morning I got a massage that the flight was canceled. The airport was completely flooded. My girlfriend was still in Dubai, after 6 hours waiting at the airport, a hotel was arranged for her and she was able to changes her flight destination to Bangalore, a city 350 km from Chennai. I wanted to go there, but all roads were blocked and railway was broken, so I had to wait 2 days before I could get out of the guesthouse and visit my girlfriend.
Meanwhile I watched the news, I saw parts of the city being flooded with a water level around 2 meter. Again many people lost everything, houses or their lives.
Desai
During my internship I stayed in the so called Apollo guesthouse. In this guesthouse were four
caretakers, who prepared food, did the dishes, made my bed, washed my clothes, etc. The head of the household was Desai, a small and slender man with the age of 55. He is a hardworking and friendly person with whom I spent quite some time. During one of our talks I discovered that he is not that happy as he seems. He told me that this life (he beliefs in reincarnation) is a wasted life and if he could die today, he would be glad. He is not thinking of committing suicide, but he just wanted to live another life. For the last 15 years he was working as a caretaker. Seven days a week, from the moment he wakes up till the moment the last guest goes to sleep. Every year he gets 20 days off, to visit his family. This man has a net salary of 160 euro per month. Most of the money he sends to his wife and kid, he only needs a small part to buy insulin and cigarettes. Also he tries to save some money for his retirement, because the government does not provide this. Normally the sons will provide the retirement when they have a job. During childhood the parents take care of the child and when the parents reach their
retirement age, the boys will take care of the parents. Desai only has a daughter, which only costs a lot of money. First to get her education, second to get her married (dowry) and thereafter she belongs to her husband. This means if she earns money she cannot give a part to her parents, she should give it to her husband. So Desai knows he have to work hard to save some money.
Desai says he feels trapped, he does not have a life and does not have much to enjoy, he needs to work all day and every day. He cannot have a better job, because he is not educated and at age and when he complaints about his salary he will get fired easily. There are many people who want to work because of the overpopulation, so finding now employees is easy.
Pressure of work
One of the negative things about doing my internship in India was the fact that the people here work six days a week. Luckily I only had to work five days a week but still I experienced negative influence because of this six day work week. Because all my colleagues had to work on Saturdays, the only option was to explore by myself on that day. My colleagues told me where I could go, but still it is different than when a local person is there to take you to the best places and explain everything. Also when I wanted to go to another place for the weekend, I had to go by myself.
On Sundays the people don't have to work, but on this day they like to take rest. On their only holiday they sleep, watch TV, wash their cloths, sleep some more, maybe do some shopping or go for a walk. But typically they don't feel like doing that much on this day. Because of this pressure of work people don't have much time for hobbies, doing sports, enjoying live. Work is really dominating their lives. Especially when I look at the senior (40-50 years old) employees I met at the guesthouse, all they talked about was work.