1
Faculty of Electrical Engineering,
Mathematics & Computer Science
Automatic Structuring of Breast Cancer
Radiology Reports for Quality Assurance
Shreyasi Pathak
Masters in Computer Science
Specialization: Data Science and Smart Services
Master Thesis 27th August, 2018
External Supervisors: drs. Onno Vijlbrief Email: o.vijlbrief@zgt.nl Jeroen Geerdink
Email: J.Geerdink@zgt.nl drs. Jorit van Rossen Email: j.vrossen@zgt.nl Radiology Department
Ziekenhuis Groep Twente (ZGT) Geerdinksweg 141
7555 DL Hengelo The Netherlands
U
NIVERSITY OF
T
WENTE
M
ASTERT
HESISAutomatic Structuring of Breast Cancer
Radiology Reports for Quality Assurance
Author:
Shreyasi PATHAK
Supervisors:
Dr. Ir. MauriceVANKEULEN
Dr. Christin SEIFERT
External Supervisors (ZGT):
drs. Onno VIJLBRIEF
Jeroen GEERDINK
drs. JoritVANROSSEN
A thesis submitted in fulfillment of the requirements for the degree of Master of Science
in
Computer Science
Data Science and Smart Services
Datamanagement and Biometrics Research Group Faculty of Electrical Engineering, Mathematics and
Computer Science
iii
Declaration of Authorship
I, Shreyasi PATHAK, declare that this thesis titled, “Automatic Structuring of Breast Cancer Radiology Reports for Quality Assurance” and the work presented in it are my own. I confirm that:
• This work was done wholly or mainly while in candidature for a research
de-gree at this University.
• Where any part of this thesis has previously been submitted for a degree or
any other qualification at this University or any other institution, this has been clearly stated.
• Where I have consulted the published work of others, this is always clearly
attributed.
• Where I have quoted from the work of others, the source is always given. With
the exception of such quotations, this thesis is entirely my own work.
• I have acknowledged all main sources of help.
• Where the thesis is based on work done by myself jointly with others, I have
made clear exactly what was done by others and what I have contributed my-self.
Signed:
v
Abstract
Hospitals often set protocols based on well defined standards to maintain quality of patient reports. To ensure that the clinicians conform to the protocols, quality as-surance of these reports is needed. Patient reports are currently written in free-text format, which complicates the task of quality assurance. In this paper, we present a machine learning based natural language processing system for automatic quality assurance of radiology reports on breast cancer. This is achieved in three steps: we i) identify the top level structure of the report, ii) check whether the information un-der each section corresponds to the section heading, iii) convert the free-text detailed findings in the report to a semi-structured format. Top level structure and content
of report were predicted with anF1 score of 0.97 and 0.94 respectively using
Sup-port Vector Machine (SVM). For automatic structuring, our proposed hierarchical
Conditional Random Field (CRF) outperformed the baseline CRF with anF1 score
vii
Acknowledgements
The past 8 months that I have been working on my master’s thesis, have been an amazing experience for me. I learnt the skills to conduct research, write a research paper and how to work collaboratively. This would not have been possible without my supervisors. I would like to thank Maurice van Keulen and Christin Seifert for being so supportive and helpful throughout the project, for all the brain-storming discussions and critical feedback. Every time I had meetings with both of you, I would always feel very motivated and encouraged. Maurice, thank you for always creating a visualization out of the complex things and making it simpler. Christin, thank you for all your detailed feedback, for sending me helpful websites and shar-ing your books with me, so that I could understand somethshar-ing better. I would like to thank Jorit van Rossen and Onno Vijlbrief for taking time to explain me the re-lated knowledge from the medical domain and for labeling the reports. Thank you for patiently answering my numerous questions and emails. I would like to thank Jeroen Geerdink for setting up the system for my work, for the dataset, for always helping me out with difficulties related to the hospital and for giving me an amazing overview of the project on the very first day. It was a great pleasure working under all of your supervision and I learnt a lot from all of you.
I would like to extend special thanks to my parents, my boyfriend, and my broth-ers for always being there through this roller coaster ride. It would not have been possible without your support. During the times that I would feel down, you were always there to listen and motivate me through numerous video calls.
ix
Preface
xi
Contents
Declaration of Authorship iii
Acknowledgements vii
Preface ix
I Research Paper 1
II Master Thesis 13
1 Introduction 15
1.1 General Overview of Radiology . . . 15
1.2 Current Scenario and Problems Associated with it . . . 15
1.3 Possible Solutions and Our Approach . . . 16
1.4 Research Questions . . . 17
2 Related Work 19 2.1 Introducing Radiology Reporting and its Qualities . . . 19
2.2 Structured Reporting Initiatives . . . 20
2.3 Natural Language Processing in Radiology . . . 22
2.3.1 Rule Based Approaches . . . 23
2.3.2 Machine Learning Approaches . . . 24
Overview . . . 24
Supervised Learning . . . 25
Unsupervised Learning . . . 26
Deep Learning . . . 26
2.4 Summary . . . 26
3 Theoretical Background 29 3.1 Machine Learning Overview . . . 29
3.1.1 Supervised Learning . . . 29
3.1.2 Unsupervised Learning . . . 29
3.2 Classification Task. . . 30
3.2.1 Binary and Multiclass Classification . . . 30
3.2.2 Sequence Labeling . . . 31
3.3 Machine Learning Algorithms for Classification . . . 31
3.3.1 Naive Bayes . . . 31
3.3.2 Support Vector Machine . . . 33
3.3.3 Random Forest . . . 34
3.3.4 Conditional Random Field . . . 34
Linear Chain Conditional Random Field . . . 35
xii
3.5 Summary . . . 39
4 Methodology 41 4.1 Dataset . . . 41
4.2 Heading and Content Identification . . . 41
4.2.1 Manual Annotation. . . 42
4.2.2 Features Used . . . 42
Term Frequency Text Representation. . . 42
TF-IDF Text Representation . . . 43
Length of the Sentence . . . 43
Symbol at the End of the Sentence . . . 43
4.2.3 Classifiers . . . 44
Naive Bayes (NB) . . . 44
Support Vector Machine (SVM) . . . 44
Random Forest (RF) . . . 44
4.2.4 Training and Testing . . . 44
4.3 Automatic Structuring . . . 45
4.3.1 Manual Annotation. . . 45
4.3.2 Hierarchical CRF with Combined Classes . . . 47
5 Experiments and Discussion 49 5.1 Experimental Setup . . . 49
5.2 Heading Identification . . . 50
5.3 Content Identification . . . 52
5.4 Automatic Structuring . . . 53
6 Conclusion 61 6.1 Research Questions . . . 61
6.2 Discussion . . . 62
6.3 Limitations . . . 65
6.4 Future Work . . . 66
xiii
List of Figures
2.1 NLP pipeline (taken from [22]) . . . 22
3.1 Support Vector Machine showing maximum margin hyperplane (taken from [34]). . . 33
3.2 Diagram of relationship among Naive Bayes, Logistic Regression, HMM, LC-CRF and general CRF (taken from [35]) . . . 35
3.3 Linear Chain Conditional Random Field (taken from [18]) . . . 35
3.4 Mammography and ultrasound lexicon (taken from [45]) . . . 37
3.5 Quadrant position of the breast (taken from [29]) . . . 38
3.6 BI-RADS assessment category and their description (taken from [45]) . 39 4.1 Example of annotated negative finding of a report . . . 46
5.1 Confusion matrix heat map: Heading identification using SVM . . . . 51
5.2 Confusion matrix heat map: Content identification using SVM . . . 52
5.3 Normalized confusion matrix heat map: Automatic structuring base-line model . . . 56
5.4 Normalized confusion matrix heat map: Automatic structuring Model A . . . 57
5.5 Normalized confusion matrix heat map: Automatic structuring Model B. . . 57
5.6 Error propagation through the classifiers at the 3 levels . . . 59
5.7 Automatic structuring: Comparison of the ground truth and the pre-dicted labels by Model B of a sample report . . . 59
xv
List of Tables
4.1 Attributes in the dataset and their description. . . 41
4.2 Example of manual annotation of a radiology report for heading and
content identification . . . 42
4.3 First, second and third level classes for automatic structuring. . . 45
5.1 Performance of classifiers in terms ofFM
1 scores for different feature
combinations for heading identification . . . 51
5.2 Heading identification performance in terms ofF1scores . . . 51
5.3 Content identification performance in terms ofF1scores . . . 52
5.4 Performance of NB and SVM classifiers in terms ofF1Mscores for
dif-ferent feature combinations for content identification . . . 53
5.5 Prediction of first level classes in terms ofF1score for the 3 models of
automatic structuring . . . 53
5.6 Prediction of second level classes in terms ofF1score for the 3 models
of automatic structuring . . . 54
5.7 Global classes in the dataset and theirF1scores . . . 55
5.8 Performance of the individual classifiers of Model A and B in terms
1
Part I
Automatic Structuring of Breast Cancer Radiology
Reports for Quality Assurance
Shreyasi Pathak University of Twente
Enschede, Netherlands s.pathak@student.utwente.nl
Jorit van Rossen Hospital Group Twente (ZGT)
Hengelo, Netherlands j.vrossen@zgt.nl
Onno Vijlbrief Hospital Group Twente (ZGT)
Hengelo, Netherlands o.vijlbrief@zgt.nl
Jeroen Geerdink Hospital Group Twente (ZGT)
Hengelo, Netherlands J.Geerdink@zgt.nl
Christin Seifert University of Twente
Enschede, Netherlands c.seifert@utwente.nl
Maurice van Keulen University of Twente
Enschede, Netherlands m.vankeulen@utwente.nl
Abstract—Hospitals often set protocols based on well defined standards to maintain quality of patient reports. To ensure that the clinicians conform to the protocols, quality assurance of these reports is needed. Patient reports are currently written in free-text format, which complicates the task of quality assurance. In this paper, we present a machine learning based natural language processing system for automatic quality assurance of radiology reports on breast cancer. This is achieved in three steps: we i) identify the top level structure of the report, ii) check whether the information under each section corresponds to the section heading, iii) convert the free-text detailed findings in the report to a semi-structured format. Top level structure and content of report were predicted with an F1 score of 0.97
and 0.94 respectively using Support Vector Machine (SVM). For automatic structuring, our proposed hierarchical Conditional
Random Field (CRF) outperformed the baseline CRF with an F1
score of 0.78 vs 0.71. The third step generates a semi-structured XML format of the free-text report, which helps to easily visualize the conformance of the findings to the protocols. This format also allows easy extraction of specific information for other purposes such as search, evaluation and research.
Index Terms—Quality Assurance, Automatic Structuring, Ra-diology Reports, Conditional Random Field
I. INTRODUCTION
Medical reports are essential for communicating the findings of imaging procedures with referring physicians, who further treat the patients by considering these reports. Thus, medical reports are very important for diagnosis of diseases, which brings forward the need of their quality assurance.
To maintain the quality of reports, hospitals often set well-defined protocols for reporting. For example, for breast cancer radiology reporting, hospitals generally use the “Breast Imaging-Reporting And Data System” (BI-RADS) [1], which is a classification system proposed by American College of Radiology (ACR), to represent the malignancy risk of breast cancer of the patient. It was implemented to standardize re-porting and quality control for mammography. The BI-RADS lexicon provides specific terms to be used to describe findings. Along with that, it also describes the desired report structure, for example, a report should contain breast composition and
a clear description of findings. The rate of compliance with these reporting standards can be used for quality assurance and also to further measure clinical performance [2].
Conformance to reporting standards can be seen as a part of assessing report clarity, organization, and accuracy [3], [4]. Quality assurance is currently mainly a manual process. Peer review is used to assess report quality, mainly geared towards accuracy of reports [5]. Yang et al. [6] used psychometric assessment to measure report quality and analyzed parame-ters like report preparation, organization, readability. Making quality assurance systems automatic would reduce workload of radiologists and make the process more efficient. To the best of our knowledge, no system exists to automate this process. Quality assurance is complicated due to the fact that report-ing is done in free-text, narrative format. The inaccessibility of narrative structure for computers makes it hard to analyze if all the necessary information are present in the report. Structured reporting templates can be introduced to force the radiologists to stick to the reporting standards and improve the quality of reports [7], [8]. However, a study [9] shows that this type of system resulted in lower quality reports, as it restricts the style and format of writing. Another method can be automatic structuring of free-text reports after they have been written, without additional technical burden on the radiologists. Thus, the radiologists can concentrate more on the task of interpreting images rather than structure of writing, which helps in maintaining accuracy of the report content.
(referred to as automatic structuring). For visualization and further use, we generate a semi-structured XML format for the automatic structuring (Table I). We focus on Dutch radiology reports on breast cancer; for automatic structuring we focus on findings from mammography imaging modality.
In the remainder of this paper, we first review structured reporting initiatives and application of natural language pro-cessing to radiology reports (Section II). Section III describes the dataset. Our approach to heading and content identifica-tion, and automatic structuring is detailed in Section IV. We describe our experimental setup in Section V followed by experimental results in Section VI. We discuss the implication of our results and some future work in Section VII.
II. RELATEDWORK
In this section, we will discuss structuring initiatives for radiology reporting, followed by various natural language processing techniques applied in radiology.
A. Structured Reporting Initiatives
Accuracy, clarity, timeliness, readability, organization are some of the important factors for good quality of radiology reporting [3], [4]. Sistrom and Langlotz [7] identified i) language, ii) format as two key attributes for improving the quality of a radiology report.Standardizing the languageof the report promotes common interpretation of the reports by the radiologists through out the world. Breast Imaging Reporting and Data System (BI-RADS) is a very successful attempt by ACR at standardizing the language for breast cancer reporting [1]. RadLex [10] is another attempt at standardizing disease terminology, observation and radiology procedure. Structured reporting further increases efficiency of information transfer and referring clinicians can extract the relevant information easily. Sistrom and Langlotz [7] clarified that structured re-porting does not mean having a point-and-click interface for data capture. They point out that it is rather a simple report format that reflects the way radiologist and referring physician sees the report and should not impose any restriction on the radiologists. Radiological Society of North America (RSNA) highlighted that structured reporting would improve clinical quality and help in addressing quality assurance[4].
Though there has been a lot of discussion about the effect of structuring on the quality of radiology report, not much actual assessment was done until 2005. In 2005, Sistrom and Honeyman-Buck [11] tested information extraction from text and structured reports. It was found that both the free-text and structured report resulted in similar accuracy and efficiency in information extraction, but a post-experimental questionnaire expressed clinicians’ opinion in favour of struc-tured report format. Schwartz, Panicek, Berk, Li and Hricak [8] reported that referring clinicians and radiologists found
greater satisfaction with content and clarity in structured reports, but the clinical usefulness did not vary significantly between the two formats. Whereas, a study by Johnson, Chen, Swan, Appelgate and Littenberg [9], concluded that struc-tured reporting resulted in adecrease in report accuracy and
completeness. The subjects were asked to use commercially available structured reporting system (SRS), a point-and-click menu driven software, to create the structured reports and they found it to be overly constrainingandtime-consuming.
To summarize, past works have shown that firstly, structured reporting and standard language are important for quality of report. But structured reporting should be such that it should not impose restriction on the radiologist. Secondly, structuring reporting can help in addressing quality assurance.
B. Natural Language Processing in Radiology
Electronic health records (EHRs), like radiology reports, increases the use of digital content and thus generates new challenges in the medical domain. It is not possible for humans to analyze this huge amount of data and extract relevant information manually, so automated strategies are needed. There are two types of techniques used in natural language processing for processing data:i) rule-based andii) machine learning-based approaches.
In rule-based approaches, rules are manually created by experts to match a specific task. Various rule-based systems have been used for information extraction tasks in radiology reports on breast cancer. Nassif et al. [12] developed a rule-based system in 2009 to extract BI-RAD related features from a mammography study. The system was tested on 100 radiology reports manually tagged by radiologists, resulting in a precision of 97.7% and a recall of 95.5%. Sippo et al. [13] developed a rule-based NLP system in 2013 to extract the BI-RAD final assessment category from radiology reports. They tested their system on >220 reports for each type of study – diagnostic and screening mammography, ultrasound etc. achieving a recall of 100% and a precision of 96.6%.
Machine learning (ML) approaches can learn the patterns from data automatically given the input text sequence and some labeled text samples.Hidden Markov Model,Conditional random field (CRF) [14] are some of the ML approaches used for sequence labeling. Hassanpour and Langlotz [15] compared dictionary-based (a type of rule-based) model, Conditional Markov Model and CRFs on the task of infor-mation extraction from chest radiology reports, finding that ML approaches (F1: 85.5%) performed better than rule-based
(F1: 57.8%). Torii, Wagholikar and Liu [16] investigated the
performance of CRF taggers for extracting clinical concepts and also tested the portability of the taggers on different datasets. Esuli, Marcheggiani and Sebastiani [17] developed a cascaded 2-stage Linear Chain CRF model (one CRF for identifying entities at clause level and another one at word level) for information extraction from breast cancer radiology reports. The cascaded system (F1: 0.873) outperformed their
baseline model of standard one level LC-CRF (F1: 0.846) on
500 mammography reports.
Clinical Data
s1: Verslag - Mammografie follow up bdz - 15-11-2016 09:50:00:
s2: Klinische gegevens:
s3: Screening ivm familiaire belasting mammacarcinoom ,
s4: Verslag:
s5: Mammografie t,o,v, 12/08/2016: Mamma compositiebeeld C, Geen wijziging in de verdeling van het mammaklierweefsel, Hierin beiderzijds geen haardvormige laesies, Geen distorsies, geen stellate laesies, geen massa's, bekende verkalking links, Geen clusters microkalk, geen maligniteitskenmerken,
s6: Conclusie:
s7: BIRADS-classificatie twee, Stationair beeld, Geen maligniteitskenmerken,
[image:23.595.126.479.83.232.2]Title Heading Heading Heading Findings Conclusion Content Identification Heading Identification
Fig. 1: Example of a breast cancer radiology report
entropy classifier. We want to develop a fully automated system without any rule creation involved from experts, which is why we will not follow hybrid approach.
In this work, we apply machine learning-based approaches to avoid manual rule construction and use CRFs which have been shown to provide high performance on sequence labeling. III. CORPUS: RADIOLOGYREPORTS ONBREASTCANCER
According to BI-RADS [19], a breast cancer radiology report should contain an indication of examination (clinical data), a breast composition, a clear description of findings, and a conclusion with the BI-RADS assessment category. For our purpose of quality assurance of a report, we will consider these things and annotate the reports accordingly.
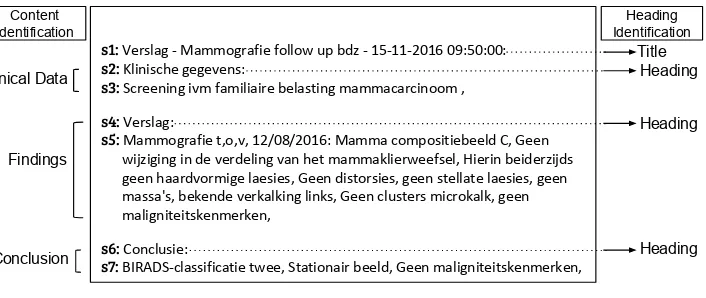
We used a dataset consisting of 180 Dutch radiology reports on breast cancer from 2012 to 2017 (30 reports per year). Thus, the dataset contains variation in reports over the years. The reports were gathered from a hospital in The Netherlands. The reports were produced by dictation from trainee or con-sultant radiologist, into an automatic speech recognition sys-tem. These automatically generated reports are further cross-checked with the dictation, by radiologists or secretary. The reports are anonymized such that they do not contain patient identity data like patient id, name, data of birth and address. A sample report is shown in Fig. 1. The report has 3 sections, namelyClinical Data,FindingsandConclusion.Clinical Data
contains clinical history of the patient including any existing disease or symptoms.Findingsconsists of noteworthy clinical findings (abnormal, normal) observed from imaging modalities like mammography, MRI and ultrasound.Conclusionprovides a summary of the diagnosis and follow-up recommendations and should necessarily contain a BI-RADS category. In the report, these sections start with a heading describing the name of the section, for example,Klinische gegevens(Clinical Data),
Verslag (Findings) and Conclusie (Conclusion) (see Fig. 1). Reports from 2017 and 2016 (60 reports) additionally contain a title. The dataset consists of both male and female breast cancer reports; for automatic structuring, we focus on female breast cancer reports.
For the first two sub-tasks of heading identification and content identification, 180 reports were manually annotated at the sentence-level by a trained expert. The reports were split into sentences, where a sentence means start of a new line, resulting in 1591 sentences in total. In Fig. 1, sentences are indicated by the labels s1 to s7. For the first sub-task of heading identification, sentences were labeled asheading(e.g. s2, s4, s6), not heading (e.g. s3, s5, s7) and title (e.g. s1). For the second sub-task of content identification, sentences were labeled astitle,clinical data(e.g. s2, s3),findings (e.g. s4, s5) andconclusion (e.g. s6, s7). For the third sub-task of automatic structuring of reports, we manually extracted the mammography imaging modality findings from the findings
section of the report, which generated 108 mammography findings. These were manually annotated by two radiologists – a trainee (2 years of experience) and a consultant. Out of 108 reports, 18 reports were labeled collaboratively by both, 45 reports by the trainee and 47 by the consultant. After labeling, these 45 reports and 47 reports were analyzed to highlight any inter-annotator discrepancy, which were further resolved by the annotators.
A 3-level annotation scheme at word-level was followed for automatic structuring as shown in Fig. 2. CA-n in the diagram will be explained in the approach (Section IV-C). At the first level, the reports were annotated as:
• positive finding(PF): something suspicious was detected
about the lesion in the breast, which might indicate cancer.
• negative finding(NF): nothing bad was found or absence
of specific abnormalities.
• breast composition(BC): density of the breast. • other(O): text not belonging to the above.
After this first level of annotation, the PF were further anno-tated into second level classes –mass(MS),calcification(C),
architectural distortion (AD), associated features (AF) and
asymmetry(AS). At the third level, mass was further annotated aslocation(L),size(SI),margin(MA),density(DE), AF and
shape(SH). Calcification was further annotated asmorphology
CA-1 Report CA-2 Positive Finding CA-3 Negative Finding CA-4
Mass CalcificationCA-5 Arch. Dis.CA-6 Assoc. F.CA-7 AsymmetryCA-8 Location Size Margin Density Assoc. F. Shape Location Size Morphology Distribution Assoc. F. Location Assoc. F. Location Location Size Assoc. F. CA-9 Mass CA-10 Calcification CA-11
Arch. Dis. Assoc. F.CA-12 AsymmetryCA-13 Location Location Margin Location Morphology Location Location Location Distribution Level 3 Level 1 Level 2 Breast Composition
Arch. Dis. - Architectural Distortion Assoc. F. - Associated Features
[image:24.595.75.526.84.259.2]all classifiers except CA-2 have an additional “Other” class
Fig. 2: 3-level annotation scheme for automatic structuring of mammography findings (Hierarchical Conditional Random Field Model A (Section IV-C2))
of second and third level annotation was followed for NF, though they have different combination of classes (as shown in Fig. 2). BC does not have any further levels of annotation. Thus, complete label (global) of a token is a concatenation of the labels at the 3 levels, resulting in 39 different labels. Our dataset only had data for 34 labels. Our model can also be applied to findings from other imaging modalities but it needs to be trained on manually labeled data for those modalities. Due to absence of labeled data from other modalities, we only performed automatic structuring of mammography findings.
IV. APPROACH
In this section, we describe our approach for the three sub-goals – heading identification, content identification, and automatic structuring of findings from mammography study.
A. Heading Identification
a) Feature extraction: Reports were separated into sen-tences as explained in Section III. The sensen-tences were separated into word-level tokens using regular expression
\b\w\w+\b, which means tokens with at least 2 alphanumeric
characters. Punctuations are always ignored and treated as token separator. For example, a sentence like“Mammografie t,o,v, 12/08/2016: Mamma compositiebeeld C” will generate
{mammografie, 12, 08, 2016, mamma, compositiebeeld} as tokens. Only unigrams were taken as tokens and converted to lowercase. The maximum document frequency was set such that the terms occurring in more than 60% of the documents will be ignored. Increasing the maximum document frequency did not improve the performance, so most probably high frequency non-informative words were removed.
Word List feature: A vocabulary was built using the unique words generated after preprocessing. Each sentence is repre-sented by a term vector, where TF-IDF score is used for the tokens present in the sentence and a zero for absent tokens.
The length of the sentence and the symbol at the end of sentence were also tested as features but they did not improve performance and were not considered further.
b) Classifiers: Heading identification is a multiclass clas-sification problem, where the sentences are to be classified into one of the following classes:heading, not heading andtitle. We trained a Multinomial Naive Bayes (NB), a linear Support Vector Machine (SVM) and a Random Forest (RF) classifier1.
For NB, Laplace smoothing was used. SVM was trained using stochastic gradient descent and L2 loss. We used a maximum tree depth of 10 and bootstrap sampling for RF classifier.
B. Content Identification
Content identification is a multiclass classification problem, where the sentences are to be classified intotitle,clinical data,
findings and conclusion. We followed the same approach as explained in Section IV-A.
C. Automatic Structuring
Our goal is to convert the free-text mammography find-ings into a semi-structured XML format. An example of this is shown in Table I, where the first column shows a free-text mammography finding report and the second col-umn shows the semi-structured XML version. Let X be a mammography finding report, consisting of a sequence of tokens, x=(x1,x2,..xt,..,xn) and the task is to determine a
corresponding sequence of labels y= (y1,y2,..yt,..,yn) for x.
This task can be seen assequence labeling, which is a task of predicting the most probable label for each of the tokens in the sequence. In this task, the context of the token, meaning labels of immediately preceding or following tokens, is taken into account for label prediction. To achieve our goal, we used a Linear-Chain Conditional Random Field (LC-CRF)2 [14],
1Classifiers were built using Python scikit-learn package
2We have used scikit-learn Python package, sklearn-crfsuite,
TABLE I: Example of structuring of free-text mammography finding
Free-text Report Structured Report
Mammografie t,o,v, 22/09/2016: Mamma compositiebeeld C, Geen wijziging in de verdeling van het mammaklierweefsel, Hierin beiderzijds geen haardvormige laesies, Geen distorsies, geen stellate laesies, geen massa’s, bekende verkalking links, Geen clusters kalk, geen maligniteitskenmerken,
hreporti hOiMammografie t,o,v, 12/08/2016:h/Oi
hbreast compositioniMamma compositiebeeld C,h/breast compositioni hOiGeen wijziging in de verdeling van het mammaklierweefsel,h/Oi hnegative findingi
hmassiHierinhlocationibeiderzijdsh/locationigeen haardvormige laesiesh/massi harchitectural distortioniGeen distorsies,h/architectural distortioni
hmassigeenhmarginistellatehmargini laesies, geen massa’s,h/massi h/negative findingi hpositive findingi
hcalcificationibekende verkalking hlocationilinksh/locationi h/calcificationi h/positive findingi
hnegative findingi
hcalcificationiGeen hdistributioniclustersh/distributioni
hmorphologyimicrokalk,h/morphologyi h/calcificationih/negative findingi hOigeen maligniteitskenmerkenh/Oi h/reporti
a supervised classification algorithm for sequence labeling. In our models, LC-CRF considers the label yt−1 of the
immediately preceding tokenxt−1 for predicting the labelyt
of the current tokenxt.
a) Data Preprocessing: Each report from the dataset of 108 mammography findings was split at punctuations {
,().?:-} (retaining them as tokens after splitting) and space, to generate tokens, x, which were transformed according to the IOB tagging scheme [20]. Here, B means beginning of an entity, I means inside (also including end) of an entity and O means not an entity. For example, as shown in Table I,
“Mamma compositiebeeld C,” labeled as breast composition
was transformed to [(mamma, B-breast composition), (com-positiebeeld, I-breast composition), (C, I-breast composition), (‘,’ , I-breast composition)], where each entry stands for (to-ken, label IOB scheme). Each digit was replaced by#NUMfor the purpose of reducing the vocabulary size without removing any important information.
b) Feature Extraction: Each extracted token,xt, is
repre-sented by a feature vectorxt for LC-CRF, including linguistic
features of the current token, xt. and also features of the
previous token, xt−1, and the next token, xt+1. A feature
vectorxt consists of the following 10 features forxt and the
same 10 features forxt−1and xt+1 (a total of 30 features):
• The token xt itself in lowercase, its suffixes (last 2 and
3 characters) and the word stem.
• Features indicating if xt starts with a capital letter, is
uppercase, is a Dutch stop word or is punctuation. The part-of-speech (POS) tag of xt and its prefix (first 2
characters).
Below, we describe the 3 models for automatic structuring:
1) Baseline Model: As baseline, we used one LC-CRF clas-sifier, as described at the starting of Section IV-C, to predict the complete label (concatenation of labels at the 3 levels) of a token and as input to the classifier, we used the feature vectors described in Feature Extraction (Section IV-Cb). For example, the LC-CRF classifier will predict the tokensclusters
and microkalk as NF/C/DI and NF/C/MO respectively (see Table I). The graphical representation of this model is shown in Fig. 3a. Here, xt−1, xt, xt+1 are feature vectors of the
tokens in a sequence and their corresponding labels areyt−1,
yt, yt+1, shown as NF/C/O, NF/C/DI, NF/C/MO. The lines
indicate dependency on feature vectors xt, xt−1, xt+1 and
preceding label yt−1 for prediction of the label yt. Thus, in
this model, only one classifier is used to predict 34 labels.
2) Hierarchical CRF: We built a model using a three-level hierarchy of LC-CRF classifiers, called model A, as shown in Fig. 2. The model has 13 LC-CRF classifiers and all the classifiers perform token-level prediction. One classifier (CA-1) is at level 1 for classifying the tokens into the first level classes. At level 2, there are 2 classifiers – one (CA-2) for
xt-2 xt-1 xt
PF/C/L NF/C/O NF/C/DI NF/C/MO yt+1
xt+1 links geen clusters microkalk
(a)
xt-2
yt+1 wt+1 zt+1
xt-1 xt xt+1
PF NF NF NF
C C C C
L O DI MO
links geen clusters microkalk
(b)
Fig. 3: Graphical representation of a) baseline CRF model and b) hierarchical CRF model, for input feature vectors xt−2 to
[image:25.595.80.521.93.232.2] [image:25.595.71.495.577.703.2]CB-1 Report CB-2 Positive Finding CB-3 Negative Finding CB-4 Mass Shape Density Asymmetry Breast Composition Arch. Dis Calcification CB-5 Other Location CB-6 Other Margin CB-7 Other Morphology CB-8 Other Assoc. F. CB-9 Other Size Calcification Mass Assoc. F. Arch. Dis. Asymmetry Example: Positive Finding/Assymmetrie/Size is decided by classifier chain CB-1, CB-2, CB-9
Arch. Dis. - Architectural Distortion Assoc. F. - Associated Features Level 1
Level 2
Level 3
Aggregated Classifiers
Distribution
all classifiers have an additional “Other” class
[image:26.595.74.526.85.218.2]Assoc. F.
Fig. 4: Hierarchical Conditional Random Field Model B
further classifying the tokens predicted as positive finding by CA-1, another (CA-3) for negative finding tokens. At level 3, there are 10 classifiers for further classification of tokens into third level classes. For example, the tokens classified as PF by CA-1 at level 1 and as MS by CA-2 at level 2, will be sent to CA-4 classifier to further get classified as either L, SI, MA, DE, SH or AF. The complete predicted label for each token is the concatenation of its predicted classes at the three levels. The graphical representation of this model is shown in Fig. 3b. For example, for given feature vectorsxt andxt+1of
the tokens clusters and microkalkrespectively and for given classes at the same-level of the immediately preceding token, the first level class predictions for both the tokens are NF. The feature vector of these tokens are sent to NF classifier, CA-3, for second level prediction, where they get classified as C. Consequently, they are sent to the calcification classifier, CA-10, where they get classified as MO and DI respectively. Labels at each level are combined resulting in NP/C/DI and NP/C/MO labels for the two tokens. The undirected lines are dependency lines and directed lines are flow between the 3 levels (y, w, z). There is no dependency line between the first two columns at the second level (w) as links goes to PF and geen to NF classifier and two different classifiers are independent of each other’s feature vectors and predicted class.
3) Hierarchical CRF with Combined Classes: As can be seen in Fig. 2, every classifier at level 3, predicts location
as one of its classes. All the locationclasses describe similar tokens like rechts, links, beide mamma. Thus, we build one classifier for the similar classes instead of having different classifiers. This will provide us with more training data for a classifier. Fig. 4 shows the modified model with combined classes having 9 classifiers. Henceforth, this is referred to as model B and all classifiers in this model are referred to as CB-n (n = 1, . . . ,9). We can see instead of having 11
classifiers that predictlocation(CA-n,n= 3, . . . ,13) in model
A, we have only one classifier CB-5 in model B. Analogously, classifiers were aggregated for MA, MO, DI, AF and SI. All the classifiers use LC-CRF and perform token-level prediction. When classifying a token, classifiers might contradict each other. Consider for example NF/MS: CB-5 and CB-6 are the
two classifiers predicting location, margin or other for the same token. If the predictions are location by CB-5 and other by CB-6, then location is selected (no contradiction). Similarly, if both classifiers predict other, then the resulting class is other (no contradiction). If the predicted class is location by CB-5 and size by CB-6, then the class with the highest a-posteriori probability is selected.
V. EXPERIMENTALSETUP
We used the F1 score to evaluate the performance of a
classifier on predicting different classes. The F1 score of a
class c1 is the harmonic mean of precision and recall of that
class and is defined as
F1=
2T P
2T P+F P+F N
with TP being the number of true positives, FP - false positives and FN - false negatives. As our problem is a multiclass prob-lem, the TP, FN, FP of a class are calculated according to one-vs-rest binary classification, where the class in consideration is positive and all other classes are negative.
We also measured F1 score of the models on the entire
test set using micro-averaged and weighted macro-averaged
F1(F1µandF1M).F
µ
1 was computed by calculating the TP as
sum over the TP of all the classes (same for FN, FP).FM
1 was
calculated by computing theF1scores of each class separately
and then averaging it. As, averaging gives equal weight to all the classes, the fact that our classes have unequal number of instances, is not taken into account. Thus, we used weighted averaging for FM
1 .F1M and F1µ gave similar results, so we
only reportFM
1 scores in the rest of the paper.
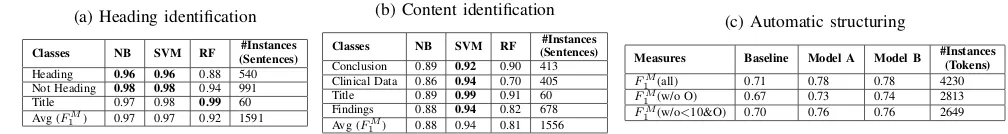
TABLE II: Heading and content identification and automatic structuring performance in terms ofF1 scores
(a) Heading identification
Classes NB SVM RF (Sentences)#Instances
Heading 0.96 0.96 0.88 540 Not Heading 0.98 0.98 0.94 991 Title 0.97 0.98 0.99 60 Avg (FM
1 ) 0.97 0.97 0.92 1591
(b) Content identification
Classes NB SVM RF (Sentences)#Instances
Conclusion 0.89 0.92 0.90 413 Clinical Data 0.86 0.94 0.70 405 Title 0.89 0.99 0.91 60 Findings 0.88 0.94 0.82 678 Avg (FM
1 ) 0.88 0.94 0.81 1556
(c) Automatic structuring
Measures Baseline Model A Model B #Instances(Tokens) FM
1 (all) 0.71 0.78 0.78 4230
FM
1 (w/o O) 0.67 0.73 0.74 2813
FM
1 (w/o<10&O) 0.70 0.76 0.76 2649
and match with the corresponding predicted labels. Phrase-level scores are important from the radiologists’ point of view. They care about how well their phrases are matching. Table IIIa shows 6 tokens, with their token-level labels (B-PF, I-PF etc). A PF phrase starts at the B-PF and ends at the last I-PF. For the NF phrase, the Dice’s coefficient is calculated as
2∗2/(3 + 3) = 0.66>0.65, resulting in a partial match. For each class, we calculate the number of partial matches called partial phrase accuracy (PP-Acc); how well the partial phrases match by averaging the Dice’s coefficient for each match (PP-Sim); the number of complete matches (CP-Acc); and theF1
scores for token-level matching (TLF1).
For heading and content identification, we evaluated NB, SVM and RF models, using 5-fold cross validation on 180 reports. For automatic structuring, we built three different LC-CRF models: the baseline model, Model A and Model B. We evaluated our models using 4-fold cross validation on 108 mammography findings. For automatic structuring, we evaluated the models on different combinations of classes (Table IIc). ‘All’ means evaluation on all the 34 classes. ‘w/o O’ means all the classes except the other (O) class at the first level (33 classes). ‘w/o<10&O’ means classes excluding
O class and classes with instances<10. All codes associated with this paper are available as open source3.
VI. RESULTS
In this section, we describe the results of heading and content identification and automatic structuring.
A. Heading and Content Identification
Table IIa shows that headings were identified with aFM
1
score of 0.96 both by SVM and NB and sentences which were not headings were identified with aFM
1 score of 0.98 by
SVM. For both heading and not heading classes, SVM and NB performed better than RF. For title class, RF performed better. Table IIb shows that the SVM performed better for predicting the classes conclusion, clinical data, title and findings with a
FM
1 scores of 0.92, 0.94, 0.99 and 0.94 respectively.
3https://www.dropbox.com/sh/y4czin4llue2t6w/AACqHRcC2pxg0zzg42Ju
PtQna?dl=0
B. Automatic Structuring
Table IIc compares the performance of our LC-CRF base-line model to the hierarchical LC-CRF Models A and B. Both, Model A and B (FM
1 =0.78) outperformed the
base-line model (FM
1 =0.71). No difference in performance was
observed within Model A and B. Without the not important
other (O) class, the model B has a FM
1 of 0.74. On further
removing classes with instances<10, theFM
1 score improves
from 0.74 to 0.76 for model B. This means that the classes having instances less than 10 were not predicted well enough. If we would have at least 10 instances for each class, then the
FM
1 score could be expected to be around 0.76.
Table IIIb shows the performance of the classifier (CA-1 and CB-1) at the first level in predicting breast composition,
negative finding, positive finding. BC (TL F1=0.94) and NF
(TL F1=0.95) were identified better than PF (TL F1=0.87).
This is because PF contains varied vocabulary for describing an abnormality, while NF contains specific terms like no pres-ence of mass, calcification. BC is also described using specific terms like “mamma compositiebeeld”. Token-level measure is always better than complete phrase-level measure. Partial phrase accuracy (PP-Acc) is at least as good as complete phrase accuracy (CP-Acc). All the partial phrase matches in BC and PF are complete matches except for NF. But even for NF, the partial phrases have similarity of 0.99 (PP-Sim) with the ground truth.
Table IV shows the performance obtained for the some of the global classes. Overall, it can be seen that NF sub-classes were predicted better than PF sub-classes, as most of the NF sub-classes are described using specific tokens. Generally, model A and B predicted PF sub-classes better than baseline. BC, NF/AF/O, NF/C/DI, NF/MS/MA and NF/C/MO were pre-dicted very well in all the models. Some classes were prepre-dicted better in baseline – NF/MS/O, NF/MS/MA and PF/C/O. This indicates that for these classes, the neighbouring global classes of the baseline model may be informative during prediction. Also, multi-level prediction increased the number of false positives for a class, specially for classes with greater number of instances. The effect of aggregated classifiers in model B TABLE III: Token level and phrase level measures
(a) Tokens and phrases
bekende verkalking links geen clusters microkalk
true B-PF I-PF I-PF B-NF I-NF I-NF
predicted B-PF I-PF I-PF O B-NF I-NF
true PF phrase NF phrase
predicted PF complete phrase match NF partial phrase match
(b) Token and phrase level scores
Classes TL F1 PP-Acc CP-Acc PP-Sim #Tokens #Phrases
BC 0.94 0.93 0.93 1.00 622 99
NF 0.95 0.97 0.91 0.99 1101 118
TABLE IV:F1measures of global classes for the 3 models of automatic structuring
Models BC NF/AF/O NF/C/O NF/C/DI NF/C/MO NF/MS/O NF/MS/MA PF/C/O PF/C/SI PF/C/L PF/MS/L PF/MS/MA PF/C/AF PF/AS/O
Baseline 0.89 0.96 0.81 0.98 0.95 0.93 1.00 0.45 0.00 0.50 0.30 0.53 0.00 0.00 Model A 0.94 0.96 0.76 0.98 0.91 0.88 0.96 0.37 0.00 0.44 0.40 0.72 0.18 0.58
Model B 0.94 0.96 0.81 0.99 0.97 0.89 0.97 0.37 0.22 0.60 0.47 0.70 0.00 0.56
#Instances 622 397 148 54 56 210 35 138 14 68 139 59 33 172
TABLE V: Error propagation through classifiers at the 3 levels
Measures Level2 A Level2 B Level3 A Level3 B
∆FM
1 0.05 0.04 0.17 0.16
#Instances 2191 2191 2093 2093
can be seen in NF/C/DI, NF/C/MO, PF/C/L, PF/MS/L and PF/C/SI. As the aggregated classifiers were trained on all L, DI, MO and SI in the dataset, it resulted in better prediction of third level classes like L, SI, even with few instances (14 tokens of PF/C/SI). But aggregating classifiers also resulted in loss of information about the context, which is reflected through slightly lower performance in model B for classes PF/MS/MA, PF/C/AF and PF/AS/O. Aggregating AF classifier (CB-8) did not help in predicting any third level AF classes in PF due to not much similarity in their descriptions.
Table V gives an indication on error propagation through the classifiers at the 3 levels for Model A and B. ∆FM
1 at a
level indicate the difference in FM
1 of that level of classifiers
on predicted classes when given true classes from previous level and when given predicted classes from previous level. This can be interpreted as error made by the classifiers at the previous level. Error made by level 1 (∆FM
1 at level 2) is
not much significant as compared to error by level 2 (∆FM
1
at level 3) as the latter is a combination of errors from both level 1 and level 2 classifiers, while the former only considers error from level 1.
VII. CONCLUSION ANDFUTUREWORK
We have addressed three tasks for the purpose of quality assurance of radiology reports: heading identification, con-tent identification and automatic structuring using BIRADS standard. Heading and content were identified with a FM
1
score of 0.97 and 0.94 respectively using SVM. For automatic structuring, hierarchical CRF (FM
1 =0.78) performed better
than baseline CRF (FM
1 =0.71), while Model A and B did not
show any significant difference.
From the point of view of quality assurance, heading and content contribute to identification of the presence of indication of examination, findings and conclusion. A post-processing step can be performed to check if the content corresponds to the correct heading. Automatic structuring is used to check the presence of clear description of findings. According to BI-RADS, findings should contain mass, cal-cification, asymmetry, architectural distortion and associated features. Our model structures the findings automatically into these concepts, further generating a semi-structured XML format. This provides a platform to check the presence of important concepts. Another important information that must
be present in reports is breast composition. Our model predicts breast composition with 0.94F1score.
As future work, the presence and quality of BI-RADS cate-gory can be evaluated. Based on findings, BI-RADS catecate-gory can be predicted to check how well it was assigned. More reports can be labeled to get more training data. Development of a prototype and actual trial in clinical practice can be done. The approach taken in this research can also be extended to reports for other conditions, written in other languages.
REFERENCES
[1] Breast imaging reporting and data system. BI-RADS Committee, American College of Radiology, 1998.
[2] H. H. Abujudeh, R. Kaewlai, B. A. Asfaw, and J. H. Thrall, “Quality initiatives: key performance indicators for measuring and improving radiology department performance,”Radiographics, vol. 30, no. 3, pp. 571–580, 2010.
[3] A. J. Johnson, J. Ying, J. S. Swan, L. S. Williams, K. E. Applegate, and B. Littenberg, “Improving the quality of radiology reporting: a physician survey to define the target,”Journal of the American College of Radiology, vol. 1, no. 7, pp. 497–505, 2004.
[4] C. E. Kahn Jr, C. P. Langlotz, E. S. Burnside, J. A. Carrino, D. S. Channin, D. M. Hovsepian, and D. L. Rubin, “Toward best practices in radiology reporting,”Radiology, vol. 252, no. 3, pp. 852–856, 2009. [5] N. Strickland, “Quality assurance in radiology: peer review and peer
feedback,”Clinical radiology, vol. 70, no. 11, pp. 1158–1164, 2015. [6] C. Yang, C. J. Kasales, T. Ouyang, C. M. Peterson, N. I. Sarwani,
R. Tappouni, and M. Bruno, “A succinct rating scale for radiology report quality,”SAGE open medicine, vol. 2, p. 2050312114563101, 2014. [7] C. L. Sistrom and C. P. Langlotz, “A framework for improving radiology
reporting,”Journal of the American College of Radiology, vol. 2, no. 2, pp. 159–167, 2005.
[8] L. H. Schwartz, D. M. Panicek, A. R. Berk, Y. Li, and H. Hricak, “Improving communication of diagnostic radiology findings through structured reporting,”Radiology, vol. 260, no. 1, pp. 174–181, 2011. [9] A. J. Johnson, M. Y. Chen, J. S. Swan, K. E. Applegate, and B.
Litten-berg, “Cohort study of structured reporting compared with conventional dictation,”Radiology, vol. 253, no. 1, pp. 74–80, 2009.
[10] C. P. Langlotz, “Radlex: a new method for indexing online educational materials,” 2006.
[11] C. L. Sistrom and J. Honeyman-Buck, “Free text versus structured format: information transfer efficiency of radiology reports,”American Journal of Roentgenology, vol. 185, no. 3, pp. 804–812, 2005. [12] H. Nassif, R. Woods, E. Burnside, M. Ayvaci, J. Shavlik, and D. Page,
“Information extraction for clinical data mining: a mammography case study,” inData Mining Workshops, 2009. ICDMW’09. IEEE Interna-tional Conference on. IEEE, 2009, pp. 37–42.
[13] D. A. Sippo, G. I. Warden, K. P. Andriole, R. Lacson, I. Ikuta, R. L. Birdwell, and R. Khorasani, “Automated extraction of bi-rads final assessment categories from radiology reports with natural language processing,”Journal of digital imaging, vol. 26, no. 5, pp. 989–994, 2013.
[14] J. Lafferty, A. McCallum, and F. C. Pereira, “Conditional random fields: Probabilistic models for segmenting and labeling sequence data,” 2001. [15] S. Hassanpour and C. P. Langlotz, “Information extraction from multi-institutional radiology reports,”Artificial intelligence in medicine, vol. 66, pp. 29–39, 2016.
[16] M. Torii, K. Wagholikar, and H. Liu, “Using machine learning for concept extraction on clinical documents from multiple data sources,”
[17] A. Esuli, D. Marcheggiani, and F. Sebastiani, “An enhanced crfs-based system for information extraction from radiology reports,”Journal of biomedical informatics, vol. 46, no. 3, pp. 425–435, 2013.
[18] R. K. Taira, S. G. Soderland, and R. M. Jakobovits, “Automatic structuring of radiology free-text reports,”Radiographics, vol. 21, no. 1, pp. 237–245, 2001.
[19] E. A. Sickles, C. J. D’Orsi, L. W. Bassett, and et al, ACR BI-RADS Mammography. In, Reston, VA, 2013.
13
Part II
15
Chapter 1
Introduction
In this section, we give an overview of the field of radiology and problems associated with the current way of radiology reporting. Then, we introduce our approach to address the problems and explain the research questions associated with it.
1.1
General Overview of Radiology
Radiology is the science of diagnosing diseases using medical images. There are dif-ferent imaging techniques like X-ray radiography, ultrasound, Magnetic resonance imaging (MRI). The radiographer is assigned with the task of acquiring medical im-ages through these techniques. The radiologist interprets the imim-ages produced by the radiographer and writes a report listing his findings and diagnosis. The report is then sent to the referring physician who diagnoses and treats patients by considering these radiology reports.
1.2
Current Scenario and Problems Associated with it
The radiology reports are written by the radiologists currently in free-text format. The contents of the report are written in a narrative style in the order and format as deemed fit by the radiologist. Thus, absence of standardized structure in the reports creates several problems, as listed below:
1. Difficulty in information extraction by radiologists as well as physicians.
2. Different writing styles of different radiologists makes readability of reports hard for physicians.
3. Hard to assess quality of radiology reports and analyze how well the radiolo-gists are conforming to the standards.
The problems listed above will be explained in detail in the following paragraphs.
16 Chapter 1. Introduction
The second problem is free-text writing styles decreases readability of reports. As there is no strict structured format for writing the reports, the radiologists write the report in their own structure. For example, in general, the indication/clinical data part of the report are written at the beginning of the report. It may be that some radiologists write the clinical data at the end of the report or may be they forgot to write it at the beginning. This creates difficulty for the referring physician as he has to search through the whole report to find the information he needs and adapt him-self to different writing styles of different radiologists. This results in decrease of readability, which further gives rise to reports not being read intensively and some of the information in the reports remaining unused.
The third problem is free-text writing style makes it hard to assess quality of the reports written by the radiologists. Among various things, quality of radiology re-ports can be assessed by its structure, standardized use of language and how well the radiologists are adhering to set reporting standards. For example, Breast cancer radiology reports use "Breast imaging-reporting and data system"(BI-RAD), which is a classification system proposed by American College of Radiology, to represent the malignancy risk of breast cancer of the patient. It was implemented to standard-ize risk assessment and quality control for mammography and to provide a general understanding of the findings to non radiologists. BI-RAD lexicon lists the terms that can be used to report different findings after analyzing medical images. Based on these findings, the radiologist gives a BI-RAD assessment category (can be num-bered from 0-6) at the conclusion of the report. Often the radiologists want to know how correctly they are doing their job of assigning a BI-RAD score to a report. For quality assurance purpose, it would be interesting to perform a check on whether the BI-RAD assessment by the radiologists correspond to the prescribed standard. Another important quality check is if the reports are following BI-RADS guidelines.
A study [13] done on 244 breast cancer imaging reports from 2004 reported that only
half of the reports were concordant with reporting standards. The least reported variables were breast density (reported in 24% reports), lesion depth (37%), lesion shape (55% for mammography) and location (59%). With the current free-text for-mat, it is hard to analyze if all the necessary information are mentioned in the report and how well the BI-RAD score given by the radiologist, corresponds with the find-ings. This makes the quality assurance difficult in free-text format reports.
1.3
Possible Solutions and Our Approach
Out of the three problems discussed in Section1.2, we decided to focus our work on
addressing the third problem - Quality assurance. According to literatures [16,17],
quality of a radiology report can be assessed by its accuracy, timeliness, clarity, orga-nization etc. For our project, quality assurance means how well the report conforms with the well-defined protocols of radiology report writing and this in turn will help in checking clarity, accuracy and organization. At the basis of this quality assurance, we will be converting the free-text reports to a structured format for making the task of comparison of reports to well-defined protocols easier.
1.4. Research Questions 17
developing a report structuring software which guides the radiologist during
writ-ing, thus restricting his style and format of writing. An already existing work [15]
shows that this type of system resulted in lower quality reports. Thus, this type of guiding systems deteriorates the task of radiologists in interpreting the images.
Another approach is converting the free-text reports to structured format after the reports have been written by the radiologists in their own style. This method does not impose any particular structure of writing on the radiologists. A system can be developed which takes free-text reports written by the radiologist and convert it to a structured format automatically without involvement from the radiologist. Thus, the radiologists can concentrate more on the task of interpreting images and listing the findings rather than thinking how it should be written, which helps in maintain-ing accuracy in the task of image interpretation.
For this project, we decided to adopt the second approach so as not to decrease radiologist’s performance. To summarize, our aim is to develop a system which will automatically structure the radiology reports for the purpose of quality assur-ance and for our project, we focus on breast cassur-ancer reports. We will convert the reports into a semi-structured format and not a table-of-contents structured format. The difference between these two are that in semi-structured format, the informa-tion present in the report are labeled and structured. Whereas, in table-of-contents structured format, a table is constructed having entries for all possible information that can be in a report. For each report, only those cells are filled up, corresponding to which there is information in the report and other cells remain empty. Quality of a breast cancer radiology report will be assessed according to ACR BI-RADS rules
[30]. The department of radiology at Hospital Group Twente (ZGT) provided with
the breast cancer radiology reports.
1.4
Research Questions
The main research question of our research is as follows:
“To what degree can we successfully conduct quality assurance of radiology reports using machine learning algorithms?”
The main research question is divided into the following sub-research questions:
1. (RQ-1)How can we identify the most apparent top level structure from the report
us-ing machine learnus-ing?
The ACR BIRADS [30] mention that a report should contain indication of
ex-amination (clinical data), clear description of findings and a conclusion. We performed heading identification to identify the top-level structure.
2. (RQ-2) How can we automatically verify if the information in the report has been
placed under the correct top level sections (from RQ-1)?
18 Chapter 1. Introduction
3. (RQ-3)To what extent can we automatically convert the free-text findings from the
report into a detailed structured format?
We took the findings section from the report and converted it to a structured format for checking if the findings contain all the necessary information. The findings section can have findings from different imaging modalities like mam-mography, ultrasound and MRI. For this project, we only considered findings from mammography. In consultation with the radiologists, a structure of the mammography findings was developed based on ACR BI-RADS. Mammog-raphy finding contains mass, asymmetry, calcification, architectural distortion and associated features and our structure was created to identify these classes.
19
Chapter 2
Related Work
This section contains discussion of various literatures on evolution of radiology re-porting and how the radiology reports can be analyzed by computer to extract
mean-ingful data out of it. Section2.1talks about the history of radiology reporting and the
expected quality of the reports. In Section2.2, we discuss the structured report
ini-tiatives that have been taken till now and the viewpoint of the two reporting style –
free-text and structured. Section2.3talks about different methods developed for
au-tomatic analysis of radiology reports. It introduces natural language processing and its two types of techniques used for processing the data – rule based and machine learning based. Literatures using different types of machine learning approaches for processing radiology reports have been discussed. There is also a short discussion on deep learning techniques being used for processing radiology reports.
2.1
Introducing Radiology Reporting and its Qualities
Radiology reports are very essential for communicating the findings of imaging pro-cedure with referring clinicians and patients. Based on these reports, the referring clinician gets a better understanding of the patient’s condition and decides upon the treatment. This importance of a radiology report leads to the need of their quality assurance. The reports need to be concise, clear, understandable and also need to be written correctly.
Wilhelm Rontgen, the discoverer of X-rays, published the earliest radiology report
called Ueber Eine Neue Art von Strahlen [27] in 1896. The importance of good
quality of radiology report was first recognized by Preston M. Hickey in 1922 [12].
Hickey wanted to assess the radiologists by looking at the quality of their radiol-ogy reports. He suggested that each radiologist interested in seeking admission to American Roentgen Ray Society (ARRS) will be required to submit 100 radiology reports with their application. He stressed on the fact that a standardized
nomencla-ture should be used in writing radiology reports [12]. Qualities of a good radiology
report was summarized by Armas [1] in 1998. He listed 6 C’s namely clarity,
correct-ness, confidence, concision, completeness and consistency as characteristics of good quality report.
In 2010, Pool and Goergen [23] did literature review to identify the important
20 Chapter 2. Related Work
guidelines of professional standards of radiology reports namely ACR, the Canadian Association of Radiologists, the Royal College of Radiologists and Society of Inter-ventional Radiology. They found out that existing guidelines had several weakness related to scope, purpose, methods of development, stakeholder consultation etc. and there was a lot of difference in the languages used to describe images, diagnos-tic uncertainty. They also found that many survey pardiagnos-ticipants preferred structured or itemized style of radiology report, but not many studies exist about the effect of report structure on its quality.
Another very recent paper published in 2017 talks about different ways that radi-ologists can make the reporting more effective by just following some simple steps
[39]. It asks radiologists to organize their thoughts, be clear, take responsibility, close
the loop on incidental findings, make reports readable for patients and be an expert consultant.
2.2
Structured Reporting Initiatives
There is active research going on related to improving quality of radiology report.
Sistrom and Langlotz [33] identified i) standard language, ii) structured format as
two key attributes for improving the quality of a radiology report.Standardizing the
languageof the report promotes common interpretation of the reports by the radiolo-gists through out the world. To bring standardization into effect, in 2006, Radiology
Society of North America (RSNA) created a lexicon called RadLex [19] which
pro-vides standard terminology for diseases, observation and radiology procedure. Each term in RadLex also contains all its synonyms and other related terms.
It was further understood that increasing readability of radiology reports can be
attained by putting the information in astructured format. Structured format
facili-tates reuse and retrieval of report content both by human readers and information systems. In the next paragraphs, we will see various literatures where the effects of structured reporting have been studied.
In a research paper [25], Reiner, Knight and Siegel talk about the evolution of
ra-diology reports and different methods adopted in changing the free-text rara-diology report to structured text. They proposed a graphical system that directly maps the terminologies in the report to standardized lexicon RadLex. RSNA established a Ra-diology Reporting Committee to promote best practices in raRa-diology reporting. This committee consisting of radiologists and imaging informatics experts conducted a workshop in 2008 to address the issue about structured reporting and how it should be adopted throughout radiology. The highlights of the workshop was published in
2009 by RSNA [17]. It stresses on the fact that structured reporting would help in
re-search, teaching and clinical quality improvement. It established a framework about the contents of a radiology report such as administrative information, patient iden-tification, clinical history, imaging technique, comparison, observations, summary or impression and signature. This paper also discusses that structured reporting can help in addressing quality assurance and subsequently lists the quality metrics that can be derived from radiology report data.
2.2. Structured Reporting Initiatives 21
2005, Sistrom and Honeyman-Buck [32] performed an experiment to test the
accu-racy and speed of the reviewers in extracting case-specific information from free-text and structured report. A web-based testing mechanism was used to give radiology reports to 16 senior medical students, who were asked to answer 10 multiple choice questions on each of the 12 cases. Students were randomly assigned either free-text or structured report. Three things were recorded while they answered the questions-the number of questions answered correctly for each case, questions-the time taken for each case and the number of questions answered correctly per minute. At the end of the test, it was found that both the free-text and structured report resulted in similar ac-curacy and efficiency in information extraction. A post-experimental questionnaire was also conducted where the subjects expressed an opinion in favour of the struc-tured report format.
In another study conducted in 2009 by Johnson and his colleagues [15], it was
re-ported that structured reporting may be inferior to free-text reports. A cohort study of structured radiology reporting was compared with conventional dictation reports and the quality of the report was graded based on accuracy and completeness. The study involved 16 resident radiologists in the control group and 18 in the interven-tion group. The residents in the interveninterven-tion group were asked to use commercially available structured reporting system(SRS), a point-and-click menu driven software, to create the structured format reports and the residents in the control group used the free-text dictation format. It was concluded that the structured reporting resulted in a decrease in report accuracy and completeness, which could in turn affect patient care. Accuracy decreased from 91.5 to 88.7 and completeness decreased from 68.7 to 54.3 when using SRS. The residents also complained that SRS was overly constrain-ing and time-consumconstrain-ing. It did not allow them to use desired content in the report. Even then most of the residents commented that the idea of structured reporting is appealing and good reporting skills and standardized terminology are important in clinical practice.
Schwartz and his colleagues [28] did a similar study in 2011 to compare the
con-tent, clarity and clinical usefulness of conventional dictated radiology reports and template-structured reports and their outcome differed from the study conducted
by Johnson [15]. Referring clinicians and radiologists found greater satisfaction with
content and clarity in structured reports, but the clinical usefulness graded using a
radiology report grading scale (PCOS) [26] did not differ significantly between the
two types of report.
Another recent study conducted in 2015 by Powell and Silberzweig [24] showed
evidence in favour of structured reporting. An online survey related to the develop-ment and experience of structured reporting was sent to the members of Association of University Radiologists and around 59.5% of the respondents reported to be sat-isfied with structured reports. The study showed that many radiology departments were experimenting with structured reporting and departments using structured re-port format had less error in their rere-ports. But many of the radiologists stated that structured reporting had a lot of limitations like report formats are variable and com-plex patient images may not properly fit into this structure.