publisher policies. Please scroll down to view the document itself. Please refer to the repository record for this item and our policy information available from the repository home page for further information.
To see the final version of this paper please visit the publisher’s website. access to the published version may require a subscription.
Author(s): Wiji Arampulam with Alison L Booth & Mark L Bryan Article Title: Are there asymmetries in the effects of training on the conditional male wage distribution
Year of publication: 2008
on the Conditional Male Wage Distribution?*
by
Wiji Arulampalam
Department of Economics University of Warwick
Coventry CV4 7AL United Kingdom Fax: +44 (0)24 7652 3032
Email: wiji.arulampalam@warwick.ac.uk
Alison L Booth
Economics Program
Research School of Social Sciences H C Coombs Bldg
The Australian National University Canberra ACT 0200
Australia Fax: +61 2 6125 0182
And
The University of Essex Email: alison.booth@anu.edu.au
Mark L Bryan
Institute for Social and Economic Research (ISER) University of Essex,
Colchester CO4 3SQ United Kingdom Fax: +44 (0)1206 873151 Email: markb@essex.ac.uk
Abstract
JEL: J24, J31, C29
Keywords: private sector training, education, quantile regression.
*Corresponding author is Mark Bryan, markb@essex.ac.uk
1. INTRODUCTION
The mean returns to various forms of human capital have been extensively investigated in
the labour economics literature, especially the returns to formal education and work-related
training.1 Relatively recently, attention has shifted to exploring the degree to which
education might be associated with more complex changes in the conditional wage
distribution. Arias, Hallock and Sosa-Escudero (2001), Gonzales and Miles (2001) and
Martins and Pereira (2004) estimate the returns to education across the conditional wage
distribution using quantile regression (QR) techniques. Martins and Pereira (2004) use
cross-sectional data from a variety of different data sources covering 15 European
countries plus the USA and find that “returns to schooling increase over the wage
distribution”. Martins and Pereira, as well as Arias et al., point out the implications of
these results, that increased education may be associated with a widening of the
(conditional) wage distribution, and may not always improve the prospects of low-earning
workers as much as hoped by policy makers. In related studies, Budria and Pereira (2005)
and Angrist, Chernozhukov and Fernandez-Val (2006) use QR techniques to disaggregate
the returns to education by education level. They find that the widening returns to
education over the wage distribution are driven largely by the widening returns to
college-educated individuals.
Our purpose in the present paper is to see if there is also an upward-sloping profile
for training across the conditional wages distribution. Education and work-related training
are complementary, as numerous studies attest (see Arulampalam, Booth and Bryan, 2004
and references therein). Hence we might expect to observe an upward sloping profile
when we graph the training association across quantiles of the conditional wage
1
distribution.2 We also wish to document how observed training associations differ across
the European Union (EU) countries for which we have harmonised data.3 Using the first
six waves of the European Community Household Panel (ECHP), we carry out this
analysis for private sector men in ten European Union countries.
In a perfectly competitive labour market, there are good reasons to expect that
percentage returns to investment in similar forms of human capital might be the same
across the conditional wage distribution. If capital and labour markets function according
to the competitive paradigm and if human capital is general, any individual investment in
human capital should yield equal percentage returns across the distribution.
However, it is possible that skills packages offered by firms to workers might differ
across the wage distribution in ways that are unobservable to the econometrician. For
example, any complementarities between unobserved ability and work-related training
might result in an upward-sloping profile when we graph the training correlation across
quantiles of the conditional wages distribution. Moreover, training courses offered by firms
to workers are likely to vary in their degree of specificity or generality. Training that is
specific and partially firm-financed will produce lower individual wage-returns than
self-financed general training. Using the harmonised ECHP data, we can measure the more
formal types with our training measure and on-the-job training with our tenure measure.
But we cannot hope to capture the skill-mix heterogeneity of training courses offered by
firms, not least because the training indicators typically combine different training types
2
Although there has been a recent surge in the estimation of wage equations using quantile regression techniques (see Fitzenberger, et al, 2001, for some applications), to our knowledge there are no studies investigating the association between work-related training and the conditional wage distribution.
3
(heterogeneous treatments) into a single training measure. Analogously, the quality of
training courses is unobserved by the econometrician and yet might well affect the profile
of training returns across the conditional wages distribution. Lastly, monopsonistic models
of work-related training suggest that in imperfectly competitive labour markets there will
be a wedge between wages and marginal productivity that is increasing in training intensity
(see Acemoglu and Pischke, 1999). Since this is unobserved in the vast majority of data
sets, this too might affect the profile of training returns across the conditional wages
distribution.
In summary, for all these reasons we wish to see if the returns to training events
vary across the conditional wages distribution. In the next section we describe our data
source, estimating sub-samples, and the principal variables used in our analysis. In Section
3 we outline the econometric model, while in Section 4 we first present the OLS results
and then the QR estimates from two specifications. The final section draws some
conclusions.
2. THE DATA AND EXPLANATORY VARIABLES
2.1. The Data Source and the Sample
Our data are from the first six waves of the European Community Household Panel
(ECHP), a large-scale survey collected annually since 1994 in a standardised format that
facilitates cross-country comparisons. The ECHP was specifically designed to be
harmonised at the input stage: in most countries a standard questionnaire was used, with
harmonised definitions and sampling criteria. Although a standardised questionnaire does
not overcome the nuances of interpretation and meaning between different languages, the
harmonised format greatly facilitates cross-country comparisons.
We include in our analysis the ten European countries listed in Table 1. We have
only five waves for Austria and four waves for Finland, as they joined the ECHP after
1994. For Britain we use only the first five waves because the format of the training
question altered from 1998 onwards (for further details, see Booth and Bryan, 2007). We
omit Greece and Portugal from our estimation owing to apparent gaps in the training data
and because of the smaller estimating sub-samples with usable information. We also omit
Germany because the training variables are not comparable to the other countries.4 The
ECHP data for Britain were adapted from existing national household surveys, while the
other countries used the full harmonised questionnaire. Sample sizes are reported in
Column [1] of Table 1 and in Column [7] of the Data Appendix Table.
In earlier work using the ECHP, we found that training incidence is typically
significantly higher in the EU public sector than the private (Arulampalam, Booth and
Bryan, 2004). This finding came as no surprise, since private sector firms are more likely
than the public sector to be constrained by the need to make profits, and so they may be
less willing to finance training through fears of losing trained workers to rival non-training
firms. Our preliminary testing showed that it is inappropriate to pool private and public
sector workers, since the coefficients across the sub-groups differ significantly, as might be
expected given that public and private sector employers typically have different objective
functions. We therefore only focus on the private sector in this study. We also consider
only men, although in a separate study we investigate the gender wage gap using QR
techniques and the ECHP data (Arulampalam, Booth and Bryan, 2007).
It is well-known that EU countries differ with regard to their vocational training
and education systems. We wish to avoid conflating work-related training with initial
4
vocational education or training. We therefore exclude from our analysis individuals under
the age of 25 years, paid apprentices, and those on special employment-related training
schemes (apprentices and those on special training schemes account for only 1.1% of the
sampled age group). We also exclude workers aged 55 years or more. This is because,
among older workers, there may be differential withdrawal from the labour force
depending on, for example, how early retirement schemes operate.
For each country, our estimating sub-sample therefore comprises employed private
sector men who are: (i) between the ages of 25 and 54 years and working at least 15 hours
per week; (ii) not employed in agriculture; (iii) with valid observations for the principal
variables used in the wage equations; and (iv) with sequences of continuous observations
starting from the first wave in the sample in order to have a complete training record (see
also Data Appendix). Individuals can be present for a minimum of two waves (including
the first wave) and a maximum of six waves for all countries except for Austria and Britain
(where the maximum is five) and Finland (where the maximum is four). For the
econometric model described in Section 3, we require a complete record of training for
each individual and so we drop any observations which follow a break in the data.
Therefore, if an individual is observed in waves 1, 2, 3, 5 and 6, we use waves 1, 2 and 3
only.
The restriction of working at least 15 hours per week was necessary because of the
nature of the ECHP data, where – in the first two waves – we were unable to distinguish
individuals regularly working fewer than 15 hours from those out-of-the labour force. In
addition, some important variables like firm size and tenure are only available for
individuals working 15 hours or more. Thus our estimating sub-samples will
under-represent low-hours part-timers (though for most countries these under-represent only a tiny
We include in our analysis the ten European countries listed in the tables and
estimate the models using pooled person-year observations. Because of the definition of
the training variable, individuals stay in the sample continuously until they fail to give an
interview, which results in an unbalanced panel with different individuals contributing
different numbers of observations.
2.2. The Training Variable
The form of the training question, harmonised across countries in the ECHP, is as follows:
“Have you at any time since January (in the previous year) been in vocational education or
training, including any part-time or short courses?” Although separate training courses
within the reference period are not identified, respondents are asked for the overall
duration and start/end dates of the training. Since the reference period may overlap with
the reference period of the previous wave, to avoid double counting, where possible we use
the start and end dates to identify training events specific to each wave.5 Our training
variables are then based on indicators of completed training events. As we discuss below,
we estimate two specifications of the econometric model. The first uses the cumulative
count of completed events since the first wave of the sample, while the second
specification uses an indicator for a completed training event in the last 12 months. Most
studies simply examine the impact of training incidence (and sometimes intensity) on
wages, but not the number of events. Exceptions are Lillard and Tan (1992), Arulampalam,
Booth and Elias (1997), Blundell et al. (1999), Arulampalam and Booth (2001), and Booth
and Bryan (2007). Lillard and Tan (1992: p31) note that multiple training occurrences
5
within a period are typically not known from US survey data. We follow Lillard and Tan
(1992) in our first specification, in using the accumulated sum of all training events, where
there is only one event measured at each wave owing to the nature of our data.
The framing of the training question suggests that the training responses should be
interpreted as more formal courses of instruction, rather than informal on-the-job training
(for which we control – at least in part – using job tenure). A separate question asks about
“general or higher education”. Participation in these more general courses is very low
(average annual take-up by 25-54 year olds is less than 1%) so we are confident that our
results are not affected by interactions with countries’ differing formal educational
systems.
Our measure of work-related training is based on a harmonised questionnaire and
there are two additional reasons why it is likely to be robust across countries. First, there is
typically much less regulation of work-related training than initial training and education.
Second, as noted above the incidence of general education after age 25 is very low
(typically less than 2%), so there is little danger of confusing training and education.
Table 1 reports information about completed training courses for private sector men
by country. The first column gives the number of observations for each country, while the
second column reports the mean number of waves for each country. The third column
reports training incidence for completed courses only. For example, the first row of Table 1
shows that the Austrian sub-sample comprises 786 private sector men who are observed in
three waves on average and of whom 15% have completed a training course in any year.
The mean accumulated training count is simply the product of the second and third
columns. The figures in the third column show that training incidence differs considerably
across countries. We can identify three high-incidence countries – Britain, Denmark and
In contrast Austria, Belgium and France form a group of medium-incidence countries,
where each year between 10% and 15% of men complete training courses. Finally, Ireland,
Italy, the Netherlands and Spain have incidence below 10%.
Though our sample is limited to men in the private sector, the cross-country pattern
summarised in Table 1 is similar to that found in analysis of overall training (Arulampalam
et al., 2004). The ranking also compares reasonably well (especially for the high incidence
countries) with the cross-country comparisons using different data sources reported in
OECD (1999); and with International Adult Literacy Survey (IALS) data on continuing
training for several countries featured in OECD (2003).
2.3. Hourly Wages
The dependent variable is the log of the average hourly wage, including overtime
payments, in the respondent’s main job. The log wage was calculated from the ECHP
variables as the log of normal gross monthly earnings (including overtime payments) from
the main job, scaled to a weekly basis and then divided by weekly hours (including
overtime) in the main job. No specific information is provided on overtime hours and
premia. The characteristics of each country’s unconditional log wage distribution, deflated
to 1999 prices, are reported in Table 2. The deflators are the European Union’s harmonised
indices of consumer prices (HICP; see Eurostat Yearbook, 2002). To allow cross-country
comparisons of consumption wages, the log wage figures were converted to purchasing
power parity (PPP) units, using the scaling factors supplied with the ECHP. The first
column shows substantial variation in mean wages across countries, from a high of 2.77
log points in the Netherlands down to 2.15 log points in Spain (with 2.18 log points in
Britain). But there are also differences in the dispersion of wages, as shown by the standard
deviations in the second column. By this measure, the country with the lowest dispersion
has the lowest mean and one of the highest standard deviations (0.50). The remaining
columns show the median, the 10th and 90th percentiles, and in the last column the
difference between the 90th and the 10th percentiles. This measure of dispersion shows a
similar pattern to the standard deviation: Spain, Britain, Ireland and France stand out as
countries with high hourly wage dispersion.
[Insert Table 2 near here]
2.4. Other Explanatory Variables
The education, industry and occupation variables in the ECHP are all coded according to
standard, internationally comparable definitions. Education levels are defined according to
UNESCO’s International Standard Classification of Education (ISCED). ISCED was
intended for education policy analysis and was designed to be invariant to differences in
national education systems. The ECHP distinguishes between education completed to the
lower secondary stage (ISCED 0-2), upper secondary education (ISCED 3) and
post-secondary or tertiary education (ISCED 5-7). ISCED 0-2 forms the base or omitted dummy
variable in our regression results reported in Section 4.
The data on industrial sector are categorised according to the European Union’s
Classification of Economic Activities in the European Community (NACE), while
occupation is defined using the International Standard Classification of Occupation
(ISCO-88).
The other controls are demographic attributes and job characteristics expected to
affect earnings. We include dummy variables for age and job tenure bands, any
unemployment experienced since 1989, marital status, health problems affecting daily life,
highest educational levels, fixed term or casual employment, part-time work, establishment
size, one-digit occupation and industry, year and, where the data allow, region. We also
survey date. Where there were non-trivial numbers of missing observations for variables
like industry and region, we include these cases in the regression but control for the
missing values using dummy variables (see Data Appendix for details).
3. THE ECONOMETRIC MODEL
There is an extensive literature that estimates the impact of training on expected log wages
using a linear regression framework (see inter alia references in Ashenfelter and Lalonde,
1996; and Arulampalam and Booth, 2001). Here, we deviate from this common practice by
looking at the associations of training and other covariates with wages at different
quantiles of the wage distribution. The linear conditional quantile regression model was
first introduced by Koenker and Bassett (1978); for a recent survey of these models, see
Buchinsky (1998), and Koenker (2005). The main advantage of a quantile regression (QR)
framework is that it enables one to model the effects of the covariates on the location, scale
and shape of the conditional wage distribution, unlike the linear regression model (least
squares) that only allows one to look at the effect on the location (the conditional mean).
Our dependent variable in all equations is the log wage, which for brevity we sometimes
refer to as the wage.
We consider two different specifications, which might be viewed as polar. They are
discussed below. The first assumes a non-decaying effect of training receipts and the
second assumes rapidly decaying training effects. Unfortunately, due to data limitations,
we are unable to allow for more flexible decaying effects of training, such as those
analysed by Arulampalam et al. (1997) using the National Child Development Survey.
Specification 1:
Here we assume that effects of training receipts do not decay over time. To capture this,
we include a cumulative count of completed events since the first wave. Therefore the
receipt of training between two waves. Unfortunately, we do not have information on the
complete history of training received by individuals in the sample. In panel data models
estimating the effect of training on the conditional mean wage, it is customary either to
first difference the equation prior to estimation or to use within-group deviations to
account for individual specific unobservables, which also allows one to control for training
effects prior to the start of the spell. In order to account for initial unobservables in our QR
model, we therefore, include the residual (ei1) from a reduced form OLS regression
(excluding the training variable) of the log wage estimated at wave 1 (just prior to our
observation period). The purpose of this wage residual is to control for the role of
unobservable skills (such as previous training) acquired before the sample period. Since
the effect of previous skills may vary over the conditional wage distribution, we allow the
coefficient to differ across quantiles. We do not work with the first differenced equation
here since our interest is in charting the effects of training on different parts of the
conditional wage distribution, and not the effects on annual wages growth. Moreover, the
first differenced equation is hard to interpret in the QR case because the difference of the
wage quantile is not the same as the quantile of the differenced wage. Hence, with our QR
model in levels, we interpret our results as the effects of training on the distribution of
wages, conditional on initial unobservables.
Specification 2:
In contrast to the first specification, the second specification assumes that the effect of
the training received in the last 12 months and therefore no control for initial condition is
included in this specification.6
Note that, if the underlying model were truly a location model - in the sense that the
changes in explanatory variables causing only a change in the location of the distribution
of w and not in the shape of the distribution - then all the slope coefficients would be the
same for all quantiles. Note that quantile regression models are more general than simple
linear regression model allowing for heteroskedastic errors, since the QR model allows for
more general dependence of the distribution of the dependent variable on the regressors
instead of just the mean and the variance alone. We use Stata 9 to estimate the coefficients
of our QR model. To account for the use of repeated observations on individuals, the
standard errors are calculated using a block-resampling method involving 500 replications
(Fitzenberger, 1998; Fitzenberger and Kurz, 2003). As a benchmark for our QR results, we
also present OLS estimates of the wage equation in Section 4.1 below before discussing
the QR estimates in Section 4.2 for Specification 1. We discuss Specification 2 results in
Section 4.3.
4. RESULTS
4.1. OLS Estimates of Specification 1
The first column of Table 3 reports the OLS estimates of accumulated work-related
training events and the two highest educational qualification dummy variables, with the
base for education being lower secondary education (ISCED 0-2). Other controls included
in the estimation are listed in the notes under the table. As explained above, we define a
6
Specification 1 includes ei1 to pick up any unobserved training that occurred in and prior to wave 1 and it
also includes accumulated training to pick up the history of training subsequently. But ei1 is not included
training event as a wave in which training was received, and these are summed across
waves for each observation.
[Insert Table 3 near here]
Table 3 reveals an interesting pattern of partial correlations between training and
wages. The highest estimated association between wages and each training event is 8.5%
in Ireland. Thus each additional experience is associated with nearly 9% higher wages in
Ireland, while for some countries the training coefficients are not statistically different
from zero (Belgium, Italy and the Netherlands). Significant associations of about 3-5%
higher wages per event are found for Austria, Finland, France, and Spain. A small
statistically significant association of 0.9% per training event was found in Denmark. Note
that two countries with the highest training incidence – Britain and Denmark– are also
amongst the countries with lower training-wage associations, of approximately one percent
per event for Denmark and just over one percent per event for Britain. It is interesting to
compare our estimates with those of Bassanini et al (2005), who pooled all countries in the
ECHP dataset and who included as controls country dummies, gender, age, age-squared,
year, education, marital status and industrial dummies. In our specifications we included
more explanatory variables (in particular more job characteristics) and allowed the impact
of these to vary across countries. This has resulted in a much smaller estimated training
effect than in Bassanini et al (2005). Of course our sample is also different, since we focus
only on private sector men and so our estimates are not strictly speaking comparable.7
In summary, our OLS estimates reveal that there are quite considerable differences
in ceteris paribus associations between wages and training across our sample of EU
7
countries. These OLS results highlight the potential importance of cross-country
heterogeneity in employer-provided and vocational training systems, discussed in Lynch
(1994) and Booth and Snower (1996), inter alia. There is in fact very little comparative
work investigating the extent and economic impact of work-related training, in part
because harmonised data facilitating comparisons became available only recently (OECD,
1999). We next turn to investigating whether there are intra-country differences in such
associations across the conditional wage distributions, and whether or not these
intra-country differences vary across countries.
4.2. QR Estimates of Work-related Training using Specification 1
Table 3 shows the quantile regression estimates of the training effects (the partial
derivative of the conditional quantile or mean log wage with respect to training), as
measured by the coefficient on the training receipt dummy, for five different conditional
quantiles (0.1, 0.25, 0.5, 0.75 and 0.90). We also control for residuals from a wave 1
log-wage regression, as described in Section 3. The coefficients on the residuals (not reported)
are highly significant in all equations. Note that we do not necessarily expect these
coefficients to equal one, as would be the case if they represented fixed effects shifting
only the location of the conditional distribution. Instead, the residuals are estimates of
previous skills and we allow their impact to vary across the wage distribution. Typical
coefficient estimates range from 0.4 to 0.7, suggesting that unobserved skills acquired
before the observation period have a persistent effect on wages and that it varies across the
distribution.
Figure 1 also presents the estimated effects for each of the quantiles of the log wage
distribution, along with the 95% confidence band around the estimates. Superimposed on
the plots is a dotted horizontal line representing the OLS estimates of the effect of training
the same across the conditional wage distribution, the implication is that training only
affects the location of this conditional wage distribution.
[Insert Figure 1 near here]
Inspection of Figure 1 reveals first, that the QR estimates are fairly uniform across
the conditional wages distributions in seven countries and there are noticeable slopes in the
other three countries: Belgium (downward sloping), and Britain and Denmark (upward
sloping). For example, in Britain the QR estimates range from 1.1% at the 10th percentile
to 2.2% at the 90th percentile (see also Table 3), while the OLS estimate of the
training-wages association is 1.4%, as already reported. Differences in the training coefficients
across quantiles suggest that training may be associated with expanded or compressed
conditional wage distributions. The larger coefficients at higher quantiles in Britain and
Denmark indicate that training is associated with increased dispersion of the conditional
wage distribution, ceteris paribus. The reverse result is found for Belgium, where the
estimates are smaller at the higher quantiles. Effectively this suggests that training is
associated with a reduced dispersion of the conditional wage distribution in these
countries, ceteris paribus.
However, a second feature of Figure 1 is that the confidence bands are quite wide,
and the OLS estimates lie within the QR confidence bands for all of our countries. This is
evidence against significant differences in the estimates across the wages distribution (note
that this does not mean that the association between training and wages is best quantified
by OLS, since with OLS the effects of all covariates are assumed to have only location
shifts). Furthermore, inspection of Table 3 reveals that, for two countries, there are no
statistically significant associations between training and wages across the entire wages
distribution. This is the case for Italy and the Netherlands (whose OLS coefficients are also
In summary, we find that the training effect is fairly uniform across the conditional
wage distribution within a country. Moreover, this finding is repeated for the vast majority
of the EU countries we investigated. This is an interesting result, and one that is counter to
the results found in other studies for another important form of human capital, education.
However, our results do suggest that there are considerable differences in mean returns to
training across countries.
So far we have focussed on the training associations, but it is also interesting to
examine the coefficients associated with the controls for upper secondary and tertiary
education. These are also presented in Table 3. The estimates reveal that only for Denmark
is the association between upper secondary education and wages increasing across the
wages distribution. By contrast, relative to the base of lower secondary education, the
association between tertiary education and wages is clearly increasing across the log wage
distribution in Austria, Belgium, Denmark, France, the Netherlands and Spain. In two
other countries – Ireland and Italy – the association between tertiary education and wages
is essentially flat over the distribution, while it actually declines in Britain and Finland.8
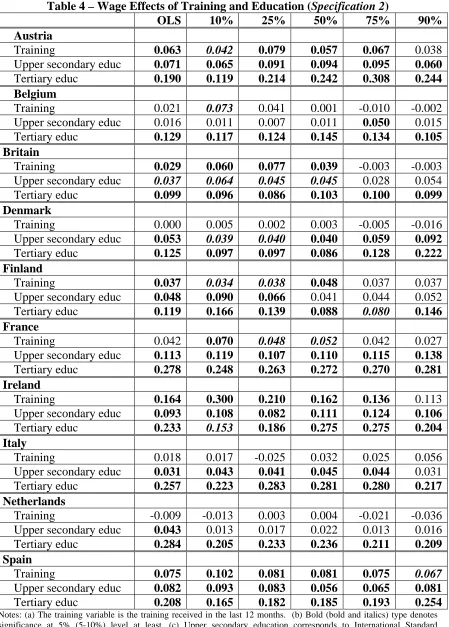
4.3. Robustness Check: QR Estimates using Specification 2
Table 4 shows the quantile regression estimates of the training effects based on estimating
Specification 2, in which training from an individual’s past is assumed to be discounted to
zero. Thus in Specification 2 the training variable is now training received in the last 12
8
months and no control is included for initial conditions. This is the approach commonly
used in the literature, when only the training received since the last wave is allowed to
have an effect on current wages.
It is instructive to compare the OLS estimates from each Specification, presented in
the first column of Tables 3 and 4. The highest estimated association between wages and
each training event is now 16.4% in Ireland, as compared with just 8.5% before. In general,
with the exception of Denmark, Finland, France and the Netherlands, the estimated
training effect from an additional course is typically twice as large in Specification 2 as it
is in Specification 1. Given the fact that individuals who are trained in one wave are also
likely to have a higher training probability in earlier waves, this is arguably
over-estimating the true training effect and might be considered as an upper bound.
[Insert Table 4 near here]
Now consider the QR estimates of Specification 2, presented in Tables 4 and
illustrated in Figure 2. Since the OLS results suggest that the training associations are
overestimated when previous training (both observed and unobserved) is omitted, we
might expect that this omitted heterogeneity would also affect the pattern of associations
across the conditional wage distribution. This could be the case if previously acquired
skills were remunerated differently across the conditional wage distribution, perhaps
because of differences in their quality or general-specific mix. It could also occur if the
correlation of past and current training varies over the wage distribution. By contrast, if
previously acquired skills have no differential effect over the distribution, then we would
expect the pattern of training associations to remain broadly similar to Specification 1.
[Insert Figure 2 near here]
Comparing Figures 1 and 2, we see that the pattern of training effects is generally
association of training and wages now declines across the conditional distribution,
compared to an increase (Britain) and a flat pattern (Ireland) in Specification 1. This
suggests that in these two countries previously acquired skills have a bigger impact at the
bottom compared to the top of the distribution. Once we hold constant this previous
‘history’ (Specification 1), the differential effect across the distribution disappears (and in
fact reverses slightly in Britain). In the eight other countries, our estimates across quantiles
are not sensitive to omission of previously acquired skills.
As was found for the OLS comparison, the QR estimates are also typically larger
here than were found for Specification 1. In summary, our results support the conclusions
reached from Specification 1 even though the magnitude has altered. In general the training
effect is fairly uniform across the conditional wage distribution within a country, with
Ireland and Britain as exceptions. Our results are suggestive of some cross-country
heterogeneity in the correlation between training and wages, indicating the need for
individual country studies to explore both median and other QR approaches.
5. CONCLUSIONS
In this paper we used quantile regression techniques to investigate the degree to which
work-related training affects the location, scale and shape of the conditional wage
distribution. Using the first six waves of the European Community Household Panel, we
investigated these issues for private sector men in ten European Union countries. Our
results for training suggest that, for the majority of countries, associations between training
and wages are similar across the conditional wage distribution.
We also controlled for highest educational qualification, using harmonised
measures. Overall, our results provide support to previous findings that education is
associated withincreased dispersion of the conditional wage distribution, although we find
education. Budria and Pereira (2005), using a variety of non-harmonised European data
sources, find a similar result, as also do Angrist, Chernozhukov and Fernandez-Val (2006),
using three US census datasets.
In contrast to these findings for education, while we found positive associations
between training and wages, we did not typically observe an upward sloping profile across
quantiles of the conditional wage distribution. This suggests that there may be different
forces at work in the relationship between training and wages. For example, there could be
unobserved heterogeneity with regard to training content or training costs. For example
Almeida and Carneiro (2006) find, using data for Portugal, that direct costs represent the
bulk of training costs and that foregone productivity accounts for less than 25% of the total
costs of training. They suggest that the estimated coefficient to training in a wage equation
is therefore unlikely to be an estimate of the true return to training. Such direct training
costs are unobservable in the ECHP survey data. However, since such explanations can
only be speculative in this context, we do not pursue them further here.
Finally, our OLS results were also of interest in their own right. We found
considerable cross-country differences in mean associations between training and wages.
Using Specification1, which we suggest is a lower bound, the highest was found for
Ireland, with around 9% higher wages per event. The smallest associations were found in
Belgium, Italy and the Netherlands, where the associations were statistically insignificant.
Significant associations of about 3-5% higher wages per event were found for Austria,
Finland, France, and Spain. Note that two of the countries with the highest training
incidence – Britain and Denmark – are also amongst the countries with the lowest wage
References
Abadie A, Angrist J, Imbens G (2002) Instrumental variables estimates of the effect of
subsidized training on the quantiles of trainee earnings. Econometrica 70(1):91-117.
Acemoglu D, Pischke J-S (1999) The Structure of Wages and Investment in General
Training. Journal of Political Economy 107(3):539-572
Almeida R, Carneiro P (2006) The Return to the Firm Investment in Human Capital. IZA
Discussion Paper No. 1937.
Angrist J, Chernozhukov V, Fernandez-Val I (2006) Quantile Regression under
Misspecification, with an Application to the US Wage Structure. Econometrica
74(2):539-563.
Arias O, Hallock K, Sosa-Escudero W (2001) Individual heterogeneity in the returns to
schooling: instrumental variables quantile regression using twins data. In:
Fitzenberger B, Koenker R, and Machado JAF (eds.) Economic Applications of
Quantile Regression. Physica-Verlag, Heidelberg New York 7-40
Arulampalam W, Booth AL (2001) Learning and earning: do multiple training events pay?
A decade of evidence from a cohort of young British men. Economica
68(271):379-400.
Arulampalam W, Booth AL, Bryan ML (2004) Training in Europe. Journal of the
European Economic Association 2(2/3):346-360.
Arulampalam W, Booth AL, Bryan ML (2007) Is There a Glass Ceiling over Europe? An
Exploration of Asymmetries in the Gender Pay Gap across the Wages Distribution.
Industrial and Labor Relations Review 60(2):163-186.
Arulampalam W, Booth AL, Elias P (1997) Work-related training and earnings growth for
Ashenfelter O, Lalonde RJ (eds) (1996) The Economics of Training. Edward Elgar,
Cheltenham Northampton.
Bassanini A, Booth AL, Brunello G, De Paola M, and Leuven E (2007) ‘Workplace
Training in Europe’. Chapters 8-12 in Brunello G, Garibaldi P, Wasmer E. Education
and Training in Europe. Oxford University Press, Oxford.
Bassanini A, Brunello G (2008) Is Training More Frequent When Wage Compression is
Higher? Evidence from the European Community Household Panel. Labour
Economics 15(2):272-290
Blundell R, Dearden L, Meghir C (1999) The determinants and effects of work-related
training in Britain. IFS report R50, Institute for Fiscal Studies, London
Booth AL, Bryan ML (2007) Who Pays for General Training in Private Sector Britain?.
Research in Labour Economics 26:85-123
Booth AL, DJ Snower (eds) (1996) Acquiring Skills: Market Failures, their Symptoms, and
Policy Responses. Cambridge University Press, Cambridge.
Buchinsky M (1998) Recent advances in quantile regression models. Journal of Human
Resources. 33(1):88-126
Buchinsky M (2001) Quantile regression with sample selection: estimating women’s return
to education in the U.S. In: Fitzenberger B, Koenker R, Machado JAF (eds.)
Economic Applications of Quantile Regression. Physica-Verlag, Heidelberg New
York 87-113
Budria S, Pereira PT (2005) Educational Qualifications and Wage Inequality: Evidence for
Europe. IZA Discussion Paper No. 1763.
Card D (1999) The causal effect of education on earnings. In: Ashenfelter O, Card D
Fitzenberger B (1998) The moving blocks bootstrap and robust inference for linear least
squares and quantile regressions. Journal of Econometrics, 82(2):235-287.
Fitzenberger B, Koenker R, Machado JAF (eds.) Economic Applications of Quantile
Regression. Physica-Verlag, Heidelberg New York
Fitzenberger B, Kurz C (2003) New insights on earnings trends across skill groups and
industries in West Germany. Empirical Economics 28:479-514
Garcia J, Hernandez PJ, Lopez-Nicolas A (2001) How wide is the gap? An investigation of
gender wage differences using quantile regression. In: Fitzenberger B, Koenker R,
Machado JAF (eds.) Economic Applications of Quantile Regression. Physica-Verlag,
Heidelberg New York 149-167
Gonzales X, Miles D (2001) Wage inequality in a developing country: decrease in
minimum wage or increase in education returns. In: Fitzenberger B, Koenker R,
Machado JAF (eds.) Economic Applications of Quantile Regression. Physica-Verlag,
Heidelberg New York 135-148
Heckman J, Smith J, Clements N (1997) Making the most out of social experiments:
accounting for heterogeneity in programme impacts. Review of Economic Studies
64(4):487-535.
Heckman J, Smith J, Taber C (1998) Accounting for dropouts in evaluations of social
experiments. Review of Economics and Statistics 80(1):1-14
Koenker R (2005) Quantile Regression, Cambridge University Press, Cambridge
Koenker R, Bassett G (1978) Regression quantiles. Econometrica 46(1):33-50
Lechner M, Melly B (2007) Earnings Effects of Training Programs. CEPR Discussion
Paper No. 6400, Centre for Economic Policy Research, London
Lillard LA, Tan HW (1992) Private sector training: who gets it and what are its effects?
Lynch LM (ed) (1994) Training and the Private Sector: International Comparisons.
University of Chicago Press, Chicago
Martins PS, Pereira PT (2004) Does education reduce wage inequality? Quantile regression
evidence from 16 countries. Labour Economics 11(3):355-371
OECD (1999) Training of Adult Workers in OECD Countries: Measurement and Analysis.
In: OECD Employment Outlook 1999. OECD, Paris 134-175
OECD (2003) Upgrading workers’ skills and competencies. In: OECD Employment
Table 1: Training Participation across Europe for Private Sector Men in
Employment Aged 25-54 Years
Number of men observed
[1]
Mean number of observed waves
[2]
Annual training incidence
(completed)
[3]
Mean
accumulated training count
[4]
Austria 786 3.01 0.15 0.45
Belgium 492 3.10 0.10 0.31
Britain 986 3.41 0.39 1.33
Denmark 626 3.44 0.37 1.27
Finland 740 2.40 0.29 0.70
France 1448 3.41 0.11 0.38
Ireland 544 3.26 0.05 0.16
Italy 1092 3.44 0.03 0.10
Netherlands 908 3.93 0.05 0.20
Spain 1204 3.35 0.08 0.27
Table 2: Log hourly wage distributions in purchasing power parity (PPP) units
Mean [1]
St dev [2]
Median [3]
10th percentile
[4]
90th percentile
[5]
90-10 differential
[6]
Austria 2.348 0.385 2.311 1.947 2.807 0.859
Belgium 2.497 0.353 2.444 2.107 2.914 0.806
Britain 2.180 0.465 2.502 1.964 3.108 1.144
Denmark 2.743 0.302 2.715 2.397 3.180 0.783
Finland 2.342 0.397 2.298 1.918 2.848 0.931
France 2.340 0.450 2.277 1.862 2.925 1.063
Ireland 2.380 0.532 2.380 1.833 2.966 1.133
Italy 2.234 0.335 2.204 1.874 2.618 0.744
Netherlands 2.766 0.396 2.744 2.421 3.219 0.798
Spain 2.154 0.505 2.104 1.580 2.855 1.275
Table 3 – Wage Effects of Training and Education (Specification 1)
OLS 10% 25% 50% 75% 90%
Austria
Training 0.034 0.015 0.033 0.035 0.028 0.044
Upper secondary educ 0.074 0.059 0.089 0.090 0.093 0.060
Tertiary educ 0.172 0.130 0.178 0.177 0.211 0.233
Belgium
Training 0.010 0.019 0.022 0.014 -0.012 -0.012
Upper secondary educ 0.023 -0.009 0.023 0.008 0.023 0.071
Tertiary educ 0.147 0.124 0.135 0.135 0.125 0.171
Britain
Training 0.014 0.011 0.008 0.014 0.020 0.022
Upper secondary educ 0.037 0.058 0.067 0.064 0.046 0.031
Tertiary educ 0.117 0.129 0.138 0.137 0.118 0.112
Denmark
Training 0.009 0.005 0.007 0.011 0.0089 0.008
Upper secondary educ 0.072 0.045 0.070 0.069 0.106 0.105
Tertiary educ 0.129 0.094 0.113 0.123 0.154 0.196
Finland
Training 0.031 0.049 0.019 0.030 0.020 0.027
Upper secondary educ 0.058 0.095 0.077 0.027 0.003 0.049
Tertiary educ 0.137 0.159 0.131 0.098 0.081 0.146
France
Training 0.036 0.050 0.038 0.032 0.031 0.032
Upper secondary educ 0.110 0.110 0.113 0.107 0.104 0.130
Tertiary educ 0.276 0.252 0.253 0.247 0.284 0.300
Ireland
Training 0.085 0.109 0.088 0.101 0.070 0.068
Upper secondary educ 0.102 0.091 0.076 0.110 0.129 0.107
Tertiary educ 0.216 0.216 0.205 0.229 0.224 0.219
Italy
Training -0.011 -0.008 -0.005 -0.003 -0.006 0.006
Upper secondary educ 0.037 0.056 0.055 0.046 0.043 0.016
Tertiary educ 0.266 0.290 0.297 0.257 0.238 0.254
Netherlands
Training 0.002 0.000 -0.007 0.003 0.003 -0.001
Upper secondary educ 0.046 0.014 0.024 0.033 0.024 0.040
Tertiary educ 0.297 0.224 0.230 0.254 0.258 0.292
Spain
Training 0.026 0.020 0.039 0.039 0.028 0.029
Upper secondary educ 0.088 0.076 0.074 0.081 0.085 0.106
Tertiary educ 0.206 0.184 0.184 0.206 0.210 0.216
Notes: (a) The training variable is the cumulative count of completed events since the first wave. (b) Bold (bold and
Table 4 – Wage Effects of Training and Education (Specification 2)
OLS 10% 25% 50% 75% 90%
Austria
Training 0.063 0.042 0.079 0.057 0.067 0.038
Upper secondary educ 0.071 0.065 0.091 0.094 0.095 0.060
Tertiary educ 0.190 0.119 0.214 0.242 0.308 0.244
Belgium
Training 0.021 0.073 0.041 0.001 -0.010 -0.002
Upper secondary educ 0.016 0.011 0.007 0.011 0.050 0.015
Tertiary educ 0.129 0.117 0.124 0.145 0.134 0.105
Britain
Training 0.029 0.060 0.077 0.039 -0.003 -0.003
Upper secondary educ 0.037 0.064 0.045 0.045 0.028 0.054
Tertiary educ 0.099 0.096 0.086 0.103 0.100 0.099
Denmark
Training 0.000 0.005 0.002 0.003 -0.005 -0.016
Upper secondary educ 0.053 0.039 0.040 0.040 0.059 0.092
Tertiary educ 0.125 0.097 0.097 0.086 0.128 0.222
Finland
Training 0.037 0.034 0.038 0.048 0.037 0.037
Upper secondary educ 0.048 0.090 0.066 0.041 0.044 0.052
Tertiary educ 0.119 0.166 0.139 0.088 0.080 0.146
France
Training 0.042 0.070 0.048 0.052 0.042 0.027
Upper secondary educ 0.113 0.119 0.107 0.110 0.115 0.138
Tertiary educ 0.278 0.248 0.263 0.272 0.270 0.281
Ireland
Training 0.164 0.300 0.210 0.162 0.136 0.113
Upper secondary educ 0.093 0.108 0.082 0.111 0.124 0.106
Tertiary educ 0.233 0.153 0.186 0.275 0.275 0.204
Italy
Training 0.018 0.017 -0.025 0.032 0.025 0.056
Upper secondary educ 0.031 0.043 0.041 0.045 0.044 0.031
Tertiary educ 0.257 0.223 0.283 0.281 0.280 0.217
Netherlands
Training -0.009 -0.013 0.003 0.004 -0.021 -0.036
Upper secondary educ 0.043 0.013 0.017 0.022 0.013 0.016
Tertiary educ 0.284 0.205 0.233 0.236 0.211 0.209
Spain
Training 0.075 0.102 0.081 0.081 0.075 0.067
Upper secondary educ 0.082 0.093 0.083 0.056 0.065 0.081
Tertiary educ 0.208 0.165 0.182 0.185 0.193 0.254
Notes: (a) The training variable is the training received in the last 12 months. (b) Bold (bold and italics) type denotes
significance at 5% (5-10%) level at least. (c) Upper secondary education corresponds to International Standard
DATA APPENDIX: Selection of estimating samples
Unless otherwise stated, we applied the initial selection described in Section 2 of the text. We then dropped observations with missing or invalid data on the variables in the wage equations, that is principally: training, fixed term or casual contract, occupation, industry, region, establishment size, tenure, part-time status, education, health status and marital status. Where the number of missing values was non-trivial (typically where this would have necessitated a drop in sample size of 5% or more as a consequence), we also included a dummy variable for missing value observations in order to preserve the sample sizes. Finally, we kept only continuous sequences of observations from the first wave (ECHP wave 1) to ensure a complete record of training for each individual. The table details the number of observations remaining at each of these selection stages.
[1] Country
[2] Initial no. of obs after
first selection [3] No. of obs with valid data [4] Addition al selections used [5] Included missing value dummies [6] Included waves [7] No. of obs [ind] after selection of continuing spells [8] Other comments
Austria 3189 3029 3-6 2366 [786] .
Belgium 3406 2680 Size 2-6 1524 [492] .
Britain 5569 4246 Wave 6
deleted.
Industry, Fixed Term/Casual contract
2-5 3366 [986] Training not dated.
Denmark 3249 3126 Industry 2-6 2152 [626]
Finland 2386 2282 Industry,
Occupation
4-6 1775 [740]
France 7483 6589 Fixed Term/
Casual, Size, Occupation, Industry
2-6 4936 [1448] Training is not dated.
Ireland 2729 2643 Region 2-6 1774 [544]
Italy 6944 6173 2-6 3757 [1092]
Netherlands 7038 6719 Industry 2-6 3569 [908] No training
finish dates available.
Spain 6445 6296 Region 2-6 4032 [1204]
Figure 1: The association of training and wages across the wage distribution (Specification 1) -. 0 2 0 .0 2 .0 4 .0 6 .0 8 T rai ni ng
0 .1 .2 .3 .4 .5 .6 .7 .8 .9
Quantile
QR QR 95% confidence intervals OLS Austria -. 0 4 -.0 2 0 .0 2 .0 4 .0 6 T rai ni ng
0 .1 .2 .3 .4 .5 .6 .7 .8 .9
Quantile
QR QR 95% confidence intervals OLS Britain -. 0 2 -. 0 1 0 .0 1 .0 2 .0 3 T rai ni ng
0 .1 .2 .3 .4 .5 .6 .7 .8 .9
Quantile
QR QR 95% confidence intervals OLS Denmark -. 0 5 0 .0 5 .1 .1 5 T rai ni ng
0 .1 .2 .3 .4 .5 .6 .7 .8 .9
Quantile
QR QR 95% confidence intervals OLS Finland 0 .0 2 .0 4 .0 6 .0 8 .1 T rai ni ng
0 .1 .2 .3 .4 .5 .6 .7 .8 .9
Quantile
QR QR 95% confidence intervals OLS France -.1 -.05 0 .05 .1 Training
0 .1 .2 .3 .4 .5 .6 .7 .8 .9 Quantile
QR QR 95% confidence intervals OLS
Figure 1 Continued: The association of training and wages across the wage distribution (Specification 1) -. 1 0 .1 .2 T rai ni ng
0 .1 .2 .3 .4 .5 .6 .7 .8 .9
Quantile
QR QR 95% confidence intervals OLS Ireland -. 1 -. 0 5 0 .0 5 .1 T rai ni ng
0 .1 .2 .3 .4 .5 .6 .7 .8 .9
Quantile
QR QR 95% confidence intervals OLS Italy -. 1 -. 0 5 0 .0 5 T rai ni ng
0 .1 .2 .3 .4 .5 .6 .7 .8 .9
Quantile
QR QR 95% confidence intervals OLS Netherlands -. 1 -. 0 5 0 .0 5 .1 T rai ni ng
0 .1 .2 .3 .4 .5 .6 .7 .8 .9
Quantile
QR QR 95% confidence intervals OLS
Figure 2: The association of training and wages across the wage distribution (Specification 2) -. 0 5 0 .0 5 .1 .1 5 L a tes t T rai ni ng
0 .1 .2 .3 .4 .5 .6 .7 .8 .9
Quantile
QR QR 95% confidence intervals OLS Austria -. 1 -.0 5 0 .0 5 .1 .1 5 L a tes t T rai ni ng
0 .1 .2 .3 .4 .5 .6 .7 .8 .9
Quantile
QR QR 95% confidence intervals OLS Belgium -. 1 -.0 5 0 .0 5 .1 .1 5 T rai ni ng
0 .1 .2 .3 .4 .5 .6 .7 .8 .9
Quantile
QR QR 95% confidence intervals OLS Britain -. 0 6 -. 0 4 -.0 2 0 .0 2 .0 4 L a tes t T rai ni ng
0 .1 .2 .3 .4 .5 .6 .7 .8 .9
Quantile
QR QR 95% confidence intervals OLS Denmark -. 0 5 0 .0 5 .1 .1 5 T rai ni ng
0 .1 .2 .3 .4 .5 .6 .7 .8 .9
Quantile
QR QR 95% confidence intervals OLS Finland -. 2 -. 1 0 .1 .2 .3 L at es t T rai ni ng
0 .1 .2 .3 .4 .5 .6 .7 .8 .9
Quantile
QR QR 95% confidence intervals OLS
Figure 2 Continued: The association of training and wages across the wage distribution (Specification 2) 0 .1 .2 .3 .4 .5 T rai ni ng
0 .1 .2 .3 .4 .5 .6 .7 .8 .9
Quantile
QR QR 95% confidence intervals OLS Ireland -. 1 -. 0 5 0 .0 5 .1 .1 5 T rai ni ng
0 .1 .2 .3 .4 .5 .6 .7 .8 .9
Quantile
QR QR 95% confidence intervals OLS Italy -. 1 -. 0 5 0 .0 5 .1 T rai ni ng
0 .1 .2 .3 .4 .5 .6 .7 .8 .9
Quantile
QR QR 95% confidence intervals OLS Netherlands -. 0 5 0 .0 5 .1 .1 5 .2 L a tes t T rai ni ng
0 .1 .2 .3 .4 .5 .6 .7 .8 .9
Quantile
QR QR 95% confidence intervals OLS