Original citation:
Yu, Y. C., Bloodworth, Alan G. and Gleig, F. D. (2001) Behaviour of long structures in response to tunnelling. In: International Conference on the response of buildings to
excavation-induced ground movements, 17-18 Jul 2001. Published in: Proceedings of the International Conference on the response of buildings to excavation-induced ground movements
Permanent WRAP URL:
http://wrap.warwick.ac.uk/80787
Copyright and reuse:
The Warwick Research Archive Portal (WRAP) makes this work by researchers of the University of Warwick available open access under the following conditions. Copyright © and all moral rights to the version of the paper presented here belong to the individual author(s) and/or other copyright owners. To the extent reasonable and practicable the material made available in WRAP has been checked for eligibility before being made available.
Copies of full items can be used for personal research or study, educational, or not-for-profit purposes without prior permission or charge. Provided that the authors, title and full
bibliographic details are credited, a hyperlink and/or URL is given for the original metadata page and the content is not changed in any way.
A note on versions:
The version presented here may differ from the published version or, version of record, if you wish to cite this item you are advised to consult the publisher’s version. Please see the ‘permanent WRAP URL’ above for details on accessing the published version and note that access may require a subscription.
Behaviour of long structures in response to tunnelling
.Lu Y C
Brown & Root Services, Leatherhead, UK.
Bloodworth A G
Dept. of Civil & Environmental Engineering, University of Southampton, formerly Brown & Root
Services, Leatherhead, UK.
Gleig F D
Brown & Root Services, Leatherhead, UK.
Abstract
This paper presents observations of the response of long structures when exposed to tunnelling
activities in London Clay. The type of structures varied from a 100 years old masonry arch tunnel to a
more modern reinforced concrete frame structure. The common property shared by these structures
was that they were long in comparison to the depth beneath them of the tunnels being constructed.
Numerical analyses have also been carried out to back analyse the observed data using the London
Clay soil parameters. The model was then extended to include a depth and a structural stiffness
variable and demonstrate sensitivity to those factors.
Keywords
Tunnelling, structures, risk, prediction, settlement, trough, modification
Conference Theme
1 Introduction
The current increase in tunnelling activity in built-up areas results in an increase exposure of existing
services and structures to ground movements. To assess the associated risks requires either the
application of an over-simplified and conservative method or complex numerical analysis, which can
be time consuming. When only the risks to the structure are of interest, the important parameter is the
half-width of the settlement trough between the points of inflexion, i. That value is used, in
conjunction with the anticipated volume loss, to produce a deflected shape for which the structure can
be assessed. This paper provides a method of obtaining this parameter for long structures within a
range of stiffness (EI) values.
2 Euston Square Station
In November 1996, London Electricity plc (LE) constructed a 3m diameter tunnel under the existing
Metropolitan Line at Euston Square station (Lu et. al., 1999, Samuel et. al., 1999). This tunnel was
driven within London Clay to achieve a clearance of approximately 7m between the two structures
(see Figure 1 for plan of crossing).
The Metropolitan Line was built in 1863 (Baker, 1885), and the section under Euston Road was a
brick arch constructed using the cut and cover method. The foundations of the arch were just into
London Clay and the arch was covered with about 8m of Terrace Gravel and made ground.
A site investigation was conducted and brick cores were taken from the masonry to obtain both
strength and stiffness parameters. The unconfined compressive tests produced a range of strengths
between 6.9 and 22 N/mm2 and the average Young’s modulus was 8500 N/mm2.
During the LE tunnel construction, precise levelling was carried out to measure the displacements
along the walls and the crown. This surveying method was accurate to 1mm and the measured data at
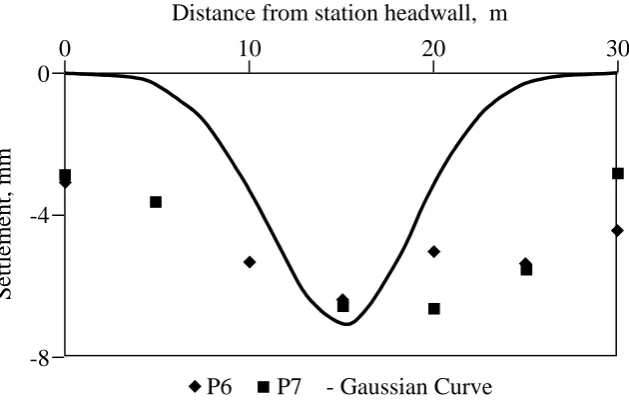
the axis and foundation (P6 and P7 respectively) is shown in Figure 2. The predicted greenfield
settlement curve, based on a value of i calculated as half the depth between the LE tunnel axis and the arch foundations, is also shown. The back analysis of the settlement data showed a ‘best fit’ Gaussian
curve with the point of inflexion, i, equal to 1.5 times the depth between the LE tunnel axis and the
arch foundation. The actual settlement curve was 3 times wider than the greenfield condition and the
Figure 1. Plan at Euston Square Station.
Distance from station headwall, m
S
et
tle
ment,
mm
0
-4
-8
P6
P7 - Gaussian Curve
20
10
30
0
Figure 2. Observed and predicted settlements at tunnel axis and foundation levels, Euston
[image:4.595.139.454.309.510.2]3 Longford Street Spur Tunnel
A spur tunnel was excavated from an electricity substation to intersect the main tunnel drive, described
in Section 2 above, at a point approximately 400m to the east of Euston Square. The spur tunnel was
77m long and 2.9m in diameter and was hand excavated in London clay on a decline at shallow depth,
ranging from 4m to 15m beneath an existing structure (Bloodworth and Macklin, 1999).
The structure comprised a single-storey reinforced concrete frame which was the former basement of a
substantial office development, demolished in 1996 to ground level (Figure 3). The basement extended
over a wide area either side of the tunnel axis. The frame consisted of columns at 7m centres in both
directions and a ground level slab. At basement level, a reinforced concrete slab was cast against the
columns but was not structurally connected to them. The vertical separation of ground and basement
level slabs was 4m. The columns were founded on pad footings 2m below basement slab level,
approximately at the top of the London Clay. Precise level monitoring of the columns above the tunnel
axis (points A – C), the basement slab over a wide area each side of the tunnel (points 1 –29) and for
subsurface settlements 4m below basement slab level at a point where the tunnel axis was 8m below
basement slab level (points 101 – 103) was carried out.
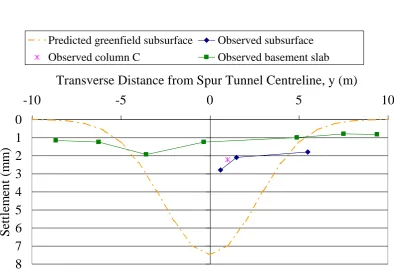
The settlement results at the chainage of the subsurface monitoring points are shown in Figure 4. The
back analysis of the settlement data showed a volume loss of 0.8%, which was consistent with the
depth of the tunnel below basement slab level and the stability number of the heading (Macklin, 1999).
The trough width parameter i at the level of the subsurface monitoring points was found to be
approximately twice the width predicted by methods based on subsurface settlement trough width in
2.59 I.D. CABLE TUNNEL X X X X X X X X X X X X X X
X X X X
X X X X X X X X X 1 2 3 4 5 6 7 8 9 10 11 12 13 14 15 16 17 18 19 20 21 22 23 24 25 26 27 29 X X X 28 A B C 101 102 103 Notes
(1) POINTS 1 TO 29 ARE HILTI NAILS IN BASEMENT SLAB
(2) POINTS A B & C ARE SOCKETS IN COLUMNS AT BASEMENT SLAB LEVEL
(3) 101 102 & 103 ARE SUBSURFACE LEVELLING POINTS 4m BELOW BASEMENT SLAB LEVEL EXIT TO REST
OF CAR PARK
ENTRY FROM REST OF CAR PARK
A
A
2.44m ID BOLTED LINING TO SPUR TUNNEL 101-103
BH Made ground
Stiff to Very Stiff Fissured London Clay Original Building Demolished to ground floor level
LONGFORD STREET JUNCTION CHAMBER
Weathered London clay
C B A
+25m +20m +25m Vertical Scale m AOD 10m 5m 0m Horizontal Scale 24.07 20.0 SECTION A-A PLAN
[image:6.595.120.479.68.435.2]Basement Slab level
Figure 3. Plan and Section of Longford Street Spur Tunnel.
0
1
2
3
4
5
6
7
8
-10
-5
0
5
10
Transverse Distance from Spur Tunnel Centreline, y (m)
S
et
tl
em
en
t (m
m
)
Predicted greenfield subsurface Observed subsurface
Observed column C Observed basement slab
[image:6.595.101.496.451.721.2]4 Analysis Considerations
The simplest method to assess the level of risk, due to tunnelling beneath a structure, was to assume a
flexible structure with the greenfield ground displacements superimposed. From this deflected shape,
the gradients along the structure were calculated and compared with published data of settlement
damage to buildings (eg. Boscardin and Cording, 1989). This method yielded conservative results.
Potts and Addenbrooke (1997), proposed an alternative method, modelling the building as an elastic
beam and defining relative bending and axial stiffnesses as = EI/EsH4 and *= EA/EsH
respectively, where Es was defined as the representative soil stiffness. When H, the half width of the
beam, became infinitely long, both stiffnesses would reduce to very small values. In their Figure 6, the
i/Z value then became 0.5 for all values of relative axial stiffness ratios and Z was defined as the depth
between the structure foundation to the axis of the tunnel.
Based on the two cases presented, the contribution from the structure appeared to become significant
when the clearance between the structure and the tunnel was reduced. This could be attributed to the
reduced trough width and the ability of the structure to ‘bridge’ across the trough. In a limiting
situation, when the stiff structure could span across a sufficiently narrow trough, very little structural
deflections would be anticipated which implied a large i/Z ratio. This assumed that the ground was
capable of carrying the increased pressure at the foundation.
A series of FLAC (Fast Lagrangian Analysis of Continua) models were developed to study the
behaviour of long structures subjected to underground construction, with reference to the Euston
Square Station case study (Lu et al., 1999). The structure was idealised as a long beam glued to the top
of the grid. A surcharge was also included to model the material above the arch tunnel. The soil was
modelled as a non-linear elastic, undrained London Clay of stiffness parameters stated in Jardine et.
al.(1986). An initial analysis was conducted which excluded the structure and good agreement
between the numerical and theoretical curves can be seen in the Figure 7 of Lu et. al., 1999.
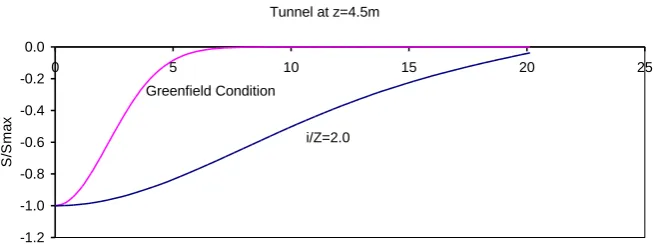
Three Z values were included in the analyses, namely 4.5m, 9.5m and 15m respectively. Figure 5 and
Figure 6 shows the deflected shape of the structure compared with the greenfield settlement trough of
Tunnel at z=4.5m
-1.2 -1.0 -0.8 -0.6 -0.4 -0.2 0.0
0 5 10 15 20 25
Horizontal Distance From Tunnel Axis, m
S
/S
m
a
x
Greenfield Condition
[image:8.595.135.462.75.199.2]i/Z=2.0
Figure 5. Deflected shape of structure for tunnel at Z=4.5m.
Tunnel at z=15m
-1.2 -1 -0.8 -0.6 -0.4 -0.2 0
0 5 10 15 20 25
Horizontal Distance From Tunnel Axis, m
S
/S
m
a
x
Greenfield Condition
[image:8.595.136.460.280.464.2]i/Z=0.75
Figure 6. Deflected shape of structure for tunnel at Z=15m.
These analyses demonstrated that a reduced clearance between the tunnel and the structure would
increase the trough width parameter, i/Z. The effect of the long structure would no longer be
significant when the 3m diameter tunnel was more than 20m beneath it.
5 Proposed Design Chart and Analysis Method
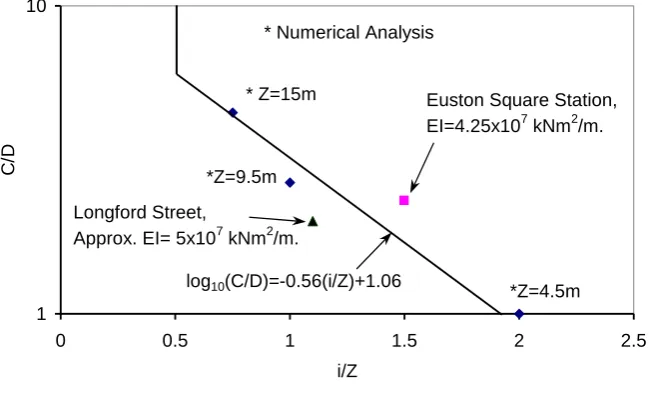
A sensitivity study has been conducted to investigate the influence of the structural stiffness, EI,
towards its deflected shape, where I was the gross section modulus. It was found that changing the EI
from brick masonry to reinforced concrete would not have increased the trough width. The range of EI
also include the two case studies, Euston Square station and Longford Street.
1 10
0 0.5 1 1.5 2 2.5
i/Z
C
/D
Euston Square Station, EI=4.25x10⁷ kNm2/m.
log10(C/D)=-0.56(i/Z)+1.06
Longford Street,
Approx. EI= 5x10⁷ kNm2/m.
* Numerical Analysis
* Z=15m
*Z=9.5m
[image:9.595.137.462.119.316.2]*Z=4.5m
Figure 7. Proposed design chart.
The equation derived from the plot was log10(C/D) = -0.56 (i/Z) + 1.06, where the i/Z ratio should not
be greater than 2 or less than 0.5. This range was perceived as the upper bound based on current work
and the lower bound from observed greenfield data in stiff clay. From the plot, the limiting C/D ratio,
for i/Z = 0.5, was 6.
The recommended procedure to assess the risk on a long structure due to tunnelling would be applying
the known C/D ratio to the above equation to obtain the i/Z value. This point of inflexion, i, is then
combined with the anticipated volume loss to produce a deflected shape of the structure, which is
compared with published structure performance charts or tables to obtain the risk levels.
6 Conclusion
Using greenfield condition to predict structure response due to tunnelling, without accounting for the
structural stiffness, will provide a conservative result. However, the relative depth of the tunnel
beneath the structure will also influence its deflected shape. The ability of a long structure to bridge
across a settlement trough will need to be taken into consideration in order to provide a realistic
ACKNOWLEDGEMENTS
The authors would like to thank the technical skill group leaders in Brown & Root Services, Mr G
Wilkinson and Mr I Brough, for their support in the preparation of this paper.
REFERENCES
Baker, B. 1885. The Metropolitan and Metropolitan District Railways. Proceedings of the Institution
of Civil Engineers. Vol. LXXXI, 1-33.
Bloodworth, A.G. and Macklin, S.R. (1999). Ground and structure response to a hand driven decline
in London clay. Proc. International Symposium on Geotechnical Aspects of Underground
Construction in Soft Ground, Tokyo, 75-80.
Boscardin, M D and Cording E J. (1989). Building Response to Excavation Induced Settlement.
Journal of Geotechnical Engineering, ASCE, Vol. 115, No.1.
Jardine R J, Potts D M, Fourie A B and Burland J B (1986). Studies of the influence of non-linear
stress-strain characteristics in soil-structure interaction. Geotechnique 36, No.3, 377-396.
Lu Y C, Samuel H R and Chudleigh I (1999). Response of a masonry arch tunnel to underground
tunnelling. Proceedings of the 5th International Symposium on Field Measurements in Geomechanics,
Singapore,.
Macklin, S.R. (1999). The prediction of volume loss due to tunnelling in overconsolidated clay based
on heading geometry and stability number. Ground Engineering, Vol. 32, No. 4.
Mair, R.J., Taylor, R.N. and Bracegirdle, A. (1993). Subsurface settlement profiles above tunnels in
clays. Geotechnique, Vol. 43, No. 2, 315-320.
Potts D M and Addenbrooke T I (1997). A structure’s influence on tunnelling-induced ground
boring a new tunnel under an existing masonry tunnel. Proc. International Symposium on