ISSN Print: 2164-3164
DOI: 10.4236/ojce.2019.93016 Sep. 16, 2019 230 Open Journal of Civil Engineering
An
Assessment
of
the
Seismic
Performance
of
the
Historic
Tigris
Bridge
Atila
Kumbasaroglu,
Alper
Celik
*,
Osman
Demir,
Ahmet
Ihsan
Turan,
Hakan
Yalciner
Civil Engineering Department, Erzincan University, Erzincan, Turkey
Abstract
Turkey is a country that is vulnerable to earthquakes and has experienced many major earthquakes that completely destroyed or caused significant damage to numerous historic structures. Today, using computer software, it is important to numerically model and analyze historic structures that need significant restoration and strengthening, to evaluate them from a perspective of seismic resistance, and to reinforce them without altering their originality. In this study, a finite element model of the historic Tigris Bridge on the Tigris River was created. First, the stresses and deformation caused by its own weight were determined. Subsequently, dynamic analyses were performed in the time domain using past earthquake ground motion records. Displacement and stress values obtained for each earthquake record in these time domain analysis were compared to each other to evaluate the seismic behavior of the bridge comparatively. The seismic performance of the bridge was determined on the basis of the “Guidelines on the Management of Earthquake Risks for Historic Structures” published by the Directorate General of Religious Foun-dations in Turkey.
Keywords
Seismic Performance of Historic Buildings, Historic Bridge, Time Domain Analysis
1.
General
Features
of
the
Structure
1.1.
Location
and
History
of
the
Bridge
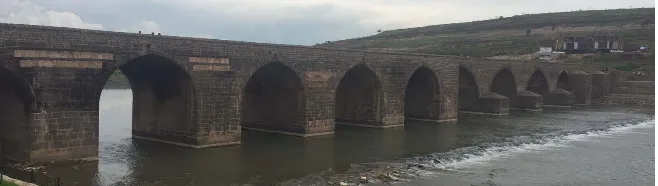
The historic Tigris Bridge in Diyarbakır is an important and prominent struc-ture in terms of its size and architecstruc-ture and has become a symbol of the said city. The bridge is 3 km from the city center and is located at a point that links the center of the city to the Township of Bağıvar and several villages. Several How to cite this paper: Kumbasaroglu, A.,
Celik, A., Demir, O., Turan, A.I. and Yal-ciner, H. (2019) An Assessment of the Seismic Performance of the Historic Tigris Bridge. Open Journal of Civil Engineering, 9, 230-239.
https://doi.org/10.4236/ojce.2019.93016
Received: May 1, 2019 Accepted: September 13, 2019 Published: September 16, 2019
Copyright © 2019 by author(s) and Scientific Research Publishing Inc. This work is licensed under the Creative Commons Attribution International License (CC BY 4.0).
DOI: 10.4236/ojce.2019.93016 231 Open Journal of Civil Engineering
started repairing a collapsed bridge in 742 - 743 and that the construction work stopped after his death. It is also known that the eastern armies of the Roman Empire besieged Diyarbakir unsuccessfully in 974 and that they destroyed this bridge when they withdrew [2].
The bridge is believed to have been destroyed and rebuilt partially or com-pletely several times. The most recent and most accurate known construction date of the bridge is based on the inscription marked on the bridge. According to this inscription, the bridge was built in 457 A.H. (1065 AD).
1.2. Architectural Review of the Bridge
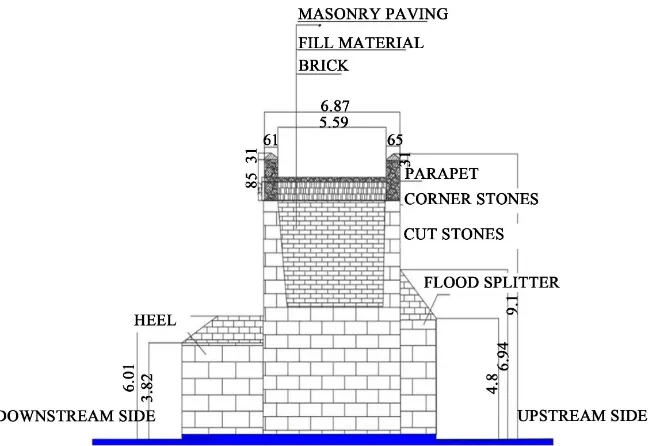
The Tigris Bridge is considered to fall in the category of multi-span flat-top bridges. The bridge is 172 m long. Its width varies between 5.45 and 6.24 m over the first five spans and increases to the range 9.69 - 10.20 m from the fifth span on. The road over the bridge is currently covered with the original paving stones following restoration. The parapet height is 85 cm at the end and rises to as much as 155 cm near the middle (Figure 1).
[image:2.595.213.541.474.697.2]The capstones are nine capped pyramidal flood splitters [fender piles] stand on the north (upstream) side of the bridge. Flood splitters 1, 2, 3, and 4 (S1, S2, S3, S4) are lower in height than the others. Also, the spandrel walls of the spans 6, 7, 8, 9, and 10 retain their original construction features up to half their heights. However, different masonry work has been applied to the spandrel walls of the spans 1, 2, 3, 4, and 5 as shown in Figure 2 and Figure 3.
DOI: 10.4236/ojce.2019.93016 232 Open Journal of Civil Engineering Figure 2. Capped pyramidal flood splitters on the upstream face.
Figure 3. Upstream facade—elevation drawing [3].
Unlike the north side, the southern (downstream) side of the bridge does not feature a flat facade wall. The arches of the spans 1, 2, 3, 4, and 5 are recessed by around 4 m. Following a study of traces left on the current bridge, it was deter-mined that this section collapsed after [it was initially built] and that it was built with recesses during repairs (Figure 4).
The bridge features 29 different masons’ marks in the form of different sym-bols. In addition to these, two different arrays of markings are inscribed as blocks. One of these is an array where the Latin characters K, O, and E are listed one below the other. The other consists of blocks of points arrayed vertically, horizontally, and diagonally. The masons’ marks may be interpreted as signify-ing the purpose of the construction, the calculation of the stones mined from quarries, differentiation of different types of marbles, identification of marble traders, and identification of the artisans who hewed the stones [4].
1.3. Determination of the Material Properties of the Bridge
DOI: 10.4236/ojce.2019.93016 233 Open Journal of Civil Engineering Figure 4. View of the downstream facade of the historic Tigris Bridge.
Table 1. Material properties used in the analysis [5].
Material Elastic Modulus (MPa) Poisson’s Ratio Density (kN/m3)
Stone 3500 0.2 16
Brick 3000 0.3 12
Corner Stones 2500 0.2 14
Fill material 500 0.05 12
2.
Modeling
and
Analysis
of
the
Structure
The historic bridge was modeled using “Finite Element Analysis”, which facili-tates the definition of cross-sectional and material properties of structural ele-ments with different geometries, on the computer program SAP2000 (Version 15). Static analysis was used to determine the behavior of the structure due to its own weight; modal analysis was used to determine the mode shapes and natural periods of the structure; and linear analysis in the time domain was used to de-termine the behavior of the structure under dynamic loads using acceleration data for the March 13, 1992 Erzincan Earthquake.
2.1. Creation of the Three-Dimensional Finite Element Model of
the
Bridge
In finite element modeling, the geometry of the structure or structural elements is determined by a finite number of nodes. To determine the behavior of the structure accurately, a large number of nodes were used in creating a finite ele-ment model of the Tigris Bridge. Specifically, 12,937 solid eleele-ments and 17,541 nodes were used in the finite element model created. For this study, the degrees of freedom at the base of the bridge were assumed to be fixed. The finite element model created for the Tigris Bridge is shown in Figure 5.
2.2.
Gravity
Load
Analysis
DOI: 10.4236/ojce.2019.93016 234 Open Journal of Civil Engineering Figure 5. Finite element model of the Tigris bridge.
weights of the materials in this study. Live loads and snow loads were not in-cluded in the calculations. The static analysis results showed that the largest dis-placements occurred in the vertical axis 3 (z-axis) direction in the arch footings and masonry infill walls, particularly in the arches and footings associated with the wider and taller spans 3, 4, and 5. The largest displacement was found to be 0.852 mm.
The distribution of maximum compressive stresses obtained from the static analysis shows that the largest stresses occur at the points where stone arches meet the footings of the bridge and at the bottoms of the footings. The largest stress was found to be 0.618 MPa (Figure 6).
2.3. Dynamic Analysis
In the finite element model created by macro modeling technique, dynamic analyzes were performed. In the model, the damping ratio is constant 5%. Within the scope of dynamic analysis, modal analysis and time history analysis were performed.
2.3.1.ModalAnalysis
In the modal analysis, the first five modes of the Tigris Bridge were considered to calculate mode shapes and natural frequencies, which constitute the dynamic characteristics of the bridge. Table 2 lists the natural period values and mass participation factors. When we look at the mode shapes corresponding to the listed natural frequency values, we find that the first and second modes are y-direction lateral modes, the third and fourth modes are x-direction lateral modes, and the fifth mode is a z-direction vertical mode (Table 2).
2.3.2.TimeDomainAnalysis
A time domain finite element dynamic analysis was performed on the model that was created using a macro-modeling technique. Acceleration data for the east-west component of the March 13, 1992 Erzincan Earthquake were applied to the model to simulate the behavior of this structure under dynamic loads. The largest acceleration [in the earthquake record] was −470.915 cm/s2 at 3.395 seconds (Figure 7).
DOI: 10.4236/ojce.2019.93016 235 Open Journal of Civil Engineering Figure 6. Gravity load analysis—maximum compressive stresses (Mpa).
[image:6.595.209.539.359.444.2]Figure 7. East-west component of the Erzincan Earthquake.
Table 2. Natural periods and natural frequencies response to each mode number. Mode number Natural frequency (Hz) Natural period (s)
1 8.740 0.114
2 9.229 0.108
3 10.165 0.098
4 10.378 0.096
5 11.560 0.086
of the structure, Erzincan Earthquake record was used considering the similarity of local ground conditions. The distributions of stresses and maximum shear stresses that were obtained in the linear dynamic analysis in the time domain using acceleration records of the east-west component of the March 13, 1992 Er-zincan Earthquake are shown in Figure 8 and Figure 9.
The dynamic analysis for the Erzincan earthquake calculated the maximum shear stress in the x-x direction as 0.507 MPa, the maximum shear stress in the y-y direction as 0.180 MPa and the maximum shear stress in the z-z direction as 0.893 MPa.
Maximum stresses in the X direction were observed in the arches of the bridge and the paved area above the arches; maximum stresses in the Y direction were observed at the footings of the arches, the edges of the base of the bridge, and the inner portions of the arches; maximum stresses in the Z direction were observed at the edges of the bases of the footings where the arches meet.
3.
Determination
of
the
Performance
of
the
Structure
DOI: 10.4236/ojce.2019.93016 236 Open Journal of Civil Engineering Figure 8. X-dir shear stress values for the Erzincan Earthquake (MPa).
Figure 9. Y-dir shear stress values for the Erzincan Earthquake (MPa).
limit conditions specified in the “Turkish Guidelines on the Management of Earthquake Risks for Historic Structures (Table 3)”.
3.1.
Compressive
Strength
Safety
of
the
Masonry
Wall
System
The masonry walls in the structure are made up of mostly pitch-faced and cut stones. The material mechanical properties table provided in the Structural Modeling and Assessment section of the “Turkish Guidelines on the Manage-ment of Earthquake Risks for Historic Structures” was used to determine the compressive strength of cut stone. The table recommends a compressive strength of 1.1 to 1.6 MPa (Table 4).
The maximum compressive stress that develops in the structure is 0.618 MPa, which does not exceed the compressive strength specified for masonry walls.
3.2. Shear Strength Safety of the Masonry Wall System
According to Section 11 of the Turkish Building Earthquake Regulation, the characteristic wall shear strength, fvk , must be calculated from tests conducted on wall samples or the following equation.
0.4 0.10
vk vko d b
f = f + σ ≤ f
where, fvk is the characteristic wall shear strength using vertical stresses on the wall, fvko is the characteristic shear strength when no axial stresses are present, σd is the vertical compressive stress calculated under the combined effect of vertical loads multiplied by load coefficients and earthquake loads and fb is the standar-dized average compressive strength of masonry element (equivalent to non-dim- ensionalized 100 × 100 mm sample).
The characteristic shear strength (fvk) when axial stresses are not present must
be determined based on Turkish Building Earthquake Regulation (Table 5).
DOI: 10.4236/ojce.2019.93016 237 Open Journal of Civil Engineering Table 3. Performance level [6].
Performance level Calculation method and limits
Limited damage limit condition (LD)
1) Linear calculation method used;
a) Calculated strengths subjected to vertical loads and undamped projected earthquakes not exceeded.
b) The sidesway ratio under undamped earthquake loading does not exceed the 0.3% limit.
Controlled damage limit condition (CD)
1) Linear calculation method used;
a) Calculated strengths subjected to vertical loads and projected earthquakes damped by Ra ≤ 3 not exceeded.
b) The sidesway ratio under undamped earthquake loading does not exceed the 0.7% limit.
2) Nonlinear calculation method used;
a) The sidesway ratio does not exceed the 0.7% limit. b) The deformation capacities of the materials not exceeded.
Pre-collapse limit condition
(PC)
1) Linear calculation method used;
a) Calculated strengths subjected to vertical loads and projected
earthquakes damped by Ra ≤ 3 may be exceed to some extent (~1.5 times). b) The sidesway ratio under undamped earthquake loading does not exceed the 1% limit.
2) Nonlinear calculation method used;
a) The sidesway ratio does not exceed the 1% limit.
[image:8.595.213.540.454.580.2]b) The deformation capacities of the materials may be exceeded by a limited amount (~1.2 times).
Table 4. Compressive strengths of masonry wall materials [6].
Wall Type Compressive Strength f m (MPa) Masonry wall built with rubble stone 0.6 - 0.90 Masonry wall built with pitch-faced stone 1.1 - 1.6 Masonry wall built with well-jointed cut stone 1.5 - 2.0 Masonry wall built with soft stone (limestone, tufa) 0.8 - 1.2 Masonry wall built with plastered smooth-cut stone 3.0 - 4.0 Masonry wall built with brick and lime mortar 1.8 - 2.8 Masonry wall built with semi-hollow brick and cement mortar 3.8 - 5.0 Masonry wall built with bricks with void ratio of less than 45% 4.6 - 6.0
Table 5. Initial shear strengths of walls, fvko (MPa) [7].
Masonry element General purpose mortar (*) Thin layer mortar
Brick M2.5 - M9 0.30 0.20
M1 - M2 0.10
Concrete M10 - M20 0.30 0.20
Aerated concrete M2.5 - M9 0.30 0.15 Natural or synthetic stone M1 - M2 Not used 0.10
[image:8.595.211.538.611.690.2]DOI: 10.4236/ojce.2019.93016 238 Open Journal of Civil Engineering Table 6. Shear safety in the masonry wall system under earthquake loading.
Direction Compressive stress developed (MPa) developed (MPa) Shear stress strength (MPa) Effective shear Safety status
X-X 0.618 0.507 0.347 Insufficient
Y-Y 0.618 0.180 0.347 Sufficient
3.3. Control of Maximum Drift Ratio in the Structure
The maximum displacement in the structure in analyses performed using earth-quake impact was calculated as 2.199 mm. The maximum drift ratio of the structure is 0.02% which is less than the limited damage limit state acceptance criteria described above.
4.
Conclusions
Turkey is an active seismic country. Therefore, earthquakes can be devastating for historical buildings. Damages caused by earthquakes can be manifested by cracks in the arches. Stones are strong in compression and somewhat so in shear, but cannot resist much force in tension, thus masonry arch bridges are designed to be constantly under compression. Furthermore, lateral loads may also be ap-plied to the bridges in addition to vertical loads due to earthquake effects in seismic areas. Consequently, lateral displacements may also occur and cause damage [8].
DOI: 10.4236/ojce.2019.93016 239 Open Journal of Civil Engineering
The authors declare no conflicts of interest regarding the publication of this pa-per.
References
[1] Beysanoğlu, Ş. (1996) Anıtlarıve Kitabeleriile Diyarbakır Tarih, Ankara.
[2] Çulpan, C. (2002) Türk Taş Köprüleri, Ortaçağdan Osmanlı Devrine Kadar, Türk Tarih Kurumu, Ankara.
[3] Halifeoğlu, F.M., Dalkılıç, N., Sert, H. and Halifeoğlu, Z. (2009) Diyarbakır, Dicle (On Gözlü) Köprüsü’nün Rölöve, Restitüsyonve Restorasyon Projelerinin Yapımı, Uluslararası Katılımlı Tarihi Eserlerin Güçlendirilmesive Geleceğe GüvenleDevre-dilmesi Sempozyumu, Diyarbakır.
[4] Bakırer, Ö. (2002) Anadolu Selçuklu Mimarisinde Taşçıİşaretleri, Uluslararası Sanat Tarihi Sempozyumu, Prof. Dr. Gönül Güney’e Armağan.
[5] Demir, A., Gedik, H., Güneş, O. and Korkmaz, K. (2016) Structural and Seismic Evaluation of Historical Dicle Bridge in Turkey. Istanbul Technical University, De-partment of Architecture, Taskisla, Turkey Istanbul Technical University, Depart-ment of Civil Engineering, Istanbul, İstanbul Bridge Conference.
[6] Tarihi Yapıların Deprem Risklerinin Yönetimi Kılavuzu-Vakıflar Genel Müdürl- üğü-2007 (Turkish Guidelines on the Management of Earthquake Risks for Historic Structures).
[7] Turkey Building Earthquake Regulation (2019).


![Table 5. Initial shear strengths of walls, fvko (MPa) [7].](https://thumb-us.123doks.com/thumbv2/123dok_us/8982860.394520/8.595.210.536.165.423/table-initial-shear-strengths-walls-fvko-mpa.webp)

