Ultrasonic monitoring to assess the impacts of forest
conversion on Solomon Island bats
Tammy E. Davies1,2, Filip Ruzicka3, Tyrone Lavery4, Charlotte L. Walters2,3& Nathalie Pettorelli3 1Department of Geography and Sustainable Development, University of St Andrews, St Andrews, Fife KY16 9AL, United Kingdom 2Institute of Zoology, Zoological Society of London, Regent’s Park, London NW1 4RY, United Kingdom
3Department of Genetics Evolution and Environment, Faculty of Life Sciences, University College London, Gower Street, London WC1E 6BT,
United Kingdom
4School of Biological Sciences, The University of Queensland, Brisbane, Queensland 4072, Australia
Keywords
Biodiversity, cacao, conservation, echolocation, land-use change, Pacific
Correspondence
Tammy E. Davies, School of Environmental Studies, University of Victoria, PO Box 1700 STN CSC, Victoria, BC, Canada. Tel: +1 250 721 7354; Fax: +1 250 721 8985; E-mails: tedavies@uvic.ca and tedavies23@gmail.com
Funding Information
TED was supported by a Natural Environment Research Council studentship NE/I528642/1. Additional funding for fieldwork was provided by the Chester Zoo and Rufford Small Grants (11022-1).
Editor: Rob Williams
Associate Editor: Graeme Buchanan
Received: 4 June 2015; Revised: 20 May 2016; Accepted: 24 May 2016
doi: 10.1002/rse2.19
Abstract
Paleotropical islands are experiencing extensive land-use change, yet little is known about how such changes are impacting wildlife in these biodiversity hot-spots. To address this knowledge gap, we characterized bat responses to forest conversion in a biodiverse, human-threatened coastal rainforest habitat on Makira, Solomon Islands. We analysed ~200 h of acoustic recordings from echolocating bats in the four dominant types of land use on Makira: intact for-est, secondary forfor-est, food gardens and cacao plantations. Bat calls were identi-fied to the species level using a supervised classification model (where labelled data are used to train the system). We examined relative activity levels and morphological traits across habitats. Relative activity levels were highest in intermediately disturbed habitats and lowest in the most heavily disturbed habi-tat, although these differences were not significant. There were significant differ-ences in the mean forearm length of bat assemblages across habitats, with the highest mean forearm length found in the most open habitat (Cacao). Overall, our study constitutes the first detailed exploration of anthropogenic effects on mammalian diversity in the Solomon Islands and includes the first acoustic and morphological information for many bat species in Melanesia. We use our experience to discuss the challenges of acoustic monitoring in such a remote and poorly studied region.
Introduction
Tropical rainforests are Earth’s most diverse ecosystem, harbouring more than half of all known species (Myers et al. 2000). They are also one of the most threatened habitats, at the frontier of agricultural expansion and increasing human influence (Laurance 1999; Bradshaw et al. 2009). Anthropogenic land-use change is a major driver of the current biodiversity decline (de Lima et al. 2012). With only 7.7% of the global forest area within strictly protected areas (Schmitt et al. 2008), there is
growing recognition of the importance of understanding biodiversity responses to land-use change to inform man-agement decisions.
tropical forest organisms can persist in human-dominated landscapes can improve decision making for environmen-tal management (Flynn et al. 2009; Gardner et al. 2010). To address this shortcoming, we assess the relative levels of biodiversity along a gradient of land use across four habitats: intact forest, secondary forest, subsistence gar-dens and cacao plantations (Theobroma cacao), using a case study from Makira, Solomon Islands. The Solomon Islands, located in the south-west Pacific, present an ideal study site because they are of global importance to biodi-versity, being part of the East Melanesian Islands biodiver-sity hotspot (Myers et al. 2000). The Solomon Islands also contain one of the last remaining tracts of undisturbed coastal tropical rainforest (Bayliss-Smith et al. 2003); yet Makira, like the rest of the Solomon archipelago, is under-going rapid land-use change. Our assessment focuses on echolocating bats. Bats are an important component of mammalian biodiversity, comprising one fifth of all mam-mal species globally (Simmons 2005), and 64% of the total mammal fauna across the south Pacific region (Flannery 1995). Bats are taxonomically and functionally diverse, often abundant, global in distribution and provide key ecosystem services, including pollination, seed dispersal and regulation of pests (Jones et al. 2009). Bats are also sensitive to human-induced changes to ecosystems, including agricultural intensification (Wickramasinghe et al. 2003), urbanization (Loeb et al. 2009) and deforesta-tion and fragmentadeforesta-tion (e.g. Estrada et al. 1993; Kunz et al. 2007; Vleut et al. 2012). Consequently, bats are gen-erally considered an excellent indicator taxa of habitat dis-turbance at the community level (e.g. Wickramasinghe et al. 2003; Kalcounis-Rueppell et al. 2007; Jones et al. 2009). The use of bats as an indicator is also facilitated by their echolocation calls, which can be detected using ultra-sonic monitoring. Typically, these calls do not overlap with other taxa and most bat species have evolved species-specific echolocation calls (Jones and Teeling 2006); pas-sive acoustic methods are thus an excellent tool for
moni-toring bats. Passive acoustic methods have also
demonstrated convincing advantages over traditional cap-ture techniques as they are non-invasive, allow large auto-matic sampling and can provide large temporal and spatial datasets (Leeney et al. 2011; Britzke et al. 2013). However, bat calls show great intra-species variation caused by fac-tors such as habitat, geography, sex and age, which can complicate species identification (Obrist 1995; Murray et al. 2001). The development and application of auto-mated identification tools are increasing and associated with high classification accuracy (e.g. see Kaewtip et al. 2013; Stathopoulos et al. 2014); consequently, the use of acoustic monitoring of bats has been proposed as a fast, efficient method to generate a global bat biodiversity indi-cator (Jones et al. 2011).
We formulate two hypotheses regarding bat responses to land-use change. First, we expect that intact and secondary forests will exhibit similar bat activity levels, as previous studies have shown that bat diversity remains high across forest successional stages (Presley et al. 2008; de la Pe~ na-Cuellar et al. 2012). Reasons for this include high food availability, high level of habitat heterogeneity and low risk of predation in these habitats (Estrada et al. 2004). How-ever, we expect bat activity to be lower in cacao plantations because monocultures tend to be bat-poor (Estrada et al. 1993; Harvey and Villalobos 2007; Fukuda et al. 2009; Phommexay et al. 2011). Because food gardens have higher plant diversity than cacao plantations, but more open canopies than forest areas, we hypothesize that gardens will exhibit intermediate bat activity levels.
Second, we hypothesize that the impacts of land-use change will result in responses based on species-specific morphological traits (i.e. forearm length, wing length, aspect ratio). Species-specific differences in wing morphol-ogy affect flight speed and manoeuvrability and subse-quently the foraging ecology of bats (Norberg and Rayner 1987). Bats that forage in more open habitats tend to have long wings with a high aspect ratio; they can fly faster and for longer distances, but have reduced manoeuvrability (Norberg and Rayner 1987). Conversely, bats that forage in more cluttered habitats tend to have short wings with low aspect ratios, they fly slowly and have high manoeuvrability that allows them to forage in dense vegetation (Vaughan 1970). Such morphological features may bias bat species’ activity towards different habitat types (Threlfall et al. 2011) and may also determine species’ adaptability to land-use change (Jung and Threlfall 2016).
In addition to testing these hypotheses, our study sup-plements the limited literature for bat acoustics in the Paleotropics (Phommexay et al. 2011) and provides the first acoustic characterizations and morphological data of bat species common and/or endemic for a data-deficient region of the Solomon Islands. Through this study we also document some of the challenges of using ultrasonic bat detection in a remote and poorly studied region, which are common features of many conservation priority areas; we hope this work will help guide future assess-ments in similar challenging regions.
Materials and Methods
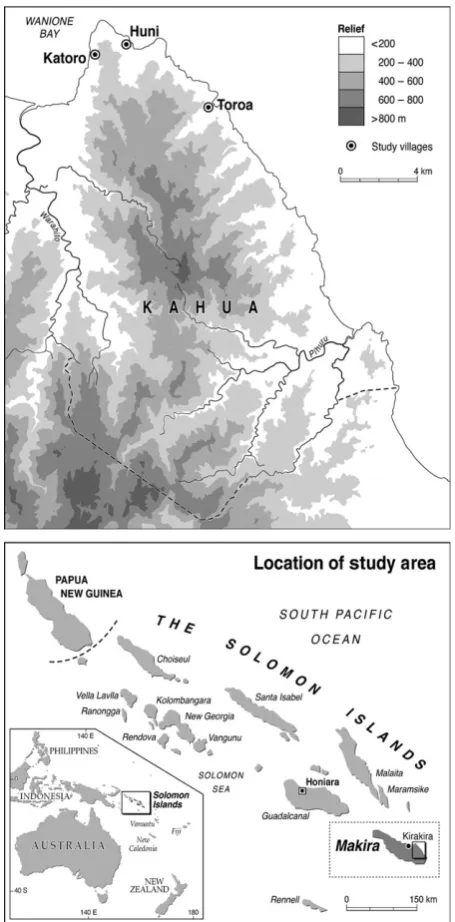
Study area
ridges, with elevations of up to 1200 m (Allen et al. 2006). It has a wet tropical climate characterized by high humidity, with very little annual variation and almost no seasonality (Danielsen et al. 2010; Fasi et al. 2013). Makira contains a total of 17 bat species (from 10 fami-lies), of which 10 are echolocating species (Flannery 1995; Lavery et al. 2016).
The Kahua region has c. 4500 inhabitants across 42 mostly coastal communities. Local livelihoods depend on subsistence agricultural production, focussing on swidden (shifting) cultivation (Mertz et al. 2012), with lands rotated
between cultivation (‘garden’) and fallow. The Kahua region is one of the only areas on the island not to have any commercial logging licenses (past or present; Pauku 2009), and because logging companies are interested mainly in flat, lowland areas, the steep terrain of the Kahua region could be considered a relatively safe sanctuary for biodiver-sity. However, decreases in primary productivity have been detected in Kahua, suggesting environmental change at a landscape scale (Garonna et al. 2009). One of the most noticeable changes within the Kahua region is the prolifera-tion of cacao plantaprolifera-tions (Davies et al. 2015). Cacao was first introduced to the Solomon Islands in 1950s, with smallholder plantations expanding in the late 1970s; pre-sently, national policies and external aid continue to pro-mote smallholder production of cacao throughout the Solomon Islands (Hivu 2013). These land-use practices have created a mosaic of intact forest, garden and sec-ondary regrowth habitats (see Bayliss-Smith et al. 2003), with useful trees, such as fruit and nut trees, preserved throughout the landscape (Mertz et al. 2012). There are four main habitat types that can be broadly distinguished across the Kahua region with varying land-use intensity; these can be characterized as follows:
1 Intact forest: closed canopy (30–45 m high), compris-ing large, hardwood trees, includcompris-ing those of higher quality timber (Pometia pinnata, Vitex cofassus, Ptero-carpus indicus, Calophyllum vitiense), with dense under-story vegetation including thickets of smaller trees, rattan palms (Calamus spp.), Stenochlaena ferns and
Selaginella mosses. Anthropogenic disturbance is a ubiquitous feature of the forests of the Solomon Islands (Bayliss-Smith et al. 2003), as such no forest in this region can be considered ‘primary’ in its truest sense. We therefore use intact forest to refer to the lowland, evergreen tropical rainforest (0–500 m asl) with – his-torical, but presently–limited human disturbance.
2 Secondary forest: non-continuous canopy, although crowns can be in close proximity to one another, mainly composed of small fast growing, pioneer species (includingMacarangaspp.,Ficus spp.and Hibiscus tili-aceus) interspersed with larger trees, including Ngali nut Canarium indicum, breadfruit Artocarpus altilis, coconut Cocos nucifera and sago palm Metroxylon salomonense. This habitat is often used intensively by local communities for the collection of firewood, tim-ber and wild plants.
3 Garden: an open canopy above food crops such as yam (Dioscorea spp.), taro Colocasia esculenta, sweet potato
[image:3.595.57.285.217.679.2]spp., Barringtonia edulis, Inocarpus fagifer) and fruit trees (Ficus spp., A. altilis, Mangifera indica, Carica papaya). Garden is the Melanesian term for land used for small-scale agriculture (see Mertz et al. 2012), such areas are often located beyond the immediate vicinity of dwellings and are not strictly ‘home gardens’ as defined elsewhere in the world.
4 Cacao: smallholder plantations of the cacao tree T. ca-cao which typically grows 4–8 m high. Cacao trees are planted close together resulting in a low closed canopy. There is no understory because it is regularly cleared. The cacao plantation is often interspersed with coconut trees and occasionally lone large trees such as bread-fruit A. altilis and Malay apple Syzygium malaccense, but with almost no shade cover.
Acoustic monitoring
Ultrasonic monitoring of bats was conducted from Febru-ary to July 2012 using the fixed location ultrasonic recor-der SM2BAT 384 kHz and omnidirectional SMX-US microphone (Wildlife Acoustics, www.wildlifeacoustics.-com). The SM2BAT is a 16-bit full spectrum recorder, which preserves the amplitude and harmonic details of the original bat signal. It was programmed to record con-tinuously from sunset until sunrise, relative to local times. The detector was attached to a tree at a height of at least 1.5 m, with the microphone slightly pointing down to protect it from rain damage. The detector was positioned at different sites within each of the four habitat types (i.e. each sampling night was at a different location), rather than repeated sampling at one site (following Gorresen et al. 2008). Topographically, the placement of the detec-tor was between 20 m and 500 m above sea level (e.g. within lowland forest) to avoid habitat changes associated with higher altitudes. Positioning the SM2BAT was con-strained by the rugged terrain and the nature of the land-use mosaic across the study site, but care was taken to position the SM2BAT as widely as possible to increase independence of sampling (at least 1 km from the nearest recording site). Makira experiences limited seasonal vari-ability and so there were no significant seasonal changes during the sampling period, and sampling was only con-ducted in appropriate weather conditions (e.g. the detec-tor was not deployed during heavy rain and/or high wind). The files were saved in the lossless compressed for-mat.wac and then transformed into the format.wav with the software WAC to WAV Converter Utility.
Capture methods
Bats were captured using a combination of mist nets (12 92.8 m, 38 mm black nylon mesh – M. Nakamori
and Co. Ltd, Yokkaichi, Japan) and harp traps (Austbat, 1055 Bullumwaal Rd, Mt Taylor, VIC 3875). Echolocation calls from captured individuals were recorded using an AnabatTM
Walkabout unit with full spectrum recording hardware (Titley Scientific, Brisbane, Queensland, Aus-tralia). Constant frequency calling Hipposiderid species were held c. 30 cm from the microphone for recording. This minimizes the impact of Doppler compensation of the constant frequency component of the calls (Leary and Pennay 2011). Reference calls from frequency-modulating species were captured by directing the recorder towards free-flying bats that had been released at the point of cap-ture. Wing measurements and aspect ratios were recorded from captured bats by the authors with hand-held cal-lipers to the nearest 0.01 mm. Wing lengths were mea-sured from shoulder to tip of one outstretched wing. Aspect ratios were calculated using the methods of Blood and McFarlane (1988). This method calculates wing area by representing the chiropteran wing in two parts: the plagiopatagium represented as a simple rectangle bounded by the forearm (FA) and fifth digit (D5) and chriopatag-ium represented as a simple triangle with a base the length of the fifth digit (D5) and a height the length of the third digit (D3). The area of one wing (WA) is thus represented by the equation: WA =(FA9D5) +0.5 (D5 9D3).
Ethics statement
All methods used in this study were approved by the rele-vant host institutions review committees, and the appro-priate research permits were obtained from the Solomon Islands government prior to data collection.
Data analyses
For all statistical analyses, we selected the highest quality call (defined by a high signal-to-noise ratio, as computed by SonoBat) from each sequence to represent one bat pass. We used a multinomial probit regression model with Gaussian process prior, which is a state of the art discriminative classification model achieving good generalization capabilities with moderate to low numbers of training data (see Stathopoulos et al. 2014, for further information on this method). We had a limited number of labelled calls (calls for which the bat had been identi-fied through capture methods) for seven species (unpubl. data). Overall classification was good in the labelled dataset with a 92% cross validated accuracy (see Fig. S1). Species classification is probabilistic, and there-fore with seven species it is possible that a call can be classified to a particular species with a threshold of 15%. To prevent ambiguous classification, we applied a threshold of 50% to the unlabelled call probabilities to classify calls to species level. We also examined the effect of different thresholds on the percentage of calls classi-fied (see Fig. S2); increasing the threshold introduces a trade-off between maximizing correct classifications and minimizing the number of unclassified calls (Walters et al. 2012). Using the >50% threshold we were able to classify 52% of the unlabelled calls and deemed this an appropriate threshold based on number of calls classified and robust identification. This approach was able to reli-ably classify five of the seven species: Aselliscus tricuspi-datus, Hipposideros demissus, Miniopterus tristis,
Miniopterus australis and Myotis moluccarum. However, the call probabilities were too low to classify the other two species (Miniopterus oceanensis and Hipposideros cervinus). In addition, visual comparisons of call profiles within our dataset with previous descriptions and refer-ence calls from Makira found apparent correspondrefer-ence with two additional species: M. oceanensis and Mosia nigrescens. However, the quantitative approach to the identification of echolocation calls offers consistent and repeatable classification of unknown calls (Redgwell et al. 2009) and therefore we only note the information from
visual inspection here for interest given our focus on a data-poor area.
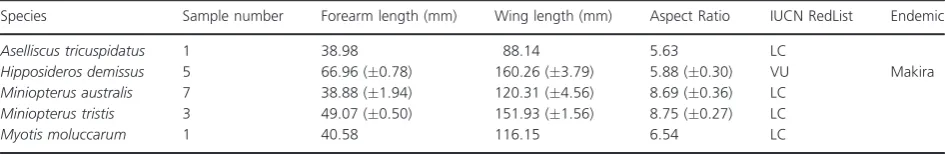
To test our hypotheses regarding bat responses to habi-tat conversion, we used activity levels (bat passes per night) using the combined species data (including unclas-sified species). Although commonly used, we emphasize that activity level is only an approximation of true abun-dance (Walsh et al. 2004). There is a lack of published information about the ecology of Solomon Island bats and so we used three morphological traits: (1) forearm length, (2) wing length, (3) aspect ratio, which we recorded from captured species (see Table 1). To assess any differences between habitats we used the classified species dataset and used Kruskal–Wallis tests, because they do not require data to be normally distributed. All analyses were con-ducted using R (version 3.2.2; R Core Team 2013). Because of the low total number of bat species found on Makira, we elected not to produce or interpret estimates of true species richness in each habitat, though we note them for information. We note that there are inherent limitations to acoustic monitoring data, including unequal detectability across species, which should be considered when interpreting the results. For example, species with loud calls are more likely to be recorded than slow-flying species with soft calls. Activity levels therefore cannot be compared between bat species (Hanspach et al. 2012). However, a key objective of our study was to compare rel-ative patterns across the different habitats, rather than absolute activity levels between different species.
Results
We recorded a total of 1925 bat passes over 16 days (190 h of recording) across all four habitats. This trans-lates to 11.23 (1.15 SD) mean recording hours per night [cacao: 11.98 (0.31 SD) h; garden: 10.44 (1.57 SD) h; secondary forest: 10.98 (1.01 SD) h; intact forest: 11.60 (1.14 SD) h].
[image:5.595.57.530.587.664.2]We recorded the highest activity levels in gardens with 276.1 (473 SD) mean bat passes per night, followed by
Table 1. Scientific names and morphological traits of all species considered in the analyses.
Species Sample number Forearm length (mm) Wing length (mm) Aspect Ratio IUCN RedList Endemic
Aselliscus tricuspidatus 1 38.98 88.14 5.63 LC
Hipposideros demissus 5 66.96 (0.78) 160.26 (3.79) 5.88 (0.30) VU Makira
Miniopterus australis 7 38.88 (1.94) 120.31 (4.56) 8.69 (0.36) LC
Miniopterus tristis 3 49.07 (0.50) 151.93 (1.56) 8.75 (0.27) LC
Myotis moluccarum 1 40.58 116.15 6.54 LC
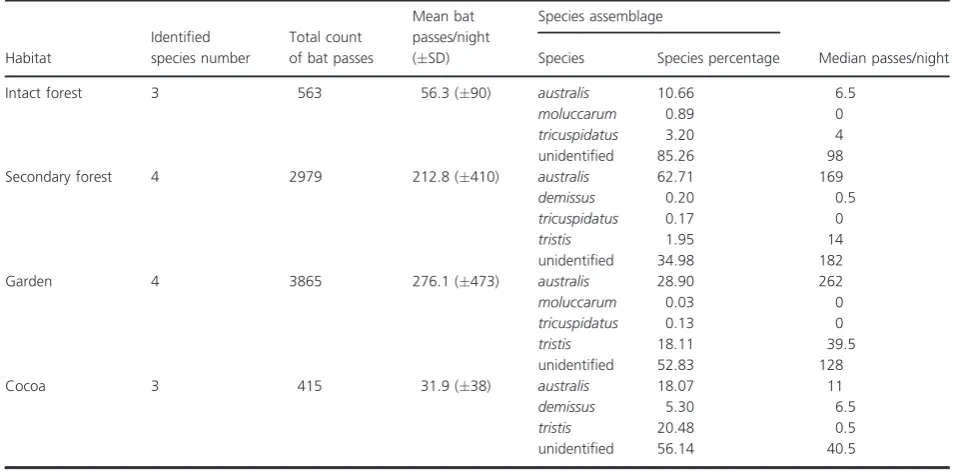
secondary forest with 212.8 (410 SD) mean bat passes per night, and low levels in both intact forest with 56.3 (90 SD) and cacao plantations with 31.9 (38 SD) mean bat passes per night (Table 2, Fig. 2). However, the variation between sampling nights within a given habitat was high, with large standard deviations and higher mean bat passes per night than median bat passes per night in all disturbed habitats, suggesting an important effect of few extreme sampling nights on mean activity levels (Table 2). Overall, bat activity between all four habitats did not differ significantly (H=3.78,P=0.29, Fig. 2).
Using a 50% threshold we were able to identify 52% of the calls to species level. From this subset,M. australiswas the most commonly identified species (77.5%) and was the only species to be recorded in all habitats (Table 2). Using mean bat passes per night as a measure of activity level,M. australiswas the most common species recorded in all habitats except cacao plantations. Miniopterus tristis
was the second most commonly recorded species (21%) and was found in all habitats except intact forest, with a higher relative abundance in cacao plantations (where it was the most common species) and gardens, with a low activity level recorded in secondary forest.Aselliscus tricus-pidatus, H. demissus and My. moluccarum were all recorded in low numbers. The highest activity levels for bothAs. tricuspidatus andMy. moluccarumwere found in intact forest, and neither of these species were detected in the most heavily disturbed habitat cacao plantations. The
endemic species H. demissus was only recorded in
secondary forest and cacao plantation habitats, with higher relative activity levels in cacao areas. Myotis moluccarum
was recorded in low numbers in both intact forest and
garden habitats (Table 2). The identification of
My. moluccarum on Makira represents a range expansion for this species, as it has not previously been recorded on this island, but is known to occur on neighbouring islands (Flannery 1995).Hipposideros demissuswas the only ende-mic species recorded, the remainder of the species have ranges that extend well beyond the Solomon Islands into New Guinea and Southeast Asia.
[image:6.595.313.538.240.385.2]As land-use intensity increased, the mean forearm length was found to increase, with the highest mean
Table 2. Detailed information on bat species assemblages for each habitat.
Habitat
Identified species number
Total count of bat passes
Mean bat passes/night (SD)
Species assemblage
Median passes/night
Species Species percentage
Intact forest 3 563 56.3 (90) australis 10.66 6.5
moluccarum 0.89 0
tricuspidatus 3.20 4
unidentified 85.26 98
Secondary forest 4 2979 212.8 (410) australis 62.71 169
demissus 0.20 0.5
tricuspidatus 0.17 0
tristis 1.95 14
unidentified 34.98 182
Garden 4 3865 276.1 (473) australis 28.90 262
moluccarum 0.03 0
tricuspidatus 0.13 0
tristis 18.11 39.5
unidentified 52.83 128
Cocoa 3 415 31.9 (38) australis 18.07 11
demissus 5.30 6.5
tristis 20.48 0.5
unidentified 56.14 40.5
Forest Secondary Garden Cacao
0
5
00
1000
1500
2000
2500
[image:6.595.63.541.454.690.2]Mean bat passes per night
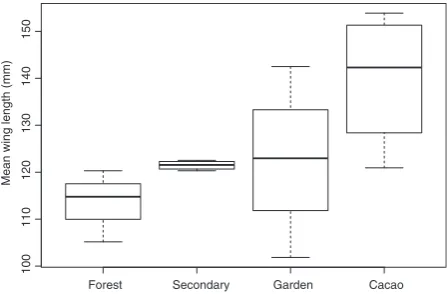
forearm length found in cacao habitat. The forearm length across all habitats was significantly different (H=8.18, P=0.04, Fig. 3). Post hoc tests did not reveal any significant pairwise comparisons at P=0.05, but there was a significant comparison between cacao and intact forest at P=0.1. The mean wing length of bats was also noted to increase as land-use intensity increased (Fig. 4), but no significant relationships were found for mean wing length or aspect ratio (see Figure S4).
Discussion
Land-use change and bat assemblages in Makira
We found differences in the morphological traits of across habitats, with the largest mean forearm length recorded in cacao plantations, the most heavily disturbed habitat. Although we did not find overall activity levels to differ
significantly between habitats, our results provide some evidence that moderately disturbed habitats do not nega-tively impact bat assemblages on Makira, Solomon Islands.
The highest mean activity levels were found in the intermediately disturbed habitats of secondary forest and gardens, with the lowest activity levels recorded in cacao plantations, and although not statistically significant in this study, these findings are congruous to similar studies in Neotropical forests (Estrada et al. 1993; Medellın et al. 2000; Williams-Guillen and Perfecto 2011). The differ-ences in activity levels are likely to be influenced by food availability, with the moderately disturbed habitats (sec-ondary forest and garden) influenced by the high plant diversity and associated high insect abundance, which provide favourable foraging opportunities for bats (Klein et al. 2002). Whereas cacao plantations have been found to contain reduced arthropod diversity (Perfecto and Snelling 1995; Perfecto et al. 1997; Watt et al. 1997) and thus a reduced diversity of available food resources, rela-tive to intact forest and agroforestry systems (Castro-Luna and Galindo-Gonzalez 2012; Garcia-Morales et al. 2013). Note, this is in contrast to studies in shade cocoa agro-forests, which are structurally complex habitats, that have found these areas to support similar levels of bat species richness to forests (Harvey and Villalobos 2007). Given the insectivorous diet of most echolocating bats (Fenton 1982), monocultures, such as cacao plantations are likely to make poor habitats for Paleotropical bats (Fukuda et al. 2009; Phommexay et al. 2011). In addition, cacao plantations on Makira are relatively open habitats, which also poses an increased predation risk for bats (i.e. from hawks and owls; Russo et al. 2007).
The morphological features of bats may determine the species’ adaptability to land-use change (Jung and Threl-fall 2016). We found the largest mean forearm length in cacao, the most open habitat. Long forearm lengths aid in attaining greater speeds (Norberg and Rayner 1987) and may enable species with this trait (e.g. H. demissus and M. tristis) to commute larger distances between roosting sites and feeding areas (Jung and Kalko 2011), helping them to utilize and persist in more open habitats, such as cacao plantations. As use intensity increases, land-scapes typically become more simplified and this transi-tion favours fast-flying, mobile species over smaller, less mobile species (e.g. As. tricuspidatus); this trend has been found in recent empirical studies (e.g. Jung and Kalko 2011; Hanspach et al. 2012). Focusing on morphological traits is likely to provide additional insights into the impacts of land-use change on bat assemblages, and con-sequently ecosystem function because species’ traits deter-mine their contribution to ecosystem processes (Newbold et al. 2013).
Forest Secondary Garden Cacao
40
45
50
55
60
[image:7.595.58.283.323.470.2]Mean forearm length (mm)
Figure 3. Mean forearm length for all bats identified to species level in each habitat type.
Forest Secondary Garden Cacao
100
1
10
120
1
30
140
1
50
Mean wing length (mm)
[image:7.595.59.283.524.671.2]The non-significant variation in total activity between different land uses in our study could be because echolo-cating bats use habitats indiscriminately, but could also be a consequence of our small sample size. Skalak et al. (2012) found ‘common’ species were detected over 2–5 nights on average, but that longer sample periods (>45 nights) were necessary to detect ‘rare’ species (Skalak et al. 2012). Furthermore, bats on Makira are predomi-nantly cave-roosting (Flannery 1995) and so the proxim-ity to cave roosts (which was unknown) could account for the variation in activity levels between sampling night and be causing high inter-habitat variation and non-sig-nificant results. Also, the lunar cycle may have influenced the activity levels of bats in this study through a phe-nomenon known as lunar phobia (Salda~na-Vazquez and Munguıa-Rosas 2013).
Acoustic recordings have increasingly been used as a means of monitoring bats and other mammals for over a decade (Blumstein et al. 2011). A strength of acoustic methods is that they capture a more complete and less biased sample of a given area’s acoustic biodiversity than traditional capture methods (MacSwiney et al. 2008). In our recordings, all but two species of echolocating bat known to Makira were detected (using machine learning and visual identification methods). This included Mo. ni-grescens and the previously unrecorded My. moluccarum. The only species caught by trapping methods which remained undetected in our data was H. cervinus. Thus, acoustic methods have the potential to produce high inventory completeness, confirming their appropriateness for detecting many species. Higher frequency echolocation calls attenuate quickly so tend to be under-represented in acoustic monitoring (Wordley et al. 2014) and we note that overall Hipposiderids were rarely detected in our recordings. On Makira, intact forests are extremely dense, cluttered environments and detectability is likely to be poor in this habitat resulting in artificially low activity levels, further compounding the detection of Hipposiderid calls. Aselliscus tricuspidatus was found to have higher activity levels in intact forest than in other modified habi-tats. Personal field observations have also noted that another Hipposiderid (H. cervinus) is restricted to intact forest, and it is likely that the remaining undetected Hip-posiderid species known to Makira (Hipposideros calcara-tus) would be found in intact forest (Flannery 1995).
Our discriminative classification model approach was good (92% cross validated accuracy in the labelled data-set). However, there was large variability in the results which reduced the classification accuracy for some spe-cies, including M. oceanensis, which we were ultimately unable to identify in our dataset using >50% threshold. Such problems could be overcome by having more folds in the analysis (i.e. repeating the experiment many times)
or through having more data for each species. However, both of these approaches require significant amounts of labelled data, which were unavailable to us.
Acoustic monitoring in a remote and poorly studied region: challenges and future application
Many tropical areas lack even basic information on the abundance of different bat species, their distribution and habitat requirements (Wordley et al. 2014). Inventorying and characterizing such understudied biodiversity hot-spots, in terms of species composition and diversity evalu-ation is essential in order to develop appropriate conservation priorities and management plans. In this respect, inventory methods need to be enhanced and speeded up by a variety of approaches. Passive acoustic methods have demonstrated convincing advantages as they are non-invasive, allow large automatic sampling and can be simultaneously used on several taxa, and provide very large and temporal and spatial datasets (Acevedo and Vil-lanueva-Rivera 2006; Gasc et al. 2013). Using these data-sets to identify genus or species level in poorly studied regions can pose a large challenge because identification processes require an established and comprehensive call reference library, which is often lacking. This poses the lar-gest challenge to maximizing the utility of acoustic meth-ods for assessing and monitoring bat populations in poorly studied areas. In many ways, Makira represented an easy test case for the use of acoustic methods in a challeng-ing environment because there are a limited number of echolocating bats (10), far less than in continental forest areas [e.g. studies in Mexico had 21 species (Stathopoulos et al. 2014) and Western Ghats had 15 species (Wordley et al. 2014)]. The low number of bat species also facilitated the use of state-of-the-art machine learning methods to identify species, and approach that has been shown to have a high classification accuracy (Stathopoulos et al. 2014). However, the practicalities of using ultrasonic monitoring in tropical environments are poorly documented, and the reality of the challenging working conditions pose a hurdle to expanding the use of ultrasonic monitoring in these areas, and indeed is likely part of the reason that these regions remain poorly studied and data deficient. In order to facilitate the utility of ultrasonic monitoring in remote, tropical forest environments we document some of the fol-lowing challenges experienced during this study to aid future conservation efforts.
Placement of detector
ultrasonic recorder as it needs to be in a location that is representative of the habitat, while also maximizing the chances of detection (e.g. not too hidden by vines or other vegetation). In addition, more open and human-intensive habitats (e.g. subsistence gardens, cacao planta-tions) mean the detector is visible to local people, which increases the risk of disturbance, damage or theft. In Kahua, our study was conducted with a high level of community engagement, including employment of local people and regular community workshops to explain our study, results and importance. These workshops were conducted using a participatory approach, providing a more neutral platform for community members to raise any issues or concerns they might have had regarding our study or approach. The majority of land in Melanesia is customary-owned, and therefore permission from local landholders was sought before accessing any areas.
As with most areas of tropical forest, Makira experi-ences high rainfall with up to 8 m reported in higher ele-vations (Allen et al. 2006). We did not deploy the detector during nights of heavy rain to avoid damage to the sensitive microphone. However, there were many nights of torrential rain and so this constrained sampling more than we envisioned.
Powering the detector
We used rechargeable batteries to power the SM2BAT. We used two sets of batteries, which we rotated and usu-ally were initiusu-ally sufficient to power the detector for 2 weeks. Humidity is consistently high in the Solomon Islands, which is known to be destructive to battery life; batteries were stored in dry bags when not in use, but they still became rusty and noticeably lost charge towards the end of the season to the point where one battery set lasted for just one night of recording.
Data storage
We used 32GB SD cards in the SM2BAT and regularly downloaded data from the SD cards to a robust external hard drive. Internet is available in provincial capital Kira-kira, but not at sufficient bandwidth to be able to upload data to online storage.
Overall, we found ultrasonic monitoring to be a useful tool for assessing the impacts of land conversion on bat assemblages, but that the robustness of our study was compromised by difficult working conditions and lack of a comprehensive call library. In order to improve the applicability of ultrasonic monitoring to conservation assessments and long-term monitoring programmes, recording more echolocation calls from across the tropics and particularly for data-deficient areas is a crucial next
step. In order to maximize this, multiple detectors with solar chargers would be an appropriate and more effi-cient, but inherently more expensive, approach.
Acknowledgments
We gratefully acknowledge all our field assistants (J. Ta’ata, F. Wagoa, R. Tarohania, N. Haga, B. Wa’apa and M. Haga) and the Kahua Association for their guidance and support. We are also indebted to all Kahuan communities that allowed access to their land. Thanks are extended to the Solomon Islands Ministry of Education and Makira-Ulawa provincial authorities for permitting this research. We thank Vassilios Stathopoulos for help with the analysis and Kate Jones for advice on the approach. TED was supported by a Natural Environment Research Council studentship NE/I528642/1. Additional funding for fieldwork was pro-vided by the Chester Zoo and Rufford Small Grants (11022-1). We thank three anonymous reviewers for their insightful comments that improved the paper.
Data Accessibility
Data will be hosted in the EchoBank bat call archive, a bat call reference library hosted by the Zoological Society of London, UK.
Conflict of Interest
The authors declare no conflict of interest.
References
Acevedo, M. A., and L. J. Villanueva-Rivera. 2006. Using automated digital recording systems as effective tools for the monitoring of birds and amphibians.Wildl. Soc. Bull.34, 211–214.
Achard, F., H. D. Eva, H.-J. Stibig, P. Mayaux, J. Gallego, T. Richards, et al. 2002. Determination of deforestation rates of the world’s humid tropical forests.Science297, 999–1002. Allen, M.G., R. M. Bourke, B. R. Evans, E. Iramu, R. K.
Maemouri, B. F. Mullen, et al. 2006. Solomon Islands Smallholder Agriculture Study: Volume 4 Provincial Reports. AusAID, Canberra, Australia.
Bayliss-Smith, T., E. Hviding, and T. Whitmore. 2003. Rainforest composition and histories of human disturbance in Solomon Islands.Ambio32, 346–352.
Blood, B. R., and D. A. McFarlane. 1988. A new method for calculating the wing area of bats.Mammalia52, 600–603. Blumstein, D. T., D. J. Mennill, P. Clemins, L. Girod, K. Yao,
G. Patricelli, et al. 2011. Acoustic monitoring in terrestrial environments using microphone arrays: applications, technological considerations and prospectus.J. Appl. Ecol.
Bradshaw, C. J., N. S. Sodhi, and B. W. Brook. 2009. Tropical turmoil: a biodiversity tragedy in progress.Front. Ecol. Environ.7, 79–87.
Britzke, E., E. Gillam, and K. Murray. 2013. Current state of understanding of ultrasonic detectors for the study of bat ecology.Acta Theriol.58, 109–117.
Castro-Luna, A. A., and J. Galindo-Gonzalez. 2012. Enriching agroecosystems with fruit-producing tree species favors the abundance and richness of frugivorous and nectarivorous bats in Veracruz, Mexico.Mamm. Biol.77, 32–40. Danielsen, F., C. E. Filardi, K. A. Jønsson, V. Kohaia, N.
Krabbe, J. B. Kristensen, et al. 2010. Endemic avifaunal biodiversity and tropical forest loss in Makira, a mountainous Pacific island.Singap. J. Trop. Geogr.31, 100–114.
Davies, T. E., R. H. Clarke, J. G. Ewen, I. R. A. Fazey, N. Pettorelli, and W. Cresswell. 2015. The effects of land-use change on the endemic avifauna of Makira, Solomon Islands: endemics avoid monoculture.Emu115, 199–213. Estrada, A., R. Coates-Estrada, and D. Meritt. 1993. Bat species
richness and abundance in tropical rain forest fragments and in agricultural habitats at Los Tuxtlas, Mexico. Ecography16, 309–318.
Estrada, A., C. Jimenez, A. Rivera, and E. Fuentes. 2004. General bat activity measured with an ultrasound detector in a fragmented tropical landscape in Los Tuxtlas, Mexico. Anim. Biodivers. Conserv.27, 5–13.
Fasi, J., G. Brodie, and C. Vanderwoude. 2013. Increases in crop pests caused byWasmannia auropunctatain Solomon Islands subsistence gardens.J. Appl. Entomol.137, 580–588. Fenton, M. B. 1982. Echolocation, insect hearing and feeding
ecology of insectivorous bats. Pp. 261–285inT. H. Kunz, ed.Ecology of bats. Pienum Press, New York.
Flannery, T. F. 1995.Mammals of the south-west Pacific & Moluccan Islands. Cornell University Press, Ithaca, New York. Flynn, D. F., M. Gogol-Prokurat, T. Nogeire, N. Molinari, B.
T. Richers, B. B. Lin, et al. 2009. Loss of functional diversity under land use intensification across multiple taxa.Ecol. Lett.12, 22–33.
Fukuda, D., O. B. Tisen, K. Momose, and S. Sakai. 2009. Bat diversity in the vegetation mosaic around a lowland dipterocarp forest of Borneo.Raffles Bullet. Zool57, 213–221. Gannon, W. L., and R. E. Sherwin. 2004. Are acoustic
detectors a “silver bullet” for assessing habitat use by bats. Pp. 38–45inR. M. Brigham, E. K. V. Kalko, G. Jones, S. Parsons and H. J. G. A. Limpens, eds.Bat echolocation research: tools, techniques and analysis. Bat Conservation International, Austin, TX.
Garcia-Morales, R., E. I. Badano, and C. E. Moreno. 2013. Response of neotropical bat assemblages to human land use. Conserv. Biol.27, 1096–1106.
Gardner, T. A., J. Barlow, N. S. Sodhi, and C. A. Peres. 2010. A multi-region assessment of tropical forest biodiversity in a human-modified world.Biol. Conserv.143, 2293–2300.
Garonna, I., I. Fazey, M. E. Brown, and N. Pettorelli. 2009. Rapid primary productivity changes in one of the last coastal rainforests: the case of Kahua, Solomon Islands. Environ. Conserv.36, 253–260.
Gasc, A., J. Sueur, S. Pavoine, R. Pellens, and P. Grandcolas. 2013. Biodiversity sampling using a global acoustic approach: contrasting sites with microendemics in New Caledonia.PLoS ONE8, e65311.
Gorresen, P. M., A. C. Miles, C. M. Todd, F. J. Bonaccorso, and T. J. Weller. 2008. Assessing bat detectability and occupancy with multiple automated echolocation detectors. J. Mammal.89, 11–17.
Hanspach, J., J. Fischer, K. Ikin, J. Stott, and B. S. Law. 2012. Using trait-based filtering as a predictive framework for conservation: a case study of bats on farms in southeastern Australia.J. Appl. Ecol.49, 842–850.
Harvey, C. A., and J. A. G. Villalobos. 2007. Agroforestry systems conserve species-rich but modified assemblages of tropical birds and bats.Biodivers. Conserv.16, 2257–2292. Hivu, D. O. 2013.The impact of smallholder cocoa production
on rural livelihoods: a case study from the Solomon Islands. Master of AgriScience, Massey University, Palmerston North, New Zealand.
Jones, G., and E. C. Teeling. 2006. The evolution of echolocation in bats.Trends Ecol. Evol.21, 149–156. Jones, G., D. S. Jacobs, T. H. Kunz, M. R. Willig, and P. A.
Racey. 2009. Carpe noctem: the importance of bats as bioindicators.Endanger. Species Res.8, 93–115.
Jones, K. E., J. A. Russ, A.-T. Bashta, Z. Bilhari, C. Catto, I. Cs}osz, et al. 2011. Indicator bats program: a system for the global acoustic monitoring of bats. Pp. 213–247inB. Collen, N. Pettorelli, J. E. M. Ballie and S. M. Durant, eds. Biodiversity monitoring and conservation: bridging the gap between global commitment and local action. Oxford, UK, Wiley-Blackwell.
Jung, K., and E. K. Kalko. 2011. Adaptability and vulnerability of high flying Neotropical aerial insectivorous bats to urbanization.Divers. Distrib.17, 262–274.
Jung, K., and C. G. Threlfall. 2016. Urbanisation and Its effects on bats–a global meta-analysis. Pp. 13–33inC. C. Voigt and T. Kingston, eds.Bats in the anthropocene: conservation of bats in a changing world. Springer International
Publishing.
Kaewtip, K., L. N. Tan, A. Alwan, and C. E. Taylor. 2013. A robust automatic bird phrase classifier using dynamic time-warping with prominent region identification. International Conference on Acoustics, Speech and Signal Processing (ICASSP), 2013 Vancouver, BC IEEE, 768–772.
Kalcounis-Rueppell, M. C., V. Payne, S. Huff, and A. Boyko. 2007. Effects of wastewater treatment plant effluent on bat foraging ecology in an urban stream system.Biol. Conserv.
138, 120–130.
agroforestry systems on coffee flower-visiting and trap-nesting bees and wasps.Conserv. Biol.16, 1003–1014. Kunz, T. H., E. B. Arnett, W. P. Erickson, A. R. Hoar, G. D.
Johnson, R. P. Larkin, et al. 2007. Ecological impacts of wind energy development on bats: questions, research needs, and hypotheses.Front. Ecol. Environ.5, 315–324.
Laurance, W. F. 1999. Reflections on the tropical deforestation crisis.Biol. Conserv.91, 109–117.
Lavery, T. H., A. D. Olds, J. M. Seddon, and L. K. P. Leung. 2016. The mammals of northern Melanesia: speciation, ecology, and biogeography.Mamm. Rev.46, 60–76. Leary, T., and M. Pennay. 2011. Echolocation calls of eight
microchiroptera from papua new guinea. Pp. 106–127inB. Law, P. Eby, D. Lunney and L. Lumsden, eds.The biology and conservation of Australasian bats. Royal Zoological Society of New South Wales, Mosman, NSW, Australia. Leeney, R. H., D. Carslake, and S. H. Elwen. 2011. Using static
acoustic monitoring to describe echolocation behaviour of Heaviside’s dolphins (Cephalorhynchus heavisidii) in Namibia.Aquat. Mamm37, 151–160.
de Lima, R. F., M. Dallimer, P. W. Atkinson, and J. Barlow. 2012. Biodiversity and land-use change: understanding the complex responses of an endemic-rich bird assemblage. Divers. Distrib.19, 411–422.
Loeb, S. C., C. J. Post, and S. T. Hall. 2009. Relationship between urbanization and bat community structure in national parks of the southeastern US.Urban Ecosys.12, 197–214.
MacSwiney, G., M. Cristina, F. M. Clarke, and P. A. Racey. 2008. What you see is not what you get: the role of ultrasonic detectors in increasing inventory completeness in Neotropical bat assemblages.J. Appl. Ecol.45, 1364–1371. Medellın, R. A., M. Equihua, and M. A. Amin. 2000. Bat
diversity and abundance as indicators of disturbance in Neotropical rainforests.Conserv. Biol.14, 1666–1675. Mertz, O. L. E., T. Birch-Thomsen, B. O. Elberling, S.
Rothausen, T. B. Bruun, A. Reenberg, et al. 2012. Changes in shifting cultivation systems on small Pacific islands. Geograp. J.178, 175–187.
Murray, K. L., E. R. Britzke, and L. W. Robbins. 2001. Variation in search-phase calls of bats.J. Mammal.82, 728–737. Myers, N., R. A. Mittermeier, C. G. Mittermeier, G. A. Da
Fonseca, and J. Kent. 2000. Biodiversity hotspots for conservation priorities.Nature403, 853–858. Newbold, T., J. P. Scharlemann, S. H. Butchart, Cß. H.
S
ßekercioglu, R. Alkemade, H. Booth, et al. 2013. Ecological traits affect the response of tropical forest bird species to land-use intensity.Proc. Biol. Sci.280, 20122131. Norberg, U. M., and J. M. Rayner. 1987. Ecological
morphology and flight in bats (Mammalia; Chiroptera): wing adaptations, flight performance, foraging strategy and echolocation.Philos. Trans. R. Soc. Lond. B Biol. Sci.316, 335–427.
Obrist, M. K. 1995. Flexible bat echolocation: the influence of individual, habitat and conspecifics on sonar signal design. Behav. Ecol. Sociobiol.36, 207–219.
Pauku, R. L. 2009. Solomon Islands Forestry Outlook Study. Asia-Pacific Forestry Sector Outlook Study. Working Paper No. APFSOS II/WP/2009/31. FAO, Bangkok.
de la Pe~na-Cuellar, E., K. E. Stoner, L. D. Avila-Cabadilla, M. Martınez-Ramos, and A. Estrada. 2012. Phyllostomid bat assemblages in different successional stages of tropical rain forest in Chiapas, Mexico.Biodivers. Conserv.21, 1381–1397. Perfecto, I., and R. Snelling. 1995. Biodiversity and the
transformation of a tropical agroecosystem: ants in coffee plantations.Ecol. Appl.5, 1084–1097.
Perfecto, I., J. Vandermeer, P. Hanson, and V. Cartın. 1997. Arthropod biodiversity loss and the transformation of a tropical agro-ecosystem. Biodivers. Conserv. 6, 935–945.
Phommexay, P., C. Satasook, P. Bates, M. Pearch, and S. Bumrungsri. 2011. The impact of rubber plantations on the diversity and activity of understorey insectivorous bats in southern Thailand.Biodivers. Conserv.20, 1441–1456. Presley, S. J., M. R. Willig, J. M. Wunderle, and L. N.
Saldanha. 2008. Effects of reduced-impact logging and forest physiognomy on bat populations of lowland Amazonian forest.J. Appl. Ecol.45, 14–25.
R Core Team. 2013.R: a language and environment for statistical computing. 3.0.1 ed. R Foundation for Statistical Computing, Vienna, Austria.
Redgwell, R. D., J. M. Szewczak, G. Jones, and S. Parsons. 2009. Classification of echolocation calls from 14 species of bat by support vector machines and ensembles of neural networks.Algorithms2, 907–924.
Russo, D., L. Cistrone, and G. Jones. 2007. Emergence time in forest bats: the influence of canopy closure.Acta Oecol.31, 119–126.
Salda~na-Vazquez, R. A., and M. A. Munguıa-Rosas. 2013. Lunar phobia in bats and its ecological correlates: a meta-analysis.Mamm. Biol.78, 216–219.
Schmitt, C.B., N.D. Burgess, L. Coad, A. Belokurov, C. Besancßon, L. Boisrobert,et al. 2009. Global analysis of the protection status of the world’s forests.Biological
Conservation142, 2122–2130.
Simmons, N. B. 2005. Order chiroptera. Pp. 312–313inD. E. Wilson and D. M. Reeder, eds.Mammal species of the world: a taxonomic and geographic reference. Smithsonian
Institution Press, Washington, DC.
Skalak, S. L., R. E. Sherwin, and R. M. Brigham. 2012. Sampling period, size and duration influence measures of bat species richness from acoustic surveys.Methods Ecol. Evol.3, 490–502.
Warping Kernel. Proceedings of the Seventeenth International Conference on Artificial Intelligence and Statistics, 2014 Reykjavik, Iceland. 913–921.
Threlfall, C., B. Law, T. Penman, and P. B. Banks. 2011. Ecological processes in urban landscapes: mechanisms influencing the distribution and activity of insectivorous bats.Ecography34, 814–826.
Vaughan, T. A. 1970. Flight patterns and aerodynamics. Pp. 195–216inW. A. Wimsatt, ed.Biology of bats 1. Academic Press, New York, USA.
Vleut, I., S. I. Levy-Tacher, J. Galindo-Gonzalez, W. F. de Boer, and N. Ramırez-Marcial. 2012. Tropical rain-forest matrix quality affects bat assemblage structure in secondary forest patches.J. Mammal.93, 1469–1479.
Walsh, A. L., R. M. R. Barclay, and G. F. McCracken. 2004. Designing bat-activity surveys for inventory and
monitoring studies at local and regional scales. Pp. 157– 165 in R.M. Brigham, E.K.V Kalko, G. Jones, S. Parsons and H.J.G.A. Limpens, eds. Bat Echolocation Research: tools, techniques and analysis. Bat Conservation International, Austin, Texas, USA.
Walters, C. L., R. Freeman, A. Collen, C. Dietz, M. Brock Fenton, G. Jones, et al. 2012. A continental-scale tool for acoustic identification of European bats.J. Appl. Ecol.49, 1064–1074.
Watt, A. D., N. E. Stork, P. Eggleton, D. Srivastava, B. Bolton, T. B. Larsen, et al. 1997. Impact of forest loss and
regeneration on insect abundance and diversity. Pp. 273–286 inA. D. Watt, M. Funter and N. E. Stok, eds.Forests and insects. Chapman & Hall, London.
Wickramasinghe, L. P., S. Harris, G. Jones, and N. Vaughan. 2003. Bat activity and species richness on organic and conventional farms: impact of agricultural intensification. vJ. Appl. Ecol.40, 984–993.
Williams-Guillen, K., and I. Perfecto. 2011. Ensemble composition and activity levels of insectivorous bats in response to management intensification in coffee agroforestry systems.PLoS ONE6, e16502.
Wordley, C. F., E. K. Foui, D. Mudappa, M. Sankaran, and J. D. Altringham. 2014. Acoustic identification of bats in the southern Western Ghats, India.Acta Chiropterol.16, 213–222.
Supporting Information
Additional supporting information may be found online in the supporting information tab for this article.
Figure S1.Results of the classification accuracy, including confusion tables for the five fold cross validation and confusion matrix.
Figure S2. Classification thresholds from 40 to 80% and the percentage of calls classified to species level.
Figure S3. Species accumulation curves for each habitat for the identified species only. Sample hours were used as effort and curves were drawn using the vegan package in R (Oksanen et al. 2016).