ISSN Online: 2160-0481 ISSN Print: 2160-0473
DOI: 10.4236/jtts.2019.92015 Apr. 29, 2019 232 Journal of Transportation Technologies
Study on Ground-Penetrating Radar (GPR)
Application in Pavement Deep Distress
Detection
Songtao Li
1,2, Chengchao Guo
1,3*1College of Water Conservancy and Environment, Zhengzhou University, Zhengzhou, China 2Industrial Technology Research Institute, Chongqing University, Chongqing, China 3School of Civil Engineering, Sun Yat-sen University, Guangzhou, China
Abstract
As some deep distresses exist in pavement structures, ground-penetrating ra-dar (GPR) reflected waves will vary at interfaces and defects. Aimed at de-tecting the distresses in terms of position, severity and degree, electromag-netic forward simulations based on 400 MHz and 900 MHz antennas were conducted respectively. The dielectric models concerning homogeneous or coupling distresses of pavements were established, and the effects of various distresses on detection were analyzed through reflected wave images. Relying on GPR tests and field tests, coring and excavation data acquired before reha-bilitation were compared and verified. The calculation results match the field measurement results. Thus, the detection method based on GPR was pro-posed for pavement deep distresses.
Keywords
Pavement, Deep Distress, GPR, Electromagnetic Forward Simulation, Dielectric Model, Detection
1. Introduction
Ground-penetrating radar (GPR) was designed specifically to penetrate the ground surface and inspect the subsurface by locating abnormity. Currently, it was utilized in many fields as a non-destructive detection method [1].
For the evaluation of subgrade soil in road structures, GPR-related methods were adopted to nondestructively identify soil types and estimate the thickness of overburden layer, the compressibility and frost susceptibility of subgrade soil [2]. For pavement structures, GPR was used to measure the thickness of each How to cite this paper: Li, S.T. and Guo,
C.C. (2019) Study on Ground-Penetrating Radar (GPR) Application in Pavement Deep Distress Detection. Journal of Trans-portation Technologies, 9, 232-259. https://doi.org/10.4236/jtts.2019.92015
Received: March 22, 2019 Accepted: April 25, 2019 Published: April 29, 2019
Copyright © 2019 by author(s) and Scientific Research Publishing Inc. This work is licensed under the Creative Commons Attribution International License (CC BY 4.0).
DOI: 10.4236/jtts.2019.92015 233 Journal of Transportation Technologies layer, detect subsurface defects and evaluate the quality of base course [3]. For quality control surveys, thickness measurement could be performed with GPR to estimate air void content of asphalt surface and detect mix segregation [4]. Be-sides, through GPR detection, pavement pumping could be predicted [5]. Based on microwave technology for free space measurement, this paper developed and introduced a GPR mixed model to determine the density of pavement structures [6]. Through observations and modelling, GPR could perform effectively in characterizing and detecting vertical pavement cracks, and a multi-frequency GPR approach to pavement detection was recommended, i.e., 900 MHz for crack characterization and low frequency for crack detection [7]. Through various practices (e.g., laboratory tests, the long-term visual observation, repeated GPR scanning and probed drillings), investigations of pavement transversal cracks with GPR methods were presented [8].
Generally, GPR applications were involved in various related tests and pave-ment structures evaluation, mainly including pavepave-ment quality control, strip-ping detection in bituminous materials, layer thickness determination, position determination of structural variations and voids, evaluation of excess moisture beneath bound layers and the determination of depth and alignment of steel-work [9], etc.
As layered structures, pavements are designed to carry traffic loads. Various defects (e.g., rutting, stripping, cracking and poor bonding) in pavement struc-tures will create changes to GPR images under repeated traffic loads, different temperatures and humidity. According to the above, deep defects in pavement structures can be detected.
In this paper, the numerical simulations and field tests for GPR application in pavement deep distresses detection will be performed. Besides, a case study will be conducted, which may provide a reference for design, construction, main-tenance and rehabilitation of pavements.
2. Numerical Simulation
simu-DOI: 10.4236/jtts.2019.92015 234 Journal of Transportation Technologies lated spectrum, the defect can be detected.
Pavement structures consist of several layers, as shown in Table 1. Regarding various pavement materials, the dielectric permittivity ε, magnetic permeability μ, and electrical conductivity σ present different values. Generally, as pavement materials are non-magnetic, magnetic permeability μ is set as 1. The dielectric permittivity ε and electrical conductivity σ are equivalent in real part and imagi-nary part of dielectric constant in Maxwell equation respectively. Thus, the value of ε and σ can be determined. As asphalt concrete shows similar dielectric prop-erties, the three surface layers can be simplified as a layer. The typical dielectric values for each layer are listed in Table 1. In this model, median value is adopted as the dielectric constant.
The dielectric model of pavement structure layers can be established. Within each layer, there may exist several abnormal zones of different dimensions indi-cating defects respectively. The defects create changes to the values of ε and σ for different pavement structures.
In the simulation, 8 typical road structural diseases were selected as represent-atives. The selected cases may be not quite comprehensive, while it may help re-veal the feasibility of GPR application in pavement deep distress detection. Be-sides, through comparison of the simulation results of 400 MHz and 900 MHz under different cases, the respective advantage of the two antennas could be presented.
2.1. Antenna Simulation of 400 MHz
In some cases, accurate imaging of the target defects may not be obtained through 400 MHz antenna from the surface course. Dead zones will hinder the detection of targets, while high-accuracy detection still cannot be maintained without dead zones in the test structures. Combined with the real pavement structures, the homogeneous dielectric model is set up. The length and depth of 400 MHz (i.e., center frequency) antenna simulation model is 5 m and 2 m re-spectively, and the latter lies in the detection depth range (i.e., 0 - 4 m) of 400 MHz ground-coupled antenna according to the device parameters of selected GPR. Besides, the time window is set as 25 ns. Although some dielectric proper-ties (e.g., dispersion) are not involved in uniform supposition, GPR numerical model can be utilized to reveal the relation between subsurface properties and GPR data. Thus, the related mechanism of GPR detection may be acquired. It can also be analyzed at a fraction of computation with more effective algo-rithms.
DOI: 10.4236/jtts.2019.92015 235 Journal of Transportation Technologies
Table 1. Pavement material and dielectric value.
[image:4.595.210.539.90.272.2]Layer Main Parameters
Table column subhead ε μ σ
1 asphalt concrete (AC-13C) 4 cm fine-grained
4 - 8 1 0.01 - 0.1
2 asphalt concrete (AC-20C) 6 cm medium-grained
3 asphalt concrete (ATB-30) 8 cm coarse-grained
4 40 cm cement stabilized gravel base 8 - 12 1 0 - 1
5 stabilized gravel subbase 15 cm cement 10 - 20 1 0 - 0.2
6 semi-infinite subgrade 10 - 30 1 0 - 0.02
The dielectric model with various simulated defects is established, and the de-fects vary with the type, depth and dimension. The sources are placed before the receiver at a certain spacing. As source waves propagate at a velocity in the pavement structure, the wave will be recorded by receivers.
In practice, pavement performance is undermined mainly due to surface de-fects, and secondary surface may be generated due to deep distresses, e.g., inner undercompacted and void zones. Relying on its distinguished precision, GPR is widely applied in the qualitative detection of various defects. Therefore, in the simulation, it should be investigated whether distresses could be detected and that whose dimension is secondary.
Case 1: The dielectric model of pavement with locally undercompacted sur-face course is shown in Figure 1(a), and several layers are contained in the model, i.e., air layer, surface course, base course, subbase course and subgrade. Three undercompacted zones are presented in surface course with the dimen-sion of 1 cm × 1 cm, 1 cm × 3 cm and 1 cm × 5 cm respectively, and the corres-ponding reflected wave image is illustrated in Figure 1(b).
Case 2: The dielectric model of pavement with voids in the bottom of surface course is shown in Figure 2(a), and the defect dimension was 5 cm × 50 cm. Voids were filled with air, and the corresponding reflected wave is illustrated in Figure 2(b).
Case 3: The dielectric model of pavement with voids in the bottom of surface course is shown in Figure 3(a), and the defect dimension was 5 cm × 50 cm. Voids were filled with water, and the corresponding reflected wave is illustrated in Figure 3(b).
DOI: 10.4236/jtts.2019.92015 236 Journal of Transportation Technologies defects, the reflected waves interfered mutually, and a superposed wave was generated. Moreover, with the larger dimension of models shown in Figure 2 and Figure 3, stronger reflected waves were obtained. As the dielectric constant increased with the presence of moisture, stronger reflected waves appeared, as shown in Figure 3.
(a)
[image:5.595.213.537.164.532.2](b)
Figure 1. (a) Dielectric model of pavement with locally undercompacted surface course; (b) Reflected wave of model 1a.
DOI: 10.4236/jtts.2019.92015 237 Journal of Transportation Technologies (b)
Figure 2. (a) Dielectric model of pavement with voids filled with air in surface course; (b) Reflected wave of model 2a.
(a)
(b)
[image:6.595.212.536.310.692.2]DOI: 10.4236/jtts.2019.92015 238 Journal of Transportation Technologies Case 4: The dielectric model of pavement with locally undercompacted base is shown in Figure 4(a), and the defect dimensions were 1 cm × 1 cm and 1 cm × 10 cm. The corresponding reflected wave is shown in Figure 4(b).
Case 5: The dielectric model of pavement with voids in the base bottom is shown in Figure 5(a), and the defect dimension was 5 cm × 50 cm. Voids were filled with air, and the corresponding reflected wave is illustrated in Figure 5(b).
(a)
[image:7.595.253.493.180.527.2](b)
Figure 4. (a) Dielectric model of pavement with voids filled with water in surface course; (b) Reflected wave of model 4a.
DOI: 10.4236/jtts.2019.92015 239 Journal of Transportation Technologies (b)
Figure 5. (a) Dielectric model of pavement with voids filled with water air in base; (b) Reflected wave of model 5a.
Case 6: The dielectric model of pavement with voids in the base bottom is shown in Figure 6(a), and the dimension of defect was 5 cm × 50 cm. Voids were filled with water, and the corresponding reflected wave is illustrated in Figure 6(b).
It can be seen from Figures 4-6 that reflected images varied with the width and length of voids or undercompacted zones in base. The scope and area could be quantitatively identified based on the images approximately. The reflected waves varied from weak to strong as the voids became filled with water instead of air, and the intensity of reflected waves induced by undercompacted zones lay between that of the two cases. If two defects were at a certain spacing, reflected maps could not interfere mutually, e.g., Case 4.
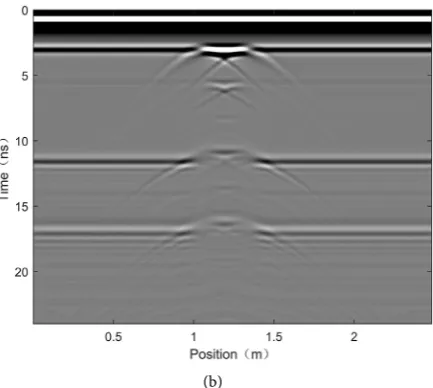
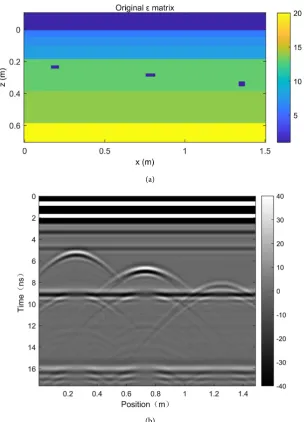
Case 7: The dielectric model of pavement with locally undercompacted sub-base is shown in Figure 7(a), and the defect dimensions were 1 cm × 1 cm, 1 cm × 3 cm and 1 cm × 3 cm respectively at different positions. The corresponding reflected image is shown in Figure 7(b). With regard to Figure 7, it is supposed that three defects were located in subbase course, and three abnormal reflections could be identified at corresponding positions.
Case 8: The coupled dielectric model of pavement with coupled voids in sur-face course and base bottom. The voids were filled with air and water respec-tively, as shown in Figure 8(a), and the void dimension was 5 cm × 50 cm. The corresponding reflected wave is shown in Figure 8(b). The different positions cannot be identified by abnormal reflection, while the coupled distresses could be revealed through the image. Besides, the defect property could also be inves-tigated by reflection intensity briefly.
DOI: 10.4236/jtts.2019.92015 240 Journal of Transportation Technologies or be coupled, while the defect still could be identified through the abnormal re-flected wave images. The strongest parts of reflection waves existed in the central position of defects, which could be recognized from the forward simulation im-ages.
(a)
[image:9.595.211.535.147.533.2](b)
Figure 6. (a) Dielectric model of pavement with voids filled with water air in base; (b) Reflected wave of model 6a.
DOI: 10.4236/jtts.2019.92015 241 Journal of Transportation Technologies (b)
Figure 7. (a) Dielectric model of pavement with locally undercompacted subbase; (b) Re-flected wave of model 7a.
(a)
(b)
[image:10.595.245.503.328.685.2]DOI: 10.4236/jtts.2019.92015 242 Journal of Transportation Technologies
2.2. Antenna Simulation of 900 MHz
Based on real pavement structures, the electromagnetic wave dielectric model is set up. Within the layers, one or several anomalous blocks of defect were created with different dimensions respectively. Similar with antenna simulation of 400 MHz, the length and depth of 900 MHz (i.e., center frequency) antenna simula-tion model are 1.4 m and 0.75 m. The latter lies in the detecsimula-tion depth range (i.e., 0 - 1 m) of 900 MHz ground-coupled antenna according to the device pa-rameters of selected GPR, and the time window is set as 15 ns.
In the model, an air-surface interface is fixed at z=0, which is achieved by simply adding a 25 cm thick air layer with ε =1 and σ =0 to the grid. Sources and receivers are placed along the air-surface interface every 0.05 m for reflection investigation. The Blackman-Harris source pulses possess a dominant frequency of 900 MHz. As to the pulse and dielectric properties in the pavement model, the spatial and time steps are set as 0.005 m and 0.01 ns, respectively.
Similar with 400 MHz antenna simulation, the model is established, and source waves propagate in pavement structures and then will be recorded by re-ceivers.
Case 1: The dielectric model of pavement with locally undercompacted zones in the surface course top is shown in Figure 9(a). Two undercompacted zones were contained with the dimension of 1 cm × 1 cm and 1 cm × 3 cm respective-ly, and the corresponding reflected wave image is shown in Figure 9(b). With the same defect dimension, the range of the reflected wave was larger than that of 400 MHz. Thus, based on 900 MHz antenna, the detection with higher accu-racy could be obtained, i.e., smaller defects could also be identified generally.
Case 2: The dielectric model of pavement with locally undercompacted zones in the intermediate surface course is shown in Figure 10(a). The two small un-dercompacted zones were contained with the dimension of 0.5 cm × 10 cm and 0.25 cm × 5 cm respectively. The corresponding reflected wave image is shown in Figure 10(b). Although the target defects became smaller, they still could be detected through the reflected wave image with higher frequency propagation.
Case 3: The dielectric model of pavement with locally undercompacted zones in the surface course bottom is shown in Figure 11(a). Two undercompacted zones existed with the dimension of 0.5 cm × 5 cm and 0.25 cm × 10 cm respec-tively, and the corresponding reflected wave image is shown in Figure 11(b). Defects position and the dimension (i.e., width and length) of the model in the Case 3 varied compared with that Case 2, while the simulation images were sim-ilar acquired in Case 2 and 3.
Case 4: The dielectric model of pavement with locally undercompacted zones in the base top is shown in Figure 12(a). Three abnormal zones were contained with the dimension of 0.5 cm × 3 cm, 0.5 cm × 5 cm and 1 cm × 1 cm respec-tively, and the corresponding reflected wave image is shown in Figure 12(b).
ex-DOI: 10.4236/jtts.2019.92015 243 Journal of Transportation Technologies isted with the dimension of 0.25 cm × 3 cm and 1 cm × 1 cm respectively, and the corresponding reflected wave image is shown in Figure 13(b).
It is shown that the detection depth of 900 MHz decreased, while the detection accuracy increased, higher than that of 400 MHz. Therefore, the target defects contained in deeper layers, could also be identified through reflected wave im-ages, e.g., Figure 12(b) and Figure 13(b).
(a)
[image:12.595.255.494.176.531.2](b)
Figure 9. (a) Dielectric model of pavement with undercompacted surface top; (b) Re-flected wave of model 9a.
DOI: 10.4236/jtts.2019.92015 244 Journal of Transportation Technologies (b)
Figure 10. (a) Dielectric model of pavement with undercompacted intermediate surface; (b) Reflected wave of model 10a.
(a)
(b)
[image:13.595.248.500.326.685.2]DOI: 10.4236/jtts.2019.92015 245 Journal of Transportation Technologies (a)
[image:14.595.222.527.71.494.2](b)
Figure 12. (a) Dielectric model of pavement with undercompacted base top; (b) Reflected wave of model 12a.
DOI: 10.4236/jtts.2019.92015 246 Journal of Transportation Technologies (b)
Figure 13. (a) Dielectric model of pavement with undercompacted base bottom; (b) Re-flected wave of model 13a.
Case 6: The dielectric model of pavement with poor bonding between base and surface course is shown in Figure 14(a). One distress was contained in the model with the dimension of 1 cm × 15 cm, and the corresponding reflected wave image is shown in Figure 14(b).
Case 7: The dielectric model of pavement with poor bonding between base and subbase is shown in Figure 15(a). One distress existed with the dimension of 0.5 cm × 15 cm, and the corresponding reflected image is shown in wave Fig-ure 15(b).
Case 8: The dielectric model of pavement with poor bonding between subbase and subgrade is shown in Figure 16(a). One distress existed with the dimension of 0.25 cm × 15 cm, and the corresponding reflected wave image is shown in Figure 16(b).
As can be seen from Case 6 - Case 8, the set bonding conditions got weaker from the top to the bottom of pavement structures, while the defects still could generally be revealed through the simulation wave images.
Case 9: The dielectric model of pavement with a crack in surface course is shown in Figure 17(a). One distress (i.e., a vertical crack) existed with the di-mension of 15 cm × 1 cm. The corresponding reflected wave is shown in Figure 17(b), and it indicates that the vertical crack could also be identified through the reflected wave image.
DOI: 10.4236/jtts.2019.92015 247 Journal of Transportation Technologies (a)
[image:16.595.221.529.74.492.2](b)
Figure 14. (a) Dielectric model of pavement with poor surface-base bonding; (b) Re-flected wave of model 14a.
DOI: 10.4236/jtts.2019.92015 248 Journal of Transportation Technologies (b)
Figure 15. (a) Dielectric model of pavement with poor bonding between base and sub-base; (b) Reflected wave of model 15a.
(a)
(b)
[image:17.595.234.515.318.689.2]DOI: 10.4236/jtts.2019.92015 249 Journal of Transportation Technologies (a)
[image:18.595.247.501.72.447.2](b)
Figure 17. (a) Dielectric model of pavement with crack in surface course; (b) Reflected wave of model 17a.
3. Field Tests
An expressway extends from Airport to Heao in Shenzhen. When it is subjected to a period of traffic loads, some defects appear on the surface, e.g., settlement, rutting and cracks. The pavement performance will be impaired, endangering traffic safety. Thus, the surveying line is arranged in the left and right wheel path respectively at each lane, and the GPR method is used to detect internal defects in subgrade and other pavement structures.
DOI: 10.4236/jtts.2019.92015 250 Journal of Transportation Technologies The collected signals were gained and filtered, and background noise could be subtracted. Therefore, GPR data interpretation and visualization software for pavements was introduced to detect layer interfaces and abnormal zones, and transform the time scale of acquired GPR data into depth scale.
The normal output was a 2-D GPR image with horizontal and vertical axes representing distance and time respectively. The image contained all acquired traces plotted at the appropriate position. Through the comparison, test results got good agreement with core sampling results, and it was revealed that the test and detection method could be utilized to investigate pavement deep distresses.
[image:19.595.209.538.370.705.2]The GPR image, pavement surface before coring and coring sample near K2876 + 082 (i.e., test point) are shown in Figure 18. The pavement surface was in a relatively good condition except a small transverse crack. It can be seen from the GPR image that the surface course was nearly integrated from +076 to +090, while the bond between surface course and base was poor. Besides, moist and loose zones were also identified in the subgrade. At +078, a crack ran the length of the base. The coring samples from various layers (i.e., the relatively integrated surface course, base with cracks, and loose zones between surface course and base) got good agreement with the acquired results from GPR images.
DOI: 10.4236/jtts.2019.92015 251 Journal of Transportation Technologies Similarly, another test at K2878 + 010 was performed, as shown in Figure 19. The pavement surface course contained no distresses before coring, while, it can be seen from the GPR image that the surface course was partly integrated from +003 to +018. Besides, the bond between surface course and base was poor, and the loose zones were generated in the base and subbase. Particularly, both moist and loose zones existed in the subgrade. The coring samples from various layers (i.e., the partly integrated surface course, the loose and poor bonding base) got good agreement with the acquired results from GPR images.
DOI: 10.4236/jtts.2019.92015 252 Journal of Transportation Technologies
Figure 19. GPR image and coring sample at K2878 + 010 of downward carriageway.
Table 2. Pavement material and composition.
Layer Table Column Head
1 3 cm fine-grained asphalt concrete (AC-13C)
2 5 cm medium-grained asphalt concrete (AC-20C)
3 0.5 cm slurry seal
4 17 cm lime stabilized soil gravel base
5 35 cm 12% lime stabilized soil subbase
6 semi-infinite subgrade
The surface course in the left side of left lane was severely damaged and frag-mented, whose GPR images and coring samples are shown in Figure 20. It can be seen from the GPR image that the lime stabilized soil gravel base was loose and undercompacted, and some interlayers were also contained. The core sam-pling demonstrated that the thickness of surface course was insufficient, and some defects existed in the base. Although the surface course got destructed, the actual distress lay in the deep base.
[image:21.595.211.538.328.468.2]DOI: 10.4236/jtts.2019.92015 253 Journal of Transportation Technologies
Figure 20. GPR image and coring sample at K1 + 062 in the left side of left lane.
[image:22.595.289.458.424.707.2]DOI: 10.4236/jtts.2019.92015 254 Journal of Transportation Technologies
4. Case Study
The GPR images at K2900 + 600 - K2900 + 615 of upward carriageway in Shenzhen Expressway from airport to Heao are presented in Figure 22. From K2900 + 603 to K2900 + 615 at the depth range of 0.18 - 0.22 m, 0.45 - 0.6 m and 0.60 - 0.85 m, the abnormal zones were illustrated in Figure 22. Furthermore, some defects were determined lying in the base and subbase, and photos of the corresponding layers with defects are shown in Figure 23 and Figure 24.
Some defects (e.g., longitudinal cracks, transverse cracks, block, loose zones, and local infiltration) could be seen from Figure 23. The loose zones and local infiltration could be found in Figure 24. Therefore, the deep defects in base and subbase could be identified by GPR quite probably.
The GPR image at K2902 + 980 - K2903 + 000 of upward carriageway in Shenzhen expressway from airport to Heao is shown in Figure 25. From K2902 + 985 to K2902 + 999 at the depth range of 0.18 - 0.23 m, 0.4 - 0.6 m and 0.60 - 0.75 m. Some abnormal sections are presented in Figure 25. Some defects were determined lying in the base and subbase, and photos of the corresponding lay-ers with defects are shown in Figure 26 and Figure 27.
Some defects (e.g., longitudinal cracks, transverse cracks, block, loose zones, and local infiltration) could be seen from Figure 26. The loose zones and local infiltration could be found in Figure 27. Therefore, the deep defects in base and subbase could be identified by GPR quite probably.
DOI: 10.4236/jtts.2019.92015 255 Journal of Transportation Technologies
Figure 22. GPR image at K2900 + 600 - K2900 + 615 of upward carriageway.
[image:24.595.278.472.248.544.2]DOI: 10.4236/jtts.2019.92015 256 Journal of Transportation Technologies
Figure 24. Photo of top subbase at K2900 + 605 - K2900 + 610.
[image:25.595.243.506.259.703.2]DOI: 10.4236/jtts.2019.92015 257 Journal of Transportation Technologies
Figure 26. Photo of top base at K2900 + 605 - K2900 + 610.
[image:26.595.278.470.406.705.2]DOI: 10.4236/jtts.2019.92015 258 Journal of Transportation Technologies
Table 3. GPR test results about Shenzhen Expressway.
Position position Staring position Ending Distress Comment
K2866 + 000 - K2866 + 100 82 102 Loose in bass
K2866 + 100 - K2866 + 200 54 68 Uncompacted in base
K2866 + 200 - K2866 + 300 84 112 Uncompacted in base
K2866 + 300 - K2866 + 400 7 11 Loose in bass
22 29 Loose in subbase
36 48 Loose in bass pipeline
84 98 Loose in bass
K2866 + 400 - K2866 + 500 0 16 Loose in subbase
22 34 Uncompacted in subbase
38 44 Loose in bass
56 64 Uncompacted in base
K2866 + 500 - K2866 + 600 0 7 Loose in bass
20 26 Loose in bass
40 65 Uncompacted in subbase
K2866 + 600 - K2866 + 700 21 30 Loose in bass
36 46 Loose in bass
74 86 Uncompacted in base
93 100 Loose in bass
K2866 + 700 - K2866 + 800 20 42 Loose in bass
64 85 Uncompacted in base pipeline
K2866 + 800 - K2866 + 900 52 76 Loose in bass patch
K2866 + 900 - K2867 + 000 27 36 Loose in subbase
5. Conclusions
Within various layers, one or several abnormal zones with different dimensions represented defects respectively. The defects induced different values of ε and σ in the corresponding pavement structures. Dielectric models of pavement struc-ture layers were established.
The application of nondestructive GPR detection has become an integral part in the structural evaluation and rehabilitation process of pavements in recent years. As some deep distresses exist in pavement structures, GPR reflected waves varied at interfaces and the zones with defects.
In practice, GPR detection depth got smaller through the theoretical simula-tion, while pavement structures could be penetrated by 900 MHz or 400 MHz antenna. Thus, the deep distress could be identified from the reflected wave im-ages quite probably.
DOI: 10.4236/jtts.2019.92015 259 Journal of Transportation Technologies disease in pavement structures. Generally, 400 MHz antenna was mainly used to investigate the infrastructure, e.g., base and subgrade, while 900 MHz antenna was mainly employed to detect base and subbase.
Based on different situations, the appropriate antenna and time window were set to guarantee detection depth and accuracy. In pavement deep distress detec-tion, the 400 and 900 MHz antennas were applicable, except focusing on differ-ent structural layers.
Conflicts of Interest
The authors declare no conflicts of interest regarding the publication of this pa-per.
References
[1] Lahouar, S. and Al-Qadi, I.L. (2008) Automatic Detection of Multiple Pavement Layers from GPR Data. NDT&E International, 41, 69-81.
https://doi.org/10.1016/j.ndteint.2007.09.001
[2] Guo, C.-C. and Wang, F.-M. (2008) Study on Forward Modeling of GPR Electro-magnetic Wave Propagation. Journal of Highway and Transportation Research and Development, 25, 37-41. (In Chinese)
[3] Parrilla, D.V. (2006) GPR for Road Monitoring and Damage Detection: The Layer-Stripping Algorithm. Master Thesis, Università degli studi Roma Tre, Roma. [4] Saarenketo, T. and Scullion, T. (2000) Road Evaluation with Ground Penetrating
Radar. Journal of Applied Geophysics, 43, 119-138.
https://doi.org/10.1016/S0926-9851(99)00052-X
[5] Tosti, F. and Benedetto, A. (2012) Pavement Pumping Prediction Using Ground Penetrating Radar. Procedia—Social and Behavioral Sciences, 53, 1045-1054.
https://doi.org/10.1016/j.sbspro.2012.09.954
[6] Mardeni, R., Raja Abdullah, R.S.A. and Shafri, H.Z.M. (2010) Road Pavement Den-sity Analysis Using a New Non-Destructive Ground Penetrating Radar System. Progress in Electromagnetics Research B, 21, 399-417.
[7] Diamanti, N. and Redman, D. (2012) Field Observations and Numerical Models of GPR Response from Vertical Pavement Cracks. Journal of Applied Geophysics, 81, 106-116.https://doi.org/10.1016/j.jappgeo.2011.09.006
[8] Krysiński, L. and Sudyka, J. (2013) GPR Abilities in Investigation of the Pavement Transversal Cracks. Journal of Applied Geophysics, 97, 27-36.
https://doi.org/10.1016/j.jappgeo.2013.03.010
[9] Evans, R. (2008) A Review of Pavement Assessment Using Ground Penetrating Ra-dar (GPR). 12th International Conference on Ground Penetrating Radar, Birming-ham, 16-19 June 2008.
[10] Irving, J. and Knight, R. (2006) Numerical Modeling of Ground-Penetrating Radar in 2-D Using MATLAB. Computers & Geosciences, 32, 1247-1258.