©2017 The Authors.Marine Mammal Sciencepublished by Wiley Periodicals, Inc. on behalf of Society for Marine Mammalogy
This is an open access article under the terms of the Creative Commons Attribution License, which permits use, distribution and reproduction in any medium, provided the original work is properly cited.
DOI: 10.1111/mms.12461
Sex-related differences in the postmolt distribution of
Weddell seals (
Leptonychotes weddellii
) in the southern
Weddell Sea
IZZYLANGLEYandMIKEFEDAK,Sea Mammal Research Unit, Scottish Oceans Institute, University of St Andrews, St Andrews, Fife KY16 8LB, United Kingdom;KEITHNICHOLLS, British Antarctic Survey, Natural Environment Research Council, Cambridge CB3 0ET, Uni-ted Kingdom; LARS BOEHME,1
Sea Mammal Research Unit, Scottish Oceans Institute, University of St Andrews, St Andrews, Fife KY16 8LB, United Kingdom.
Abstract
The population of Weddell seals (Leptonychotes weddellii) in the southern Weddell Sea is in a unique position on the continental shelf edge, with vast shelf waters to the south, and deep Southern Ocean to the north. We describe sex-related differences in the winter distribution of this population, from data collected by 20 conductiv-ity-temperature-depth satellite relay data loggers deployed in February 2011 at the end of the annual molt. The regional daily speed was calculated, and a state-space model was used to estimate behavioral states to positions along individuals’ tracks. GLMMs estimated that males and smaller individuals, diving in shallower water, traveled less far per day of deployment (males 14.62.26 km/d, females 18.9 2.42 km/d), and males were estimated to dive in shallower water (males 604382 m, females 1,8751,458 m). Males and smaller individuals were also estimated to be more resident; males spent an average 83.4%7.7% of their time in a resident behavioral state, compared to females at 74.1%7.1%. This evidence that male and female Weddell seals in the southern Weddell Sea are adopting different strate-gies has not been shown elsewhere along their circumpolar distribution.
Key words: Weddell seal,Leptonychotes weddellii, postmolt distribution, sex-related differences, CTD-SRDL, state-space model, resident state, Weddell Sea.
The distribution of predators within the Southern Ocean is driven by the availabil-ity of resources important for growth, reproduction and survivorship (Stephens and Krebs 1986). This relationship between resources and life-history traits can help us understand how vulnerable species are to accelerated ecosystem changes (Santora 2014). Sexual size dimorphism has been shown to increase intersexual competition, and is thought to drive sexual differences in distribution (Becket al. 2003, Cullen et al.2014).
1Corresponding author (e-mail: lb284@st-andrews.ac.uk).
In the Southern Ocean, sexual differences have been described in the southern ele-phant seal (Mirounga leonina; McConnell and Fedak 1996) and the Antarctic fur seal (Arctocephalus gazella; Staniland and Robinson 2008). Both of these species display dramatic sexual size dimorphism, with males weighing almost three times as much as females (Ruckstuhl and Neuhaus 2002, Staniland 2005). Female southern elephant seals at Macquarie Island perform mainly pelagic dives, whereas males perform both pelagic and benthic dives (Hindellet al. 1991). In the Kerguelen Islands, females concentrate foraging activity in shallower shelf waters, whereas males use the shelf to benefit from the upwelling of nutrient rich water, concentrating prey (Labrousseet al. 2015). Antarctic fur seals show significant spatial segregation between the sexes, with males foraging in shallower shelf waters close to breeding beaches and females rang-ing further, foragrang-ing near the surface in deeper waters off the shelf (Staniland and Robinson 2008).
The Weddell seal (Leptonychotes weddellii) is not dramatically sexually dimorphic, with some studies finding no difference in size at all (Staniland 2005) and others find-ing females to be slightly larger (Brydenet al. 1984). Despite their circumpolar dis-tribution, previous studies have focused on populations in both McMurdo Sound and towards the east of Antarctica (Kooyman 1967, Andrews-Goffet al. 2010, Heerah et al. 2013). It has been shown that the species is resident, and remains within conti-nental shelf waters in depths of up to 500 m (Stirling 1969, fig. 1 from Lakeet al. 2006, fig. 1 from Bestleyet al. 2015). They forage in shallow waters associated with relatively smooth bathymetry, which is thought to facilitate prey accessibility (Heerahet al. 2013, 2017). However, they have also recently been recorded to dive up to 1,000 m at Davis, in East Antarctica (Heerahet al. 2017).
The population of Weddell seals in the southern Weddell Sea is unique in its prox-imity to the continental shelf edge, with water depths ranging from 500 m to
>4,000 m off the continental shelf (Schenkeet al. 1997). The seals have almost
com-plete ice cover during winter, and are able to maintain breathing holes in the ice with their teeth (Costa and Crocker 1996). Due to the remote location and inaccessibility of the southern Weddell Sea, there is little known of how this population of Weddell seals exploits their unique environment during the austral winter.
The study of the at-sea distribution of marine predators has widened with the development of animal-attached tags (see Carteret al. 2016 for a critical review in pinnipeds). Satellite relay data loggers report information collected by on-board sen-sors,viathe Argos satellite system, enabling us to collect data from previously inac-cessible environments (Boehmeet al. 2009). This study attached tags to adult males and females, which collected data on movement patterns, dive behavior, and environ-mental conditions. This positional data obtained is inherently spatial and temporally autocorrelated (Zuur et al. 2009). State-space modeling uses statistical inference to link the vertical and horizontal dimensions of movement through space (Breedet al. 2013). This results in a time series of data that uses its spatial and temporal autocor-relation to predict future behavioral states (Pattersonet al. 2008).
Hypotheses
constraint, and with the added energetic requirement of pregnancy, we expected female distribution to have more individual variation (Sheroet al. 2015) and exploit the range of different habitats available to them in the southern Weddell Sea. We expected there to be a linear relationship between regional daily speed and size, with larger animals having greater metabolic requirements to meet and so traveling fur-ther than smaller animals (Staniland 2005).
Materials and Methods
Data Collection
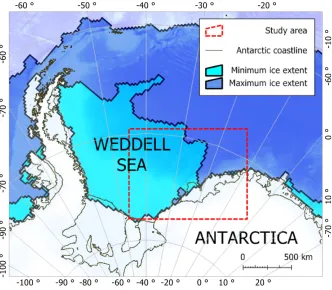
[image:3.486.83.415.261.551.2]Conductivity-temperature-depth satellite relay data loggers (CTD-SRDLs) were deployed in February 2011 on 20 Weddell seals from a population in the southern Weddell Sea (75°S, 45°W; Fig. 1a). The seals were sedated by intramuscular injec-tion of 0.2–0.4 mg/kg tiletamine/zolasepam (Zoletil 100; Virbac, Peakhurst, NSW, Australia) (Bakeret al. 1990) and CTD-SRDLs were glued to the fur on the back of
Figure 1a. Study area showing postmolt range of Weddell seals tagged with CTD-SRDLs
the head using fast-setting epoxy resin (Fedak et al. 1983). The CTD sensors were constructed by Valeport Ltd. (Totnes, Devon, U.K.) and the SRDLs were designed and manufactured at the Sea Mammal Research Unit (Boehmeet al. 2009).
Data Format
During tag deployment, the sex of each seal was determined and for 16 individ-uals, straight length (nose to tip of tail), and axial girth measurements were taken. The data successfully recorded, relayed, and postprocessed by the Argos satellite system included individual seal ID, time-stamped latitude and longitude estimates, and dive parameters including duration and maximum depth. Each pair of coordi-nates estimated by Argos (based on the WGS84 system) was assigned a location quality based on the estimated error. The authors received the data after these esti-mated Argos locations were interpolated in space, a speed filter of 2 m/s was applied (McConnellet al. 1992) and dive positions were extracted from the corre-sponding timestamp.
[image:4.486.75.406.56.342.2]The beginning of a dive was recorded when the tag’s wet/dry sensor was wet and the CTD sensor recorded the seal at a depth below 6 m for more than 8 s (Nordøy
Figure 1b. Four regions categorized by chart contours and bathymetry. Region A is south
and Blix 2009). The end of a dive was recorded when the CTD sensor recorded the seal at a depth above this 6 m threshold.
Bathymetry data were extracted from the ETOPO1 1 Arc-Minute Global Relief Model (Amante and Eakins 2009). The bathymetry data associated with each dive position were linearly interpolated in space from the ETOPO1 data set.
Bathymetry data were used in conjunction with latitude, via chart contours (Schenkeet al. 1997), to classify the position of the Antarctic continental shelf and to categorize four geographic regions (Fig 1b). All positions south of 74°20’S were cate-gorized as shelf water, with a water depth<600 m described as shallow shelf water (region A) and a water depth≥600 m described as the Filchner Trough (77°S, 36°W; region B). Positions north of 74°400S with a water depth<2,000 m were described as the edge of the continental shelf (region C), and positions with a water depth≥2,000 m were described as deep water off the shelf (region D).
Data Filtering
Of the 20 seals tagged, data from four seals were excluded from the analysis due to tag failure after<100 d (seals 1, 9, 17, and 18 in Table 1). An additional three seals were excluded from statistical modeling due to the absence of length and axial girth data (seals 2, 4, and 5 in Table 1).
A further 4,663 dives (19%) were filtered out of the data set before analysis. These included 3,981 dives (16%) with dive duration data=0 s, 673 dives (3%) with maxi-mum dive depth data <6 m, 7 dives (<1%) with maximum dive depth data = 2,148.8 m, and 2 dives (<1%) with no location estimate data.
The data set also included 1,542 dives (6%) where maximum dive depth exceeded the interpolated bathymetry. Due to the remoteness of the study area, bathymetry data are low resolution and are extrapolated across a wide area (Amante and Eakins 2009). Therefore, where dive depth data exceeded the bathymetry, the bathymetry data were adjusted to meet the higher resolution dive data (Padmanet al. 2010). Of these dives, 94% exceeded the bathymetry by<200 m.
Data Analysis
The overall distance traveled by each individual, and the maximum distance trav-elled from first location were calculated using the R packagesp(R Development Core Team 2008, function spDistsN1). The track length was divided by the length of deployment for each individual to get the overall distance traveled per day of deploy-ment, termedoverall daily speed.
Individual seals’ tracks were split into trips, where each trip was made up of con-secutive dives within each region. For each region the distance travelled and the time between the first and last dive of each trip were summed to give regional distance traveled and regional deployment length. These were then used, as above, to calculate regional daily speed.
wasdirected, describing more linear travel at higher speeds. The proportion of dives each individual seal spent in the resident state was termed theoverall resident time (Bestleyet al. 2015). The proportion of dives each individual spent in a resident state in each region was termedregional resident time.
Length (L) and axial girth (G) were available for 13 individuals (8 females, 5 males) and were used to calculate a fatness index ([G/L]; Stirling 1971, Satoet al. 2002). All three variables together are hereafter referred to as size. Sex and size were tested for collinearity using the point-biserial correlation test within the R package ltm (R Development Core Team 2008, functionbiserial.cor).
Three generalized linear mixed-effects models (GLMMs) with Gaussian distribu-tions and identity link funcdistribu-tions used the subsetted data set (n=13). We tested the effects of sex, mean bathymetry, and size on regional daily speed and regional resident time, and the effect of sex and size on bathymetry at dive positions. Individual and region were included as random effects.
Three models were built for each response variable, to test for the difference between length, girth, and fatness index (see Appendix S1 for this analysis). The min-imum adequate model was chosen using second order Akaike’s information criterion, AICc (with theDAICc threshold set to≥2) and the likelihood ratio test (LRT) com-pared the likelihood between each pair of candidate models. Models were evaluated by plotting the residuals to check for normality and homoscedasticity. Conditional R-squared (cR2) values were then calculated using the R packageMuMIn(R Develop-ment Core Team 2008, functionr.squaredGLMM) to assess how much of the variabil-ity was explained by the model.
Results
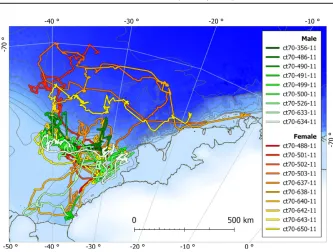
Details of tag deployment are summarized in Table 1. Of the 16 tags with a deployment >100 d, the average length of deployment was 141 10 d (mean standard deviation) and the average distance traveled was 2,363507 km (Fig. 2). The seals therefore traveled an average of 16.7 km/d.
For 16 individuals, with an equal sex ratio, 18,039 dives were successfully relayed viathe Argos satellite system. Out of 8,641 dives from males, 43.5% were made in region A, 23.0% in region B, 30.9% in region C, and 2.78% in region D. Out of 9,398 dives from females, 26.0% were in region A, 10.1% in region B, 18.0% in region C, and 45.9% in region D. The comparison of overall daily speed, bathymetry at dive positions and overall resident time between the sexes is summarized in Table 2.
The point-biserial correlation test scored length and sex 0.16, girth and sex 0.18, and fatness index and sex 0.05. As fatness index was the least correlated with sex, it was used as the size component within the GLMMs.
Regional Daily Speed
The modelm01estimated the adjustment from males to females to be–11.2 (SE= 2.98). This negative slope means that the model predicted that males had a smaller regional daily speed than females. The estimate for mean bathymetry was –0.37 (SE=0.14) and for fatness index was–99.9 (SE=45.9) so the model also predicted that as both bathymetry and fatness index increased, the regional daily speed decreased.
[image:8.486.74.407.55.307.2]The individual variance (4.632.15) and the region variance (00) within the model were less than the residual variance (62.47.9) implying there could be ran-dom variation, or variation explained by variables not included in this model.
Table 2. Male and female mean and standard deviation (SD) for overall daily speed,
maxi-mum distance from first location, bathymetry at dive positions, and overall resident time. Male and female samples had an equal sex ratio of eight individuals each.
Response Sex Mean SD
Overall daily speed Male 14.6 km/d 2.26 km/d
Female 18.9 km/d 2.42 km/d
Bathymetry at dive positions Male 604m 382m
Female 1,875m 1,458m
Overall resident time Male 83.4% 7.7%
[image:8.486.74.408.411.494.2]Female 74.1% 7.1%
Figure 2. Weddell seal tracks created by interpolating estimated dive positions in time.
Bathymetry at Dive Positions
The four regions categorized in this study had a depth range from 8 m in the shal-low water on the shelf, to depths up to 4,426 m in the deep water off the continental shelf. The minimum adequate model with bathymetry at dive positions included sex as a fixed effect, and individual and region as random effects (m06; Table 3, 4). This model explained 94% of the variability within the data.
The model predicted that dive positions of male seals were associated with shal-lower bathymetry than those of female seals (estimate –2.28, SE = 0.86; Fig. 4). Regional variance had a large effect (109.610.5), and to a lesser extent, residual variance was greater than individual variance.
Regional Resident Time
Overall, the seals in this study spent an average of 78.8%8.6% of their time in a resident behavioral state. The minimum adequate model with regional resident time included sex and fatness index as fixed effects, and individual and region as ran-dom effects (m09;Table 3, 4). This model explained 42% of the variability within the data.
[image:9.486.82.414.50.318.2]The modelm09estimated the adjustment from males to females to be+15.3 (SE= 5.75), and so predicted that males spent more of their time in a resident behavioral state per region than females (Fig. 5). The residual deviance was larger than both
Figure 3. Daily speed (distance traveled in km/deployment length in days) for five male
individual and region variance, implying there could be random variation, or varia-tion explained by variables not included in this model.
Discussion
[image:10.486.73.408.119.294.2]Our findings suggest that males and females adopt different strategies postmolt. When accounting for repeated measures in individual and region, sex differences were observed in the distance traveled per day of deployment for each region (regional daily speed), the bathymetry at dive positions, and the time spent in a resident
Table 3. Model selection for generalized linear mixed-effects models (GLMMs) with
Gaus-sian distribution and identity link function. Second order Akaike’s information criterion (AICc) and conditionalR-squared (cR2) are reported. Models are ordered by the lowestDAIC and the minimum adequate model is highlighted inbold.
Response
variable Model Fixed effects Random effects AICc DAICc cR2 Regional
daily speed
m01 Sex + bathymetry + fatness index
Individual + region 305.9 0 0.39
m03 Sex+bathymetry Individual+region 307.0 1.1 0.41 m02 Sex+fatness index Individual+region 307.8 1.9 0.42 m04 Bathymetry+fatness index Individual+region 312.6 6.7 0.43 Bathymetry
at dive positions
m06 Sex Individual + region 225.9 0 0.94 m05 Sex+fatness index Individual+region 228.6 2.7 0.94 m07 (Intercept) Individual+region 229.4 3.5 0.94 Regional
resident time
m09 Sex + fatness index Individual + region 379.7 0 0.42 m08 Sex+bathymetry+fatness
index
Individual+region 380.3 0.6 0.36
m11 Fatness index Individual+region 382.7 3 0.23
m10 Sex Individual+region 388.5 8.8 0.08
Table 4. Likelihood Ratio Test (LRT) results for pairs of candidate models, outlined in
Table 3. The Chi-squared statistic (v2), degrees of freedom, and P-value (a < 0.05) are reported, along with the best model from each test.
Candidate
model pair v2 df P Best model
m01, m02 4.7536 1 0.02924 m01
m01, m03 9.0603 2 0.01078
m01, m04 9.61 1 0.001935
m05, m06 0.011 1 0.9163 m06
m06, m07 6.1278 1 0.01331
m08, m09 2.2653 1 0.1323 m09
m09, m10 11.624 1 0.000651
[image:10.486.75.408.367.492.2]behavioral state. We also found a negative relationship between regional daily speed and both bathymetry and individual size (fatness index) and a positive relationship between regional resident time and size.
Four tagged seals were removed from analysis due to deployment of <100 d. These short deployments were most likely due to technical faults, but tags can also fail due to seal mortality, battery exhaustion, or tag loss (Andrews-Goff et al. 2010). For 16 tags with a mean deployment length of 141 d, the mean track length was 2,363 m.
Regional Daily Speed
[image:11.486.82.415.52.317.2]The seals overall traveled an average 16.7 km/d which was remarkably similar to the 17.6 km/d seals traveled from the population in Prydz Bay (Bestley et al. 2015). However, males in the Weddell Sea traveled less far per day in all regions except region C (Fig. 3). A study by McIntyre et al. (2013) tagged four adult Weddell seals with an equal sex ratio and found no sex effect for the maximum distance traveled from the location that they had been tagged. All adult seals tagged within Queen Maud Land remained with 15 km of the tagging location. Lake et al. (2006) estimated home ranges of female Weddell seals from the Vest-fold Hills population in East Antarctica using kernel density analysis and calcu-lated individuals ranged from 14 km2to 300 km2. In our study, females exhibited
Figure 4. Bathymetry in meters associated with each estimated dive position for 9 males
considerable individual variation in daily speed. Nevertheless, when individual variation was accounted for in a GLMM, sex remained a significant factor related to daily speed.
Figure 2 shows that this trend could be driven by three females. There was an additional female showing a similar pattern that was not included in the model due to the unavailability of size data. We believe that regional daily speed, and the distribution of female Weddell seals, could be driven by their role in repro-duction (Becket al. 2013). Pregnant females have higher energetic demands post-molt than nonpregnant females (Shero et al. 2015). Considering that we do not have data on whether females in this study were pregnant, the variation between females could be explained by nonpregnant individuals; either younger than sex-ual maturity or sexsex-ually mature females taking “sabbaticals” from breeding in years of low productivity when leaving foraging areas may affect long-term fitness (Chambert et al. 2015).
[image:12.486.73.409.51.319.2]Regional daily speed was also driven by fatness index (axial girth/length) which had a negative estimate in the model. This was unexpected as larger animals have greater metabolic requirements (Staniland 2005). However, there was very little vari-ation around the mean for fatness index, which we suspect is a result of an over-sim-plified index for size. The residual error term in the minimum adequate model was larger than the variance within individuals and within regions, which implies there
Figure 5. Resident time (the proportion of dives allocated a resident behavioral state from
are further predictors outside the scope of the model. For these reasons, we think the model would be greatly improved by collecting data on both mass and female repro-ductive state, to explain their effect on regional daily speed.
Mean bathymetry also had a small but significant, negative effect on regional daily speed. In deeper water, seals traveled less far per day of deployment. This seems coun-terintuitive but could be driven by the behavior of seals on the continental shelf, div-ing in deep waters over the Filchner Trough. The deepest dive recorded in the Filchner Trough in this study was made by a male seal to 704 m. Future studies could investigate this further by defining regions in oceanographic detail, using salin-ity data from CTD tags.
Bathymetry at Dive Positions
The southern Weddell Sea reaches depths of over 4,000 m, providing Weddell seals with a wide variety of oceanographic regimes. We found that the dive positions of males were associated with shallower bathymetry than those of females. The GLMM explained 94% of the data when individual and region were included as ran-dom effects. This sex difference has never been seen before in the bathymetry of dive positions, although no other population of Weddell seals has this unique availability of the vast continental shelf to the south, and the deep Southern Ocean to the north. The mean bathymetry recorded for diving Weddell seals in Queen Maud Land was 207 m (McIntyreet al.2013), in Dumont d’Urville was 237 m (Heerahet al. 2013), and in the Western Ross Sea was 505 m (Goetz 2015). The deepest dives in this study were not off the shelf but over the Filchner Trough, and eight individuals (1:1 sex ratio) dived to depths>600 m.
The proportion of dive positions were relatively similarly distributed across the four categorized regions: (1) shallow water on the shelf, (2) Filchner Trough, (3) con-tinental shelf edge, and (4) deep water off the shelf. However, when accounting for sex, we found that only 3% of dives from males were made in the deep water off the continental shelf. We found that the males in this study were more similar to both males and females from the population in Prydz Bay, who spent 100% of their time in shelf waters (Bestleyet al. 2015). This behavior has also been shown by both males and females from populations in Dumont D’Urville and Davis (Heerahet al. 2017).
Regional Resident Time
Weddell seals from this population were estimated to spend 79% of their time in a resident behavioral state. This is similar to the population tagged in Prydz Bay that had a resident time of 83% (Bestleyet al. 2015). However we found that sex had a significant effect on regional resident time, with males being more resident than females. Males spent 83.4% (7.7%) of their time in a resident state, which is more similar to both males and females together in Prydz Bay. It is possible that males in the Weddell Sea, and both males and females from the Prydz Bay population, are more resident due to their exclusive use of the Antarctic shelf habitat (Bestleyet al. 2015). Additionally, individuals that are physically constrained in their displace-ments may also have a higher resident time.
requirements due to aquatic mating reducing male-to-male aggression (Harcourt 2006, Harcourt et al. 2007). The selective pressure to be big is therefore greatly reduced. Additionally, Harcourt (2006) found evidence that some male Weddell seals in McMurdo Sound were foraging during the breeding season, reducing this pressure further.
The Weddell seal reproductive strategy is a variation on resource defense polygyny, where males defend underwater territories around breathing holes in the ice (Siniff et al. 1977). Therefore males who range less far from breeding areas could be more likely to secure territories for the following breeding season (Bartshet al. 1992). We believe that this role in reproduction could be driving the distribution of male Wed-dell seals in the southern WedWed-dell Sea.
During the winter, pregnant females have higher energetic requirements (Shero et al. 2015). It has been seen in southern elephant seals at Macquarie Island that dur-ing favorable conditions, mothers will invest more energy in their offsprdur-ing than when resources are limited (McMahonet al. 2017). If prey availability in region A and B on the shelf is limited, the findings in this study could provide evidence for intraspecific competition. Low quality individuals, including nonbreeding females, may benefit from ranging further from these denser concentrations in years when food reserves are limited (Proffittet al. 2007, Chambertet al. 2015). This behavior is ter-med temporary emigration, and is a condition-dependent strategy used by lower quality female Weddell seals in the Ross Sea, who cannot “afford” to leave foraging areas (Chambertet al. 2015). This could explain why we see the individual variation within females, exploiting both on shelf and off shelf habitats postmolt.
Conclusions
Despite the sample in this study being reduced to 13 individuals, due to tag failure and the lack of morphometric data for all tagged seals, our findings provide evidence for sex-related differences in the postmolt distribution of Weddell seals in the south-ern Weddell Sea. This is not seen elsewhere along their circumpolar distribution which remains to be explained. Future studies would benefit from describing the oceanography and prey availability of Weddell seal habitats around the Southern Ocean to better understand why we see this difference in behavior. The most abun-dant prey species in the Weddell Sea is the Antarctic silverfish (Pleuragramma antarcti-cum), but Weddell seals are also known to feed on Trematomus fish species and invertebrates (Pl€otz 1986, Burnset al. 1998). Lake et al. (2003) found evidence for both temporal and spatial variation in Weddell seal prey types within East Antarc-tica. Several ecotypes were described, including predators of benthic fish, prawns and glacial squid (Psychroteuthis glacialis; Lakeet al. 2003).
Acknowledgments
This research was funded by NERC grants NE/G014833/1 and NE/G014086/1 and the research was reviewed and approved by the University Teaching and Research Ethics Commit-tee and Animal Welfare and Ethics CommitCommit-tee of the University of St Andrews. Capture and deployment of satellite transmitters was carried out by experienced personnel with United Kingdom Animal (Scientific Procedures) Act 1986 personal licenses. The authors are grateful for the support of the officers and crew of RRSErnest ShackletonES054 cruise. We also thank the three anonymous reviewers for their comments on the manuscript.
Literature Cited
Amante, C., and B. W. Eakins. 2009. ETOPO1 1 arc-minute global relief model: Procedures, data sources and analysis. U.S. Department of Commerce, NOAA Technical Memorandum NESDIS NGDC-24. 19 pp.
Andrews-Goff, V., M. A. Hindell, I. C. Field, K. E. Wheatley and J. B. Charrassin. 2010. Factors influencing the winter haulout behavior of Weddell seals: Consequences for satellite telemetry. Endangered Species Research 10:83–92.
Arndt, J. E., H. W. Schenke, M. Jakobsson, et al. 2013. The International Bathymetric Chart of the Southern Ocean (IBCSO) Version 1.0—A new bathymetric compilation covering circum-Antarctic waters. Geophysical Research Letters 40:3111–3117. Baker, J. R., M. A. Fedak, S. S. Anderson, T. Arnbom and R. Baker. 1990. Use of a
tiletamine-zolazepam mixture to immobilize wild grey seals and southern elephant seals. The Veterinary Record 126:75–77.
Bartsh, S. S., S. D. Johnston and D. B. Siniff. 1992. Territorial behavior and breeding frequency of male Weddell seals (Leptonychotes weddellii) in relation to age, size, and concentrations of serum testosterone and cortisol. Canadian Journal of Zoology 70:680– 692.
Beck, C. A., W. D. Bowen, J. I. McMillan and S. J. Iverson. 2003. Sex differences in the diving behavior of a size-dimorphic capital breeder: The grey seal. Animal Behaviour 66:777–789.
Bestley, S., I. D. Jonsen, M. A. Hindell, C. Guinet and J. B. Charrassin. 2012. Integrative modeling of animal movement: Incorporatingin situhabitat and behavioral information for a migratory marine predator. Proceedings of the Royal Society of London B: Biological Sciences 280(1750):20122262.
Bestley, S., I. D. Jonsen, M. A. Hindell, R. G. Harcourt and N. J. Gales. 2015. Taking animal tracking to new depths: Synthesizing horizontal–vertical movement relationships for four marine predators. Ecology 96:417–427.
Boehme, L., P. Lovell, M. Biuw,et al. 2009. Technical note: Animal-borne CTD-Satellite Relay Data Loggers for real-time oceanographic data collection. Ocean Science 5:685– 695.
Breed, G. A., W. Don Bowen and M. L. Leonard. 2013. Behavioral signature of intraspecific competition and density dependence in colony breeding marine predators. Ecology and Evolution 3:3838–3854.
Bryden, M. M., M. S. R. Smith, R. A. Tedman and D. W. Featherston. 1984. Growth of the Weddell seal,Leptonychotes weddelli(Pinnipedia). Australian Journal of Zoology 32:33– 41.
Burns, J. M., S. J. Trumble, M. A. Castellini and J. W. Testa. 1998. The diet of Weddell seals in McMurdo Sound, Antarctica as determined from scat collections and stable isotope analysis. Polar Biology 19:272–282.
Chambert, T., J. J. Rotella and R. A. Garrott. 2015. Female Weddell seals show flexible strategies of colony attendance related to varying environmental conditions. Ecology 96:479–488.
Costa, D. P., and D. E. Crocker. 1996. Marine mammals of the Southern Ocean. American Geophysical Union 287–301.
Cullen, T. M., D. Fraser, N. Rybczynski and C. Schr€oder Adams. 2014. Early evolution of sexual dimorphism and polygyny in Pinnipedia. Evolution 68:1469–1484.
Fedak, M. A., S. S. Anderson and M. G. Curry. 1983. Attachment of a radio tag to the fur of seals. Journal of Zoology 200:298–300.
Fetterer, F., K. Knowles, W. Meier, M. Savoie and A. K. Windnagel. 2016 (updated daily). Sea ice index, version 2.1. NSIDC: National Snow and Ice Data Center, Boulder, CO. Available at http://nsidc.org/data/g02135. Accessed 10 May 2017.
Goetz, K. T. 2015. Movement, habitat, and foraging behavior of Weddell Seals
(Leptonychotes Weddellii) in the Western Ross Sea, Antarctica. Ph.D. thesis, University of
California, Santa Cruz, CA. xx + 155 pp. Available at http://escholarship.org/uc/item/ 0jx2107r.
Harcourt, R. G. 2006. Weddell seals. Pages 1058–1060inB. Riffenburgh, ed. Encyclopedia of the Antarctic. Routledge, New York, NY.
Harcourt, R. G., J. J. Kingston, M. F. Cameron, J. R. Waas and M. A. Hindell. 2007. Paternity analysis shows experience, not age, enhances mating success in an aquatically mating pinniped, the Weddell seal (Leptonychotes weddellii). Behavioral Ecology and Sociobiology 61:643–652.
Heerah, K., V. Andrews-Goff, G. Williams, E. Sultan, M. Hindell, T. Patterson and J. B. Charrassin. 2013. Ecology of Weddell seals during winter: Influence of environmental parameters on their foraging behavior. Deep Sea Research Part II: Topical Studies in Oceanography 88:23–33.
Heerah, K., M. Hindell, V. Andrew Goff, I. Field, C. R. McMahon and J. B. Charrassin. 2017. Contrasting behavior between two populations of an ice obligate predator in East Antarctica. Ecology and Evolution 7:606–618.
Hindell, M. A., D. J. Slip and H. R. Burton. 1991. The diving behavior of adult male and female southern elephant seals, Mirounga leonina (Pinnipedia, Phocidae). Australian Journal of Zoology 39:595–619.
Kooyman, G. L. 1967. An analysis of some behavioral and physiological characteristics related to diving in the Weddell seal. Pages 227–261inG. A. Llano and W. L. Schmitt, eds. Biology of the Antarctic Seas III. American Geophysical Union, Washington, DC. Labrousse, S., J. Vacquie-Garcia, K. Heerah,et al. 2015. Winter use of sea ice and ocean water
mass habitat by southern elephant seals: The length and breadth of the mystery. Progress in Oceanography 137:52–68.
Lake, S., H. Burton and J. van den Hoff. 2003. Regional, temporal and fine-scale spatial variation in Weddell seal diet at four coastal locations in east Antarctica. Marine Ecology Progress Series 254:293–305.
Lake, S., H. Burton and S. Wotherspoon. 2006. Movements of adult female Weddell seals during the winter months. Polar Biology 29:270–279.
McConnell, B. J., C. Chambers and M. A. Fedak. 1992. Foraging ecology of southern elephant seals in relation to the bathymetry and productivity of the Southern Ocean. Antarctic Science 4:393–398.
McConnell, B. J., and M. A. Fedak. 1996. Movements of southern elephant seals. Canadian Journal of Zoology 74:1485–1496.
McIntyre, T., L. J. Stansfield, H. Bornemann, J. Pl€otz and M. N. Bester. 2013. Hydrographic influences on the summer dive behavior of Weddell seals (Leptonychotes weddellii) in Atka Bay, Antarctica. Polar Biology 36:1693–1700.
Nordøy, E. S., and A. S. Blix. 2009. Movements and dive behavior of two leopard seals
(Hydrurga leptonyx) off Queen Maud Land, Antarctica. Polar Biology 32:263–270.
Padman, L., D. P. Costa, S. T. Bolmer,et al. 2010. Seals map bathymetry of the Antarctic continental shelf. Geophysical Research Letters 37:L21601.
Patterson, T. A., L. Thomas, C. Wilcox, O. Ovaskainen and J. Matthiopoulos. 2008. State– space models of individual animal movement. Trends in Ecology & Evolution 23:87–94. Pl€otz, J. 1986. Summer diet of Weddell seals (Leptonychotes weddellii) in the eastern and
southern Weddell Sea, Antarctica. Polar Biology 6:97–102.
Proffitt, K. M., R. A. Garrott, J. J. Rotella and K. E. Wheatley. 2007. Environmental and senescent related variations in Weddell seal body mass: Implications for age specific reproductive performance. Oikos 116:1683–1690.
R Development Core Team. 2008. R: A language and environment for statistical computing. Foundation for Statistical Computing, Vienna, Austria.
Ruckstuhl, K. E., and P. Neuhaus. 2002. Sexual segregation in ungulates: A comparative test of three hypotheses. Biological Reviews 77:77–96.
Santora, J. A. 2014. Environmental determinants of top predator distribution within the dynamic winter pack ice zone of the northern Antarctic Peninsula. Polar Biology 37:1083–1097.
Sato, K., Y. Mitani, M. F. Cameron, D. B. Siniff, Y. Watanabe and Y. Naito. 2002. Deep foraging dives in relation to the energy depletion of Weddell seal (Leptonychotes weddellii) mothers during lactation. Polar Biology 25:696–702.
Schenke, H. W., H. Hinze, S. J. Dijkstra, B. Hoppmann, F. Niederjasper and T. Sch€one. 1997. AWI bathymetric chart of the Weddell Sea, Antarctica (BCWS). Alfred Wegener Institute, Helmholtz Center for Polar and Marine Research, Bremerhaven, Germany. Shero, M. R., R. T. Krotz, D. P. Costa, J. P. Avery and J. M. Burns. 2015. How do overwinter
changes in body condition and hormone profiles influence Weddell seal reproductive success? Functional Ecology 29:1278–1291.
Siniff, D. B., D. P. DeMaster, R. J. Hofman and L. L. Eberhardt. 1977. An analysis of the dynamics of a Weddell seal population. Ecological Monographs 319–335.
Staniland, I. 2005. Sexual segregation in seals. Pages 53–73 in K. E. Ruckstuhl and P. Neuhaus, eds. Sexual segregation in vertebrates: Ecology of the two sexes. Cambridge University Press, Cambridge, U.K.
Staniland, I. J., and S. L. Robinson. 2008. Segregation between the sexes: Antarctic fur seals,
Arctocephalus gazella, foraging at South Georgia. Animal Behaviour 75:1581–1590.
Stephens, D. W., and J. R. Krebs. 1986. Foraging theory. Princeton University Press, Princeton, NJ.
Stirling, I. 1969. Distribution and abundance of the Weddell seal in the western Ross Sea, Antarctica. New Zealand Journal of Marine and Freshwater Research 3:191–200. Stirling, I. 1971. Studies on the behavior on the South Australian fur seal,Arctocephalus forsteri
(Lesson) II. Adult females and pups. Australian Journal of Zoology 19:267–273. Zuur, A. F., E. N. Ieno, N. J. Walker, A. A. Saveliev and G. M. Smith. 2009. Mixed effects
models and extensions in ecology with R. Springer-Verlag, New York, NY.
Received: 9 September 2016 Accepted: 3 October 2017
Supporting Information
The following supporting information is available for this article online at http:// onlinelibrary.wiley.com/doi/10.1111/mms.12461/suppinfo.