doi:10.4236/jep.2011.23029 Published Online May 2011 (http://www.scirp.org/journal/jep)
Net Nutrient Uptake in the White River, Northwest
Arkansas, Downstream of a Municipal Wastewater
Treatment Plant
Brad W. Hufhines1, Kristofor R. Brye2, Brian E. Haggard3, Robert Morgan4
1Environmental Technician, Beaver Water District, Lowell, USA; 2Department of Crop, Soil, and Environmental Sciences; Univer-sity of Arkansas, Fayetteville, USA; 3Department of Biological and Agricultural, Engineering, University of Arkansas, Fayetteville, USA; 4Environmental Quality Manager, Beaver Water District, Lowell, USA.
Email: kbrye@uark.edu
Received November 18th, 2010; revised January 8th, 2011; accepted February 14th, 2011.
ABSTRACT
Wastewater treatment plays a crucial role in preserving water quality in receiving streams; however, continuous nutri-ent enrichmnutri-ent can diminish the retnutri-ention capacity of rivers. The objectives of this study were to evaluate the effects of wastewater treatment plant effluent and river discharge on water chemistry and determine the retention efficiency of nutrients added in the effluent along a 6.1-km reach of a 5th-order stream in the Ozark Highlands of northwest Arkan-sas. From 2006 through 2007, effluent discharge increased river nitrite, soluble reactive P (SRP), and total organic C
(TOC) and conductivity. As river discharge increased, dissolved oxygen (DO) and turbidity increased, but water tem-perature, conductivity, and TOC decreased. Net nutrient uptake lengths were inconsistent for NO3-N, NH4-N, and SRP.
Results indicated that the fluvial channel acted as both a sink and a source of NO3-N and SRP, but the channel always
acted as a sink for NH4-N with a significantly positive retention coefficient that indicated only 12% of added NH4-N
was retained in the study reach. The effluent discharge increased the concentrations of seven water quality parameters and it appears the long-term enrichment has rendered the immediate-downstream reach ineffective as a nutrient sink. Nutrients added in the effluent were generally transported with little to no uptake or transformation, thus river chemical concentrations beyond the study reach have likely been influenced by this effluent discharge.
Keywords: Streamflow, Point-Source Pollution, Nutrient Spiraling, Source-Water Protection
1. Introduction
Water quality issues in the Ozark Highlands region of northwest Arkansas, southwest Missouri, and northeast Oklahoma include sedimentation and mineral and nutri-ent enrichmnutri-ent. Numerous stream segmnutri-ents do not sup-port the designated uses for aquatic life and/or as a mu-nicipal and industrial water supply [1]. The causes of these impairments include surface erosion, urban non-point source pollution, and the effluent from municipal wastewater treatment plants (WWTP) [1]. Even so, at least the last two decades of water quality research in the Ozark Highlands have focused primarily on nutrient fluxes in surface runoff in response to animal manure application [2-5]. A need exists to evaluate the impact of treated wastewater on in-stream processes, focusing on how effluent discharges influence stream nutrient reten-tion.
In the 2000s, numerous studies evaluated the effects of effluent discharges on nutrient dynamics within the stream channel [6-9]. Impacts of the effluent discharge in relatively small streams demonstrated the stream’s in-ability to retain added phosphorous (P) and nitrogen (N); added nutrients were traveling kilometer-scale distances before being significantly retained. These streams pro-vided short-term N storage through partial N cycling and nitrification of ammonium (NH4-N) to nitrate-N (NO3-N).
However, NO3-N often showed a net increase in
trans-port downstream from the effluent discharge or traveled long distances before retention within the fluvial chan-nel.
mod-Net Nutrient Uptake in the White River, Northwest Arkansas, Downstream of a Municipal Wastewater Treatment Plant 256
ern-day WWTP [10]. Gücker et al. [10] reported
dimin-ished rates of P and ammonium uptake, but increased nitrate uptake efficiency downstream of the WWTP. Gücker et al. [10] attributed the difference in their
find-ings, as compared to previous studies, to the modern ter-tiary treatment of wastewater. Thus, it is clear that the effects of effluent discharges on nutrient dynamics and water chemistry vary with the treatment capacity of the WWTPs. Treese et al. [11] even suggested that clogging
of the streambed may occur in effluent-dominated streams due to increased physical, chemical, and bio-logical processes from elevated nutrients to render the stream unstable and result in a reduced capacity to re-charge groundwater.
Most studies on the effects of effluent discharges on stream nutrient retention have focused on smaller streams, where the effluent discharge often has a pro-found effect on physio-chemical properties and makes up a large portion of discharge. Relatively few studies have focused on large rivers, when the effluent discharge is greatly diluted even during seasonal base-flow condi-tions. The Chattahoochee River, a large urban river near Atlanta, Georgia exhibited great variation in nutrient patterns downstream of multiple effluent discharges due to large fluctuations in river discharge and subsequent dilution of the effluents [12]. Thus, the dilution of efflu-ent discharges plays a large role in the impact on water chemistry and nutrient transport downstream.
The objectives of this study were to evaluate the ef-fects of WWTP effluent and river discharge on water quality and determine the retention efficiency of nutri-ents added in WWTP effluent in a 5th-order stream in the Ozark Highlands of northwest Arkansas. It was hy-pothesized that 1) there will be a no difference in water quality upstream and downstream of the WWTP effluent due to a large dilution effect, 2) dilution-corrected nutri-ent concnutri-entration differences will not be observed among downstream sample sites due to the relatively short study reach, 3) nutrient retention coefficients would not differ from zero indicating nutrient transport with no retention nor export was occurring, and 4) retention coefficients and net nutrient uptake lengths for N fractions would be unrelated, but those for P fractions would be related to certain water quality parameters, particularly turbidity.
2. Methods
2.1. The Study Area
The Ozark Highlands ecoregion covers parts of Kansas, Missouri, Oklahoma, and Arkansas [13] and is charac-terized by karst topography and high-gradient, riffle-pool, clear-flowing streams. Stream base flows throughout the dr summer months are maintained by springs and seeps. y
The ecoregion is known for its rich aquatic diversity. Bedrock in the Ozark Highlands is typically limestone, dolomite, and chert. Historically, land cover was oak (Quercus spp.)—hickory (Carya spp.) forest with inter-mittent tallgrass prairie. Most of the tallgrass prairie has been converted to agriculture [14]. Approximately 20% of the Ozark Highlands is used for pasture, 10% for cropland, and 70% is forestland [15].
The Ozark Highlands is also an area of concentrated poultry production [16]. Arkansas’ broiler production is concentrated in the northwestern counties of Benton, Washington, Carroll, and Madison, all of which are lo-cated within the Ozark Highlands ecoregion. Poultry litter is rich in N, P, and potassium (K) and is a cost-effective way of fertilizing soils [17]. Between 1.3 million and 1.8 million Mg of litter is generated in Ar-kansas annually. A large fraction of this litter is concen-trated in northwest Arkansas [18]. This application of litter has resulted in high soil-test P levels where pastures have been fertilized long-term [19] and numerous surface water quality issues throughout the region. Over the last 20 years, the northwest Arkansas portion of the Ozark Highlands has experienced a high rate of urbanization. From 2000 to 2007, the population within Washington and Benton counties increased by 28% from 311,121 to 397,399 [20]. The increasing population has placed greater demands on regional water resources, which re-lies on Beaver Lake within the White River Basin
The White River in northwest Arkansas is the largest tributary to Beaver Lake, and over 250,000 residents of northwest Arkansas use water from Beaver Lake as their source of drinking water. Three WWTPs discharge treated wastewater within the Beaver Lake-White River watershed. The Paul R. Noland WWTP in Fayetteville, AR is the largest contributor of treated wastewater to receiving waters within the watershed. The Paul R. Noland WWTP discharges effluent into the White River, which is classified as an impaired waterbody because of the lack of support for aquatic life due to excessive silta-tion and/or turbidity [1].
The White River is composed of three major branches: the West Fork, the Middle Fork, and the main fork, which is simply referred to as the White River (Figure 1).
The three branches of the White River originate in the Boston Mountainss ecoregion and flow north to the Ozark Highlands ecoregion. The Middle Fork of the White River and the White River combine to form Lake Sequoyah, a small, shallow reservoir. The outflow of Lake Sequoyah combines with the West Fork of the White River and eventually flows into Beaver Lake.
Figure 1. Map of the major rivers within the Beaver Lake Watershed in Northwest Arkansas. The Paul R. Noland municipal wastewater treatment plant (WWTP) discharges into the White River and was used as the nutrient input source for this study. The study reach stretches 2.2 km upstream of the WWTP discharge to 3.9 km downstream of the WWTP discharge.
forks of the White River and the headwaters of Beaver Lake. The entire reach examined in this study was in the Ozark Highlands. In 2004, the White River was desig-nated to have an impaired ability to support aquatic life due to siltation and/or turbidity, where the source was likely from surface erosion. The causes of surface ero-sion were agricultural activities, unpaved road surfaces, and in-stream erosion mainly from unstable stream banks [21]. The White River was categorized as a high-priority for development of a total maximum daily load for the indicated pollutants [1].
Six sites were selected for sampling during the study, a United States Geological Survey (USGS) stream
dis-charge monitoring station was located in the study reach, station 07084600 (Figure 2) at Wyman Bridge, just east
of Fayetteville, AR. one upstream (~2 km) of the Paul R. Noland WWTP just south of Wyman Bridge and five sites downstream were chosen at riffles, so that the water column would be mixed by the turbulence of the water moving over the shallow riffles. The only major water inflow between Sites 1 and 2 was the effluent discharge from the WWTP; there were no tributary inflows. The sites downstream were from ~0.4 to ~4 km below the WWTP discharge into the White River.
Health Risk Associated with Pesticide Contamination of Fish from the Densu River Basin in Ghana. 258
Figure 2.Map of the study reach with sampling sites and wastewater treatment plant (WWTP) discharge to the White river,
northwest AR.
14.2˚C and average annual precipitation of 117 cm [22]. During the study period of 2006 and 2007, annual pre-cipitation at the USGS station 07048600 totaled 86 and 72 cm, 26% and 38%, respectively, below the 30-year average [23]. The White River at Wyman Bridge has a total drainage area of 1036 km2 [24] and is 74% forested,
15% pasture, and 4% developed or urban.
2.2. The Wastewater Treatment Plant
At the time of this study, the Paul R. Noland WWTP was a Class IV, activated-sludge treatment plant with ul-tra-violet disinfection. The WWTP’s National Pollution Discharge Elimination System (NPDES) permit allowed the WWTP to discharge a maximum of 27,710 m3·d−1
into the White River, and the effluent quality was regu-lated by the Arkansas Department of Environmental Quality (ADEQ). Daily to hourly discharge flow data and effluent water quality records for days that sampling occurred were obtained directly from the WWTP (per-sonal communication, Tim Luther, Operations Manager, CH2M HILL OMI). Effluent water quality data obtained included: daily averages of temperature, dissolved oxy-gen (DO), pH, total suspended solids (TSS), soluble re-active phosphorous (SRP), total P (TP), and NH4-N.
Other forms of N (eg., NO3-N, NO2-N, and organic N)
were not routinely measured or reported for this effluent
discharge, thus were unavailable to use and report in this study.
2.3. Water Sample Collection, Processing, and Analyses
Water sampling was conducted monthly, excluding De-cember and February, for two consecutive years from January 2006 through 2007. Flow conditions in the White River below the 40-year median flow of 10.5 m3·s−1
were targeted as sampling dates, because higher flows presented some personnel safety considerations. At each of the six sampling sites, pH, electrical conductivity, DO, and temperature were measured in-situ with a Thermo Orion 5 Star portable meter (Beverly, MA) at three points within the thalweg (i.e., left, middle, and right). A
1-L water sample was also collected at each of the three points within the thalweg at each sampling site. In the event of split flow resulting from channel morphological changes, both channels were measured for discharge (see below). If the secondary channel accounted for more than 20% of the total discharge, one or more of the three water samples were taken from its thalweg based on its estimated contribution to discharge.
measured with a fiberglass measuring tape. Channel depth was determined with a Marsh McBirney measuring rod and flow velocity was measured electromagnetically with a Flo-Mate 2000 (Marsh McBirney, Fredrick, MA). River discharge was estimated using the product of the water velocity (m·s–1) and cross-sectional area (m2) for
each area between survey points. The equal-interval charges were then summed to estimate total river dis-charge at each sampling site.
Following collection, water samples were stored on ice in a dark cooler. Within 24 hrs after collection, sam-ple bottles were shaken and a well-mixed, 40-mL aliquot was removed and preserved to a pH of ~ 2 with two drops of concentrated HCl per 40 mL of solution for subsequent total organic carbon (TOC) and total N (TN) analyses. A 100-mL, well-mixed aliquot was then re-moved from the 1-L bottle and preserved to a pH of ~ 2 with two drops of 12 N sulfuric acid per 100 mL of solu-tion for subsequent TP analysis. Turbidity was measured on a 20-mL aliquot using a HACH 2100N Turibidimeter (Loveland, CO) according to the SM 2130 B method [25]. Turbidity was reported in nephelometric turbidity units (NTU). The remaining portion of the initial 1-L sample was then vacuum-filtered through a 0.45-µm fil-ter. The filtered aliquot was used for subsequent SRP, nitrite (NO2-N), NO3-N, NH4-N, and chloride (Cl-)
analyses.
Chloride concentrations were determined according to the SM 4500-Cl- C mercuric-nitrate titration method [25]. Total organic carbon and TN were determined using a Shimadzu TOC-VCSH TOC analyzer with an added THM-1 TN measuring unit (Shimadzu, Kyoto, Japan) using the SM 5310 B [25] and ASTM D 5176-91 meth-ods [26], respectively. Determinations of NO3-N, NO2-N,
NH4-N, SRP, and TP were conducted using a HACH DR
4000 (HACH, Loveland, CO.) spectrophotometer. Ni-trate was reduced to NO2-N using the SM 4500-NO3-E
cadmium-copper reduction method [25]. The resulting reduced-sample was colormetrically analyzed for deter-mination of the NO2-N concentration. The difference
between the reduced-sample NO2-N concentration and
the previously determined NO2-N concentration was
determined to be the NO3-N concentration [25].
Ammo-nium was determined by the HACH Nessler method 8038 [27]. Nitrite was determined by the HACH Diazo-tization method 8507 [27]. Soluble-reactive P was de-termined by the HACH ascorbic acid method 8048 [27]. Preserved TP water samples were digested according to the persulfate digestion method (SM 4500-P B) and de-termined colormetrically by the HACH ascorbic acid
method [27]. All analyses were conducted before rec-ommended holding times had expired [25].
2.4. Nutrient Retention, Export, or Net Uptake
Nutrients added to an aquatic system are retained in, transported through, or exported from the system (i.e.,
added to the water column) [28]. The fraction of nutri-ents retained within the study reach (i.e., the retention
coefficient (RC)) was calculated using the nutrient loads from Sites 2 (S2) and 6 (S6) with Equation 1:
where N was the mean measured nutrient concentration (mg·L–1) and Q was the measured river discharge (m3·s–1)
for the respective Site 2 (S2) or 6 (S6). Since NO2-N
made up such a small percentage of the inorganic N frac-tion in the water column, the combined NO2-N + NO3-N
concentration was used in this analysis. Calculating nu-trient export or retention in this way is a general ap-proach that examines only reach-level inputs and outputs, which rely on measured Q at the sites. Streams and rivers in the Ozark Highlands often have relatively large sub-surface Q flowing through the gravel alluvium within the fluvial channel.
The WWTP effluent was used as the nutrient source for determining net nutrient uptake length (SNET). The
SNET approach evaluates longitudinal changes in
nutri-ent concnutri-entration throughout the nutri-entire study reach, where SNET is a more quantitative approach to
examin-ing nutrient dynamics within a study reach than just ex-amining nutrient inputs and outputs. The mean concen-tration (based on three sub-samples) at each sampling site was corrected for downstream of the effluent dis-charge (Site 2) using Equation (2):
D x 0
N N *Cl Clx (2) where ND was the dilution-corrected concentration
(mg·L–1) for the nutrient of choice, N
X was the mean
nutrient concentration (mg·L–1) at sample site x, Cl 0 was
the mean chloride concentration (mg·L–1) from Site 2 (
i.e.,
the immediate downstream sample site of the WWTP), and ClX was the mean chloride concentration (mg·L–1) at
sampling site x. The proportion of nutrient remaining in the water column was then calculated using Equation (3):
NX DX D0
P N N (3) where P was the proportion of the dilution-corrected nu-trient (N) concentration remaining in the water column at site (X). The proportion remaining in the water column (P) was natural-log transformed, and the slope of the linear relationship between the natural-log of the propor-tion remaining in the water column and the distance from
S2 S2
S6 S6
S2 S2
Net Nutrient Uptake in the White River, Northwest Arkansas, Downstream of a Municipal Wastewater Treatment Plant 260
the WWTP discharge represented K. When K (i.e., the
slope) was significant (i.e., different from 0) at the p <
0.1, then SNET was calculated with Equation (4): NET
S 1K (4) Net nutrient uptake length (SNET) was expressed in
km and was calculated for SRP, NO3-N, and NH4-N
for each sampling date. Negative SNET values represented
net release of the nutrient through the study reach, while positive distances demonstrate net retention with long distance suggesting less efficient retention than shorter distances (Newbold et al., 1981). An alpha value of 0.1
was used to judge significance due to the large scale (i.e.,
5th-order stream) of the White River [see also 12].
The net mass transfer coefficient (VF-NET) was
calcu-lated using SNET, Q, and the average wetted width of the
river (W) using Equation (5):
F NET NET
V Q S * W (5)
and was expressed in m s–1. The V
F-NET is the velocity
at which nutrients travel from the water column to the stream substrate, and removes some hydrologic effects for across site and date comparisons.
Net nutrient uptake rate (UNET) was then calculated
by Equation 6:
NET F NET 0
U V * C (6) and was expressed in mg m2 s–1. This parameter
con-siders changes in concentrations downstream from the effluent discharge to estimate net uptake rates.
2.5. Statistical Analyses
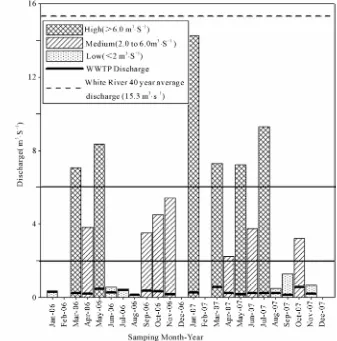
River discharge was graphically examined initially and, due to large temporal variations, was divided into three qualitative categories [i.e., Low (<2 m3·s–1), Medium (2 -
6 m3·s–1), and High (>6 m3·s–1)] based on the frequency
of sampling days with similar discharge rates (Figure 3).
Water quality parameters (i.e., TN, NO3-N, NO2-N,
NH4 - N, TP, SRP, turbidity, TOC, Cl, pH, conductivity,
temperature, and DO) upstream of the municipal WWTP discharge (Site 1) were compared to those at the first site immediately downstream (Site 2) to evaluate the imme-diate effect of WWTP effluent on water quality. This was accomplished by conducting a two-factor analysis of variance (ANOVA) using SAS (version 9.1, SAS Insti-tute, Inc., Cary, NC) to evaluate the effect of site (up-stream and down(up-stream) and flow regime (i.e., low,
me-dium, and high) on water quality parameters. In addition, paired t-tests were performed separately within each flow regime comparing parameters upstream and downstream to further evaluate the effect of the WWTP effluent dis-charge on river water quality (Minitab 13.31, Minitab
Inc., State College, PA).
On dates in which SNET was significant, simple
cor-relation analyses using Minitab were performed to evaluate the relationship between the SNET of individual
nutrients and other water quality parameters. An alpha level of 0.1 was decided a priori to use to judge the
sig-nificance of SNET values due to the expected large spatial
variability with the measured parameters. An alpha level of 0.05 was used to judge significance for all correlations conducted. The parameters that were analyzed included: Site 2 nutrient concentrations (SRP, NO3-N, NH4-N, TP,
and TN), TOC, turbidity, conductivity, temperature, pH, DO, and the mean Q averaged across all six sites. Site 2 was chosen because the water quality parameters down-stream would show how the effluent discharge might influence nutrient dynamics. An average Q was calcu-lated and used instead of Q measured at Site 2 because of the fluctuations from site to site due to interflow within the gravel streambed.
3. Results and Discussion
3.1. River and WWTP Discharge
White River discharge varied over the 20 sampling months from 0.1 m3·s–1 in August 2006 to 14.3 m3·s–1 in
January 2007 in response to local precipitation (Figure 3). Average discharge was 4.2 m3·s–1 on days the river
was sampled. Based on the <2, 2 to 6, and >6 m3·s–1
dis-charge thresholds, there were a total of 7, 7, and 6 sam-pling dates that represented the low, medium and high flow categories, respectively (Figure 3). The 42-year
(1964 to 2006) average river discharge for the study reach was 15.3 m3 s–1 and included storm-flow as well as
base-flow discharge [29]. White River discharge was below the 42-year average on all sample dates in this study. Thus, the flow-regime categories that were as-signed for this study do not represent the total variation in White River discharge.
The WWTP discharge ranged from 0.1 m3·s–1 in
Au-gust 2006 and September 2007 to 0.6 m3·s–1 in March and
October 2007 (Figure 3), averaging 0.3 m3·s–1over the
Figure 3. White River discharge throughout a 20-month sampling period from January 2006 to December 2007. Also plotted are the wastewater treatment plant (WWTP) discharge into the White river and the 40-yr average White River discharge. river discharge was quantitatively divided into three flow regimes (Low, Medium, and High). Horizontal lines at 2.0 and 6.0 m3 s–1 indicate the thresholds separating the three flow regimes.
qualitatively categorized for purposes of this study.
3.2. Water Quality Upstream of the WWTP Discharge
Stream water quality was measured upstream of the WWTP on all 20 sampling dates (Table 1). Turbidity
varied greatly across sampling dates ranging from 1.9 in August 2006 to 45.2 NTU in March 2006. There was a total maximum daily load (TMDL) present for turbidity that was set by the ADEQ as required for impaired wa- terbodies. Since no stream load data could be assessed for turbidity (i.e., there is no concentration associated
with NTU because it is an optical measurement), total suspended solids (TSS) was used as a surrogate to tur-bidity to develop the TMDL. A target base-flow TSS concentration of 11 mg·L–1 was reported to correspond
with a turbidity level of 10 NTU, while a storm-flow TSS target of 12 mg·L–1 corresponded with a turbidity
level of 17 NTU [30]. Turbidity at Site 1 exceeded the
base-flow TMDL on 50% of the sample dates. All forms of N measured (i.e., NO3-N, NO2-N, NH4-N, and TN)
had maximum concentrations < 1.0 mg·L–1 during the
sampling dates, and maximum SRP and TP concentra-tions were ≤ 0.05 mg·L–1 (
Table 1). 3.3. WWTP Effluent Characteristics
As was expected, some effluent characteristics varied seasonally, while others did not. Effluent temperature varied seasonally from a low of 13.0˚C in March 2007 to a high of 27.2˚C in August 2007 and averaged 21.1˚C across the study period. Similarly, effluent DO concen-tration displayed a seasonal pattern varying from an av-erage of 8.3 mg·L–1 in July and August to 13.2 mg·L–1 in
March and averaged 9.1 mg·L–1 across the study period.
Septem-Net Nutrient Uptake in the White River, Northwest Arkansas, Downstream of a Municipal Wastewater Treatment Plant 262
ber 2007 to a high of 8.5 mg·L–1 in January 2007 and
averaging 2.7 mg·L–1 across the study period. Effluent
pH varied between pH 7 in January 2006 and 7.9 in Sep-tember 2007.
Effluent SRP and TP concentrations were both < 0.4 mg·L–1, except for in April, May, and June 2006. Total P and SRP were greatest in the effluent during May 2006, 1.9 and 1.4 mg·L–1, respectively. These concentrations
were much greater than any observed P concentrations from the White River. Effluent ammonium concentra-tions were <0.5 mg·L–1 on all sampling dates except in
the months of March and April 2006 and in April 2007. April 2007 had the greatest observed NH4-N
concentra-tion (1.8 mg·L–1). The exact reason for the three months
of elevated SRP, TP, and NH4-N concentrations in the
effluent discharge is unknown.
When wastewater effluent NH4-N, SRP, and TP
con-centrations were compared with river concon-centrations at Site 1 and 2, effluent nutrient concentrations were often related to that observed downstream. Site 2 river SRP (r = 0.67, p < 0.01) and NH4-N (r = 0.53, p < 0.05)
con-centrations were significantly positively correlated with the WWTP effluent concentrations. These correlations indicate that the WWTP effluent was a major factor in-fluencing downstream dissolved P and NH4-N
concen-trations in the White River.
3.4. Upstream-Downstream Comparison
With the exception of NH4-N, pH, and temperature, all
other water quality parameters measured in this study were affected by site (i.e., upstream or downstream),
flow regime (i.e., low, medium, or high), or both (Table 2). Based on the two-factor ANOVA, measured Cl-, TN,
TP, and NO3-N concentrations were greater
down-stream than updown-stream of the WWTP discharge during low-flow (p < 0.01), but did not differ between sites
dur-ing medium- or high-flow conditions (Figure 4).
Meas-ured Cl-
, TN, TP, and NO3-N concentrations at Site 2
ranged from 14 to 76 mg Cl-
·L–1, 0.9 to 10.6 mg TN·L–1,
0.04 to 0.16 mg TP·L–1, and 0.6 to 11.7 mg NO
3-N·L–1
across sample dates during low-flow conditions. These same sites ranged from 5 to 14 mg Cl-
·L–1, 0.3 to 2.7 mg
TN·L–1, 0.01 to 0.13 mg TP·L–1, and 0.2 to 2.4 mg
NO3-N·L–1 across sample dates during medium- and
high-flow conditions. During low-flow, the relatively high concentrations of Cl-
, TN, TP, and NO3-N in the
WWTP effluent affected river water chemistry due to less dilution in the river when compared to higher base flows (i.e., medium and high flows in this study). This
supports the assumption that the degree of dilution, based on river discharge, plays an important role in the nutrient
enrichment of the White River. Based on paired t-tests that were conducted separately by flow regime, the con-centrations of Cl-
and TP were always greater (p < 0.05)
downstream from the WWTP effluent discharge than upstream, further indicating the significant impact that the WWTP effluent discharge has on stream water chemistry. Nitrate accounted for 91% of TN across both sites and all sample dates; thus results for nitrate and TN were similar. Nitrogen and Cl-
concentrations have been shown to be elevated below a WWTP discharge in other point-source-receiving streams in the Ozark Highlands [6,7,32], therefore, it was not surprising that the WWTP effluent affected downstream stream concentrations most when diluting flows (i.e., high discharge flow rates) were
not present in the White River.
Nitrite, SRP, TOC, and conductivity were greater (p <
0.04) downstream than upstream when averaged across all flow regimes (Table 2). The mean downstream
NO2-N concentration was more than double that of the
upstream concentration (Table 3). Nitrite is an
interme-diate form of N during nitrification and is not stable in the environment [33]. Soluble reactive P is biologically important because it is often the limiting nutrient for primary production in White River tributaries [34], but concentrations were generally low (<0.1 mg SRP L–1) on
all sample dates throughout the study. The mean river SRP concentration in the White River was four times greater downstream than upstream of the WWTP when averaged across flow regimes. The TOC concentration was 35% greater downstream from the WWTP effluent discharge compared to upstream (Table 3). Carbon
added from the WWTP effluent provides more substrate for microorganisms in the river which can lead to more heterotrophic production, which could influence micro-bial processes and reach-level retention capacity. Stream conductivity was always greater, on average 62% greater, downstream than upstream of the WWTP effluent dis-charge (Table 3) because of the added solutes in the
ef-fluent.
Based on the ANOVA, turbidity and DO did not differ between Site 1 and 2 (Tables 2 and 3). However, based
on a paired t-test within each flow regime, DO was greater downstream than upstream of the WWTP effluent discharge during low flow and was similar when flow exceeded 2 m3·s–1. Conductivity, TOC, DO, and turbidity
varied among flow regimes (p < 0.015) when averaged
across sites (Table 2). Both TOC and conductivity were
greatest during low-flow conditions and did not differ between medium and high-flow conditions (Table 4).
conditions (as defined in this study). Total organic car-bon also experienced a similar decrease as that of con-ductivity as the flow regime increased. Dilution of the WWTP effluent was likely the mechanism responsible for these changes when discharge exceeded 2 m3·s–1.
Dissolved oxygen varied among all three flow regimes and increased as flow regime increased (Table 4). The
increased mixing and aeration from more turbulent flow during increasingly greater discharge rates were likely responsible for increasing DO concentrations. Though water temperature was statistically unaffected by either site or flow regime (Table 2), water temperature
nu-merically decreased from the low- to the high-flow re-gime, while the DO concentration significantly increased (Table 4), which was expected.
Similar to DO, turbidity was also greater during high- than low-flow conditions, but turbidity during medium- flow was similar to that during both low- and high-flow conditions (Table 4). The amount of suspended sediment
in the water column is typically directly proportional to the water velocity, thus it was not surprising that turbid-ity was greatest during high-flow conditions. However, the relationship between exposure to and actual biologi-cal impairment from suspended sediment, as character-izes numerous streams in the Ozark Highlands, is poorly understood [35].
Neither site nor flow regime affected (p > 0.05)
NH4-N concentrations, water temperature, or pH based
on the ANOVA (Table 2). Averaged across sites and
flow regimes, mean ammonium concentration was 0.1
mg·L–1, mean pH was 7.3, and mean water temperature
was 18.6˚C. However, based on a paired t-test within each flow regime, water temperature was slightly greater downstream than upstream of the WWTP effluent dis-charge when flows exceeded 6 m3·s–1.
3.5. Water Quality Downstream of the WWTP Discharge
White River water quality measured at the five sites downstream of the WWTP effluent discharge varied widely. Turbidity ranged from 5 to 50 NTU across all downstream sample sites and dates during this study (Table 5). The average turbidity for Sites 2 through 6
was above the TMDL NTU limit on 45% of the sampling dates. The WWTP’s point-source-pollution effect was apparent based on increased nutrient concentrations, conductivity, and Cl–. The mean NO
3-N concentration
at Sites 2 through 6 averaged across sample dates was 3.2 mg·L–1, which was more than three times the mean
NO3-N concentration at Site 1 upstream of the WWTP
discharge (Table 1). River TP averaged 0.10 mg TP L–1
across downstream sample locations and dates, but ex-ceeded the EPA-recommended reference P concentration for Ecoregion XI of 0.01 mg·L–1 [31] with a maximum
observed concentration 0.32 mg TP·L–1. Chloride
con-centrations ranged from 5 to 77 mg·L–1 and averaged 30
mg·L–1. The mean chloride concentration for Sites 2
through 6 was more than five times greater than Site 1 upstream of the WWTP (Table 1). Mean conductivity
for Sites 2 through 6 (330 μS·cm–1) was two times great-
[image:9.595.160.436.457.680.2]Net Nutrient Uptake in the White River, Northwest Arkansas, Downstream of a Municipal Wastewater Treatment Plant 264
Table 1. Summary of water quality characteristics averaged across all flow regimes in the White river upstream (i.e., Site 1) of the Paul R. Noland Wastewater Treatment Plant in Fayetteville, AR.
Water quality parameter Minimum Maximum Average
Nitrate (mg·L–1) < 0.01 0.87 0.26
Nitrite (mg·L–1) < 0.01 0.01 < 0.01
Ammonium (mg·L–1) 0.01 0.31 0.07
Total nitrogen (mg·L–1) 0.20 0.78 0.40
Soluble reactive phosphorus (mg·L–1) < 0.01 0.01 < 0.01
Total phosphorus (mg·L–1) < 0.01 0.05 0.03
Turbidity (NTU*) 1.9 45.2 13.1
Total organic carbon (mg·L–1) 0.8 4.1 2.3
Chloride (mg·L–1) 3.8 10.2 5.6
Dissolved oxygen (mg·L–1) 4.1 11.6 8.0
pH 6.6 7.7 7.3
Conductivity (μS·cm–1) 86 440 163
Temperature (˚C) 5.7 28.8 18.4
[image:10.595.55.539.308.492.2]* Nephalometric turbidity units (NTU)
Table 2. Analysis of variance summary of the effects of site, flow regime, and their interaction on water quality parameters measured upstream and downstream of the wastewater treatment plant effluent discharge into the White river in Fayetteville, AR.
Source of variation Water quality parameter
Site Flow regime Site x flow regime
p
Nitrate 0.003 0.011 0.004
Nitrite 0.015 0.347 0.382
Ammonium 0.424 0.217 0.863
Total nitrogen 0.002 0.004 0.003
Soluble reactive phosphorus 0.003 0.156 0.150
Total phosphorus < 0.001 0.002 0.009
Turbidity 0.969 0.015 0.999
Total organic carbon 0.027 < 0.001 0.072
Chloride < 0.001 < 0.001 0.001
Dissolved oxygen 0.898 < 0.001 0.717
pH 0.242 0.153 0.940
Conductivity 0.040 < 0.001 0.107
Temperature 0.878 0.081 0.992
Table 3. Summary of the effect of site averaged across flow regime, on water quality parameters measured upstream and downstream of the wastewater treatment plant discharge into the White river in Fayetteville, AR. Mean values are reported with standard errors in parentheses.
Water quality parameter Upstream Downstream LSD0.05†
Nitrate (mg·L−1) 0.3 (< 0.1) 2.2 (0.7)* 1.2††
Nitrite (mg·L−1) < 0.01 (< 0.01) 0.02 (< 0.01)* 0.01
Ammonium (mg·L−1) 0.07 (0.01) 0.09 (0.02) -
Total nitrogen (mg·L−1) 0.4 (< 0.1) 2.3 (0.7)* 1.1††
Soluble reactive phosphorus (mg·L−1) < 0.01 (< 0.01) 0.04 (0.01)* 0.02
Total phosphorus (mg·L−1) 0.03 (< 0.01) 0.07 (0.01)* 0.02††
Turbidity (NTU) 13.0 (2.2) 13.1 (2.2) -
Total organic carbon (mg·L−1) 2.3 (0.2) 3.1 (0.4)* 0.66
Chloride (mg·L−1) 5.6 (0.3) 17.9 (4.3)* 6.5††
Dissolved oxygen (mg·L−1) 8.0 (0.5) 8.0 (0.5) -
pH 7.3 (0.1) 7.4 (< 0.1) -
Conductivity (μS·cm−1) 163 (19) 264 (54)* 92
Temperature (˚C) 18.4 (1.6) 18.8 (1.5) -
*Asterisks denote a significant difference between upstream and downstream mean values for the same water quality parameter; † Least significant diference at the
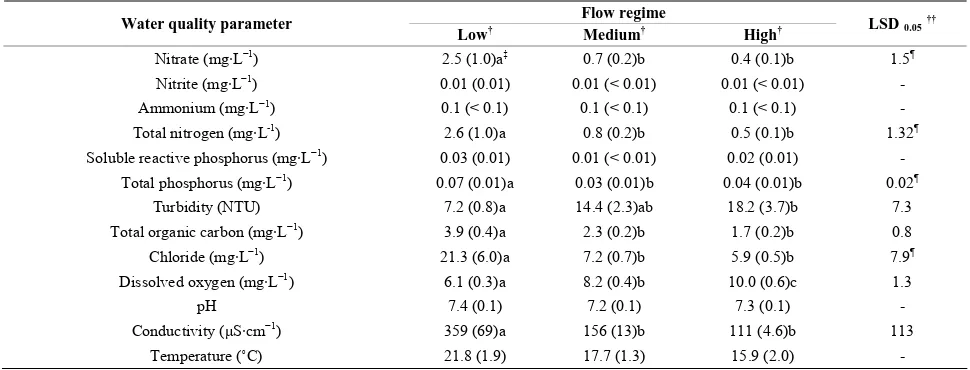
[image:10.595.54.540.539.700.2]Table 4. Summary of the effect of flow regime (i.e., Low, Medium, and High), averaged across sites, on water quality pa-rameters measured upstream and downstream of the wastewater treatment plant discharge into the White river in Fayetteville, AR. Mean values are reported with standard errors in parentheses.
Flow regime Water quality parameter
Low† Medium† High† LSD0.05††
Nitrate (mg·L−1) 2.5 (1.0)a‡ 0.7 (0.2)b 0.4 (0.1)b 1.5¶
Nitrite (mg·L−1) 0.01 (0.01) 0.01 (< 0.01) 0.01 (< 0.01) -
Ammonium (mg·L−1) 0.1 (< 0.1) 0.1 (< 0.1) 0.1 (< 0.1) -
Total nitrogen (mg·L-1) 2.6 (1.0)a 0.8 (0.2)b 0.5 (0.1)b 1.32¶
Soluble reactive phosphorus (mg·L−1) 0.03 (0.01) 0.01 (< 0.01) 0.02 (0.01) -
Total phosphorus (mg·L−1) 0.07 (0.01)a 0.03 (0.01)b 0.04 (0.01)b 0.02¶
Turbidity (NTU) 7.2 (0.8)a 14.4 (2.3)ab 18.2 (3.7)b 7.3 Total organic carbon (mg·L−1) 3.9 (0.4)a 2.3 (0.2)b 1.7 (0.2)b 0.8
Chloride (mg·L−1) 21.3 (6.0)a 7.2 (0.7)b 5.9 (0.5)b 7.9¶
Dissolved oxygen (mg·L−1) 6.1 (0.3)a 8.2 (0.4)b 10.0 (0.6)c 1.3
pH 7.4 (0.1) 7.2 (0.1) 7.3 (0.1) -
Conductivity (μS·cm−1) 359 (69)a 156 (13)b 111 (4.6)b 113
Temperature (˚C) 21.8 (1.9) 17.7 (1.3) 15.9 (2.0) -
†
Flow regime categories are defined as follows: Low (< 2.0 m3 s–1), Medium (2.0 – 6.0 m3 s–1), and High (> 6.0 m3 s–1); †† Least significant difference at the
0.05 level (LSD0.05); ‡ Means followed by difference letters in the same row are different at the 0.05 level; Parameter also had significant site x flow regime
interaction.
er than that of Site 1 (Table 1) and ranged from 95 to
1118 μS·cm–1.
3.6. Nutrient Retention, Export and Net Uptake
The White River showed variable retention or export of nutrients across sampling dates and between constituents when reach-level inputs and outputs were evaluated us-ing the retention-coefficient approach. The various forms of N showed retention coefficients ranging from a low of –2.42 to a high of 0.96 for NH4-N, NO3-N + NO2-N, and
TN. Only NH4-N had an average retention coefficient
that was significantly different (i.e., greater) than zero (p
= 0.04), suggesting NH4-N was generally retained or
transformed through the study reach. The other forms of N were, on average, just transported downstream without retention or transformation. The retention coefficients for NO3-N + NO2-N and TN were highly correlated (r = 0.99,
p < 0.001), which is not surprising since NO3-N made up
a large portion on the TN pool. However, NH4-N
reten-tion coefficients were not correlated (p > 0.10) with the
retention coefficients of other N forms within the White River.
Phosphorus retention coefficients within the study reach were just as variable as N forms, ranging from –1.19 to 0.94 for SRP and –0.92 to 0.94 for TP. On av-erage, retention coefficients did not differ from zero, suggesting that minimal retention was occurring. Reten-tion coefficients for SRP and TP were significantly cor-related (r = 0.64, p < 0.01), likely because SRP made up
a large portion of TP in the White River. Total N and P retention coefficients were also correlated (r = 0.52, p =
0.02), suggesting that retention of these two nutrients might be coupled within this study reach.
The calculations of net uptake lengths were not biased by flow through alluvial gravel within the study reach, as may have been the case for retention coefficients that were based on reach-level inputs and outputs. Calculated SNET values showed trends (increasing, decreasing, or
no significant change) in the downstream direction. Net uptake lengths for SRP were significant (p < 0.10) on
five sample dates within the study period, ranging from –8.7 to 7.9 km. Overall, little retention of SRP was oc-curring within the fluvial channel of the White River, suggesting that the study reach was not a consistent sink for SRP. Across these five sampling dates, SRP SNET
was positively correlated to Site 2 SRP concentration (r
= 0.927, p = 0.02) suggesting that as the concentration of
SRP at Site 2 increased, SNET also increased. The study
reach acted as a source of SRP when the effects of the effluent discharge were minimal and observed concen-trations at Site 2 were 0.06 mg·L–1 or less. Net uptake
lengths for SRP were not correlated with any other phy-sio-chemical property measured in the White River. Ta-ble 6 summarizes VF-NET and UNET values for SRP
within the White River.
Net uptake lengths for NO3-N were significant on 10
sampling dates, ranging from –22.1 to 13.1 km. Similar to SRP SNET, NO3-N SNET had some sampling dates
Net Nutrient Uptake in the White River, Northwest Arkansas, Downstream of a Municipal Wastewater Treatment Plant 266
Table 5. Summary of water quality characteristics averaged across all flow regimes and the five downstream study sites in the White river downstream of the wastewater treatment plant discharge in Fayetteville, AR.
Water quality parameter Minimum Maximum Average
Nitrate (mg·L–1) 0.2 12.5 3.2
Nitrite (mg·L–1) < 0.01 0.14 0.04
Ammonium (mg·L–1) 0.01 0.88 0.19
Total nitrogen (mg·L–1) 0.3 11.0 3.1
Soluble reactive phosphorus (mg·L–1) < 0.01 0.32 0.07
Total phosphorus (mg·L–1) < 0.01 0.36 0.10
Turbidity (NTU*) 4.9 49.9 22.1
Total organic carbon (mg·L–1) 0.9 7.5 3.8
Chloride (mg·L–1) 4.8 76.7 30.4
Dissolved oxygen (mg·L–1) 5.1 13.8 8.8
pH 6.4 9.2 7.6
Conductivity (μS·cm–1) 95 1118 330
Temperature (˚C) 7.6 32.9 19.2
* Nephalometric turbidity units (NTU).
Table 6. Summary statistics for mass transfer coefficients (VF-NET) and uptake rates (UNET) for soluble reactive phosphorus
(SRP), ammonium-nitrogen (NH4-N), and nitrate-nitrogen (NO3-N) on sampling dates that demonstrated significant net
nutrient uptake or release in the study reach of the White River, AR downstream of the wastewater treatment plant.
VRRRRF-NETRRRR (m/s) URRRRNETRRRR (mg/mPPPP2PPPP/s)
Nutrient NPPPP† Min Max Average Min Max Average
SRP 5 –7.3E–06 2.7E–05 6.9E–06 –4.4E–04 2.7E–03 7.7E–04
NH4-N 6 3.6E–06 4.0E–05 1.5E–05 2.5E–02 4.1E–01 1.6E–01
NO3-N 10 –1.1E–05 2.3E–05 5.8E–06 –1.9E00 19.4E00 2.6E00
†The number of sampling dates in which nutrient uptake length (S
NET) was significant at p < 0.1.
occurred when biological uptake and denitrification ex-ceeded nitrification rates. Net uptake lengths for NO3-N
were only correlated with turbidity at Site 2 (r = 0.65, p =
0.04), whereas no other measured physio-chemical prop-erty was related to NO3-N SNET. Table 6 summarizes
VF-NET and UNET values for NO3-N across the sampling
dates.
Net uptake lengths for NH4-N displayed less variation
than that for SRP or NO3-N SNET across the sampling
dates, ranging from 5.0 to 14.8 km. When SNET was
significant, uptake lengths were long, but positive, sug-gesting that NH4-N was retained, albeit not efficiently,
within the White River downstream from the effluent discharge. Net uptake lengths for NH4-N were not
sig-nificantly correlated to any physio-chemical property measured downstream from the effluent discharge during this study. Table 6 summarizes VF-NET and UNET values
for NH4-N across the sampling dates.
3.7. Comparison to Other Studies
Effluent chemistry often differs greatly from that in re-ceiving aquatic systems [36], and the effluent discharge
at the White River near Fayetteville, Arkansas had a sig-nificant influence on water chemistry and nutrient trans-port. Despite the large size of the White River (i.e., 5th
order), this effluent discharge at times made up a sub-stantial portion of flow within the study reach during relatively dry summers. Overall, the influence of the ef-fluent discharge on water chemistry was observable across all flow regimes as defined in this study, but was most profound during low-flow conditions (<2 m3·s–1).
Other studies have shown that effluent discharges influ-ence stream water chemistry when the stream flow is dominated by WWTP inputs [7-9,32].
Phosphorus generally travels long distances down-stream from effluent discharges before significant reten-tion occurs, and this observareten-tion is consistent across streams receiving effluent discharge in the Ozark High-lands [6,7,32] and others throughout the USA [12] and the world [8,9]. When significant net retention occurs, SNET distances can reach up to 85 km [12], but most
SNET SRP lengths is less than 20 km [6,7,12,32]. The
[image:12.595.54.552.355.433.2]nates a receiving stream and how much effluent changes concentrations in the receiving stream. At the White River, TP concentrations and transport were similar to SRP, because TP was largely in the soluble-reactive form.
However, some consistencies occur across streams that are effluent dominated to larger rivers where efflu-ents are not a major proportion of discharge within the fluvial channel. For example, both the White River (this study) and other effluent-dominated streams [7,12,32] showed net release of SRP from within the study reaches. Haggard et al. [7] suggested that SRP release occurs
when effluent P concentrations are relatively low, and the SRP concentration in the receiving stream is less than that associated with the sediment equilibrium P concen-trations (EPC0). Ekka et al. [32] showed that sediment
EPC0 are strongly influenced by effluent P inputs, and
that dramatic changes in EPC0 may occur with changes
in effluent P concentrations. It is likely that something similar is happening within the White River downstream of the WWTP input. However, sediment-P interactions might be more complex in the White River because this stream is more turbid relative to other Ozark streams. Thus, dissolved inorganic P (i.e., SRP) transport,
reten-tion and release through the White River might be more complex, for a variety of reasons, than that observed in less turbid streams within the Ozark Highlands.
The White River was less efficient at NH4-N retention
compared to other smaller streams receiving effluent discharge, because NH4-N SNET was 5 km or longer at
the White River compared to less than 1.5 km in smaller systems (eg., Columbia Hollow; Figure 5) [7]. However,
the observation that these stream reaches were a sink for NH4-N (i.e., SNET was positive on all sampling dates) was
consistent across small to large river systems. It is likely that biological transformation (i.e., nitrification) was the
mechanism responsible for NH4-N retention, but
sus-pended and stream-bed sediments can also adsorb NH4-N
from the water column. In contrast, Gibson and Meyer [12] showed that NH4-N release occurred within the
Chattahoochee River downstream from multiple effluent discharges (Figure 5).
The transport of NO3-N downstream from effluent
discharges is complex, because nitrification of reduced N forms within the effluent and the fluvial channel can re-sult in increasing NO3-N concentrations with
down-stream distance [7,8]. In the White River, NO3-N was
significantly retained on half of the sampling dates, while the other dates showed increases in dilution-corrected NO3- N concentrations downstream. The observed
NO3-N dynamics in the White River match that observed
[image:13.595.336.514.84.614.2]at many other streams receiving effluent discharge ( Fig-ure 5), where net NO3-N release occurs as often as net
Figure 5. Comparison of net nutrient uptake lengths (SNET)
for ammonium-nitrogen (NH4-N), nitrate-nitrogen (NO3-N),
Net Nutrient Uptake in the White River, Northwest Arkansas, Downstream of a Municipal Wastewater Treatment Plant 268
NO3-N retention [8,12].
The observation that the White River downstream from this effluent discharge does not efficiently retain nutrients, either SRP or NO3-N, is important because the
end of this study reach is the headwaters of Beaver Lake. Thus, this essentially means that nutrient inputs from this WWTP travel kilometer-scale distances downstream to the reservoir providing drinking water for northwest Ar-kansas. The effluent discharge might actually be influ-encing primary productivity in the headwaters of Beaver Lake because sestonic chlorophyll-a concentrations gen-erally increase with N and P supply [37]. However, the WWTP effluent discharge contributes less than 10% of the annual inputs of TN or TP to Beaver Lake from its watershed [38]. Nutrient transport in streams down- stream effluent discharges often depends on drought conditions [39], and the relative contribution of annual inputs from this WWTP to Beaver Lake will likely be greater during years where annual discharge is less.
4. Conclusions
The WWTP discharge into the White River made up a small fraction of the total river discharge, and the imme-diate dilution of the effluent was apparent by the ob-served changes in water quality during low river dis-charge. This effluent discharge had a significant impact on nutrient concentrations, despite its relatively low con-tribution to river discharge. However, longitudinal pat-terns in nutrient concentrations downstream from the effluent discharge were not as consistent as reported pre-viously for smaller-order rivers where the effluent made up a relatively larger proportion of river discharge. Nutrient retention coefficients were highly variable, and suggested that NO3-N + NO2-N and SRP were, on
aver-age, not retained within the study reach. However, NH4-N was significantly retained within the study, on
average, when evaluating reach level inputs and outputs. Since little nutrient retention occurred in the White River downstream from this effluent discharge, the headwaters of Beaver Lake are likely directly influenced by the WWTP evaluate in this study. The WWTP has relatively low nutrient concentrations in its effluent discharge, but its continual discharge of nutrients to the White River has resulted in little retention within the study reach. Thus, any changes to the effluent nutrient concentrations or loading would likely influence the headwaters of Beaver Lake.
5. Acknowledgements
Beaver Water District and staff are gratefully acknowl-edged for providing the resources to conduct this study. Mindi Crosswhite, Raymond Avery, and Rusty Tate pro-vided invaluable field sampling support and expertise
and Cindy Harp assisted with timely laboratory analyses.
REFERENCES
[1] Arkansas Department of Environmental Quality, “Ar-kansas’s 2008 303(d) List (List of Impaired Waterbod-ies),” 2008. Internet Available:
http://www.adeq.state.ar.us/water/branch_planning/pdfs/3 03d_list_2008.pdfT
[2] D. R. Edwards and T. C. Daniel, “Effects of Poultry Lit-ter Application Rate and Rainfall Intensity on Quality of Runoff from Fescue Plots,” Journal of Environmental Quality, Vol. 22, No. 2, 1993, pp. 361-365.
doi:10.2134/jeq1993.00472425002200020017x
[3] D. R. Edwards, P. A. Moore, J. F. Murdoch and T. C. Daniel, “Quality of Runoff from Four Northwest Arkan-sas Pasture Fields Treated with Organic and Inorganic Fertilizer,” Transactions of the ASAE, Vol. 39, No. 5,
1995, pp. 1689-1696.
[4] T. J. Sauer, P. A. Moore, G. L. Wheeler, C. P. West, T. C. Daniel and D. J. Nichols, “Runoff Water Quality from Poultry Litter-Treated Pasture and Forest Sites,” Journal of Environmental Quality, Vol. 29, No. 2, 2000, pp.
515-521. doi:10.2134/jeq2000.00472425002900020020x
[5] B. C. Menjoulet, K. R. Brye, A. L. Pirani, B. E. Haggard and E. E. Gbur, “Runoff Water Quality from Broi-ler-Litter-Amended Tall Fescue in Response to Natural Precipitation in the Ozark Highlands,” Journal of Envi-ronmental Quality, Vol. 38, No. 3, 2009, pp. 1005-1017.
doi:10.2134/jeq2008.0140
[6] B. E. Haggard, D. E. Storm and E. H. Stanley, “Effect of a Point Source Input on Stream Nutrient Retention,”
Journal of the American Water Resources Association,
Vol. 37, No. 5, 2001, pp. 1291-1299.
doi:10.1111/j.1752-1688.2001.tb03639.x
[7] B. E. Haggard, E. H. Stanley and D. E. Storm, “Nutrient Retention in a Point-Source-Enriched Stream,” Journal of the North American Benthological Society, Vol. 24, No. 1,
2005, pp. 29-47.
doi:10.1899/0887-3593(2005)024<0029:NRIAPS>2.0.C O;2
[8] E. Marti, J. Autmatell, L. Godé, M. Poch and F. Sabater, “Nutrient Retention Efficiency in Streams Receiving In-puts from Wastewater Treatment Plants,” Journal of En-vironmental Quality, Vol. 33, 2004, pp. 285-293.
doi:10.2134/jeq2004.0285
[9] G. C. Merseberger, E. Martí and F. Sabater, “Net Changes in Nutrient Concentrations below a Point Source Input in Two Streams Draining Catchments with Con-trasting Land Uses,” Science of the Total Environment,
Vol. 347, No. 1-3, 2005, pp. 217-229.
doi:10.1016/j.scitotenv.2004.12.022
[10] B. Gücker, M. Brauns and M. T. Pusch, “Effects of Wastewater Treatment Plant Discharge on Ecosystem Structure and Function of Lowland Streams,” Journal of the North American Benthological Society, Vol. 5, 2006, pp. 313-329.
Effluent Dominated Semiarid River: A Conceptual Model of Stream-Aquifer Interactions,” Journal of the American Water Resources Association, Vol. 45, No. 4, 2010, pp.
1047-1062. doi:10.1111/j.1752-1688.2009.00346.x
[12] C. A. Gibson and J. L. Meyer, “Nutrient Uptake in a Large Urban River,” Journal of the American Water Re-sources Association, Vol. 43, No. 3, 2007, pp. 576-587.
doi:10.1111/j.1752-1688.2007.00041.x
[13] S. R. Femmer, “National Water-Quality Assessment Pro-gram Ozark Plateaus Biology Study,” 1995. Internet Available: http://mo.water.usgs.gov/fact_sheets/biology.htm [14] K. R. Brye and C. P. West, “Grassland Management Ef-fects on Soil Surface Properties in the Ozark Highlands,”
Soil Science, Vol. 170, 2005, pp. 63-73.
doi:10.1097/00010694-200501000-00008
[15] H. D. Scott and L. B. Ward, “MLRA 116A Ozark High-lands,” 2006. Internet Available:
http://soilphysics.okstate.edu/S257/book/mlra116a/index. html
[16] National Agricultural Statistics Service—United States Department of Agriculture, “Poultry-Production and Value, 2002 Summary,” 2003. Internet Available:
http://www.usda.mannlib.cornell.edu/usda/nass/PoulProd Va-04-29-2003.pdf
[17] T. J. T. Sims and D. C. Wolf, “Poultry Waste Manage-ment: Agricultural and Environmental Issues,” Advances in Agronomy, Vol. 52, 1994, pp. 1-83.
doi:10.1016/S0065-2113(08)60621-5
[18] University of Arkansas Cooperative Extension Service, “Improving Poultry Litter Management and Carcass Dis-posal,” 2002. Internet Available:
http://www.arnatural.org/environmental_management/eq uip4/fact8.html
[19] N. A. Slaton, K. R. Brye, M. B. Daniels, T. C. Daniel, R. J. Norman and D. M. Miller, “Nutrient Input and Re-moval Trends for Agricultural Soils in Nine Geographic regions in Arkansas,” Journal of Environmental Quality,
Vol. 33, No. 5, 2004, pp. 1606-1615.
doi:10.2134/jeq2004.1606
[20] United States Census Bureau, “2007 Population Esti-mates,” 2010. Internet Available:
http://www.census.gov
[21] Arkansas Department of Environmental Quality, “West Fork White River Watershed Data Inventory and Non-point Source,” 2004. Internet Available:
http://www.adeq.state.ar.us/water/pdfs/West_Fork_White _River_Watershed.pdf
[22] National Oceanic and Atmospheric Administration, “Wash-ington County, Arkansas Climatology,” 2009. Internet Available http://www.srh.noaa.gov/tsa/?n=climo_washington [23] United States Geological Survey, “Precipitation Data for
Site Number 07048600,” 2006. Internet Available: http://waterdata.usgs.gov/nwis/dv?cb_00045=on&format =html&begin_date=2006-01-01&end_date=2007-12-31& site_no=07048600&referred_module=sw
[24] United States Geological Survey, “USGS 07048600 White River near Fayetteville, AR Site Information,”
2006. Internet Available:
HTThttp://waterdata.usgs.gov/nwis/nwismap/?site_no=07 048600&agency_cd=usgs
[25] American Public Health Association—American Water Works Association—Water Environment Federation, “Standard Methods for the Examination of Water and Wastewater,” 21st Edition, American Public Health Asso-ciation, Washington DC, 2005.
[26] American Society for Testing and Materials, “Annual Book of ASTM Standards,” Vol. 11, No. 1, ASTM, Phila-delphia, 2004.
[27] HACH Company, “DR/4000 Spectrophotometer Hand-book,” HACH, Loveland, 1996.
[28] J. D. Newbold, J. W. Elwood, R. V. O’Neill and A. L. Sheldon, “Measuring Nutrient Spiraling in Streams,”
Canadian Journal of Fisheries and Aquatic Sciences, Vol.
38, No. 7, 1981, pp. 860-863. doi:10.1139/f81-114
[29] United States Geological Survey, “River Discharge Data for Site Number 07048600,” 2006. Internet Available: http://waterdata.usgs.gov/nwis/annual?referred_module=s w&site_no=07048600&por_07048600_2=278520,00060, 2,1964,2010&start_dt=1964&end_dt=2006&year_type= W&format=html_table_format=YYY-MM-DD&rdb_co mpresion=file&submitted_form=parameter_selection_list [30] FTN Associates, Ltd., “TMDLs for Turbidity for White
River and West Fork, AR,” 2006. Internet Available: http://www.adeq.state.ar.us/ftproot/Pub/WebDatabases/Perm itsOnline/NPDES/Tech/AR0022373_TMDLS%20forT TH%2Turbidity%20for%20White%20River%20and%20 West%20Fork%20White%20River_20051031.pdf [31] Environmental Protection Agency, “Ambient Water
Quality Criteria Recommendations—Information Sup-porting the Development of State and Tribal Nutrient Criteria—Rivers and Streams in Nutrient Ecoregion XI,” 2000. Internet Available:
http://water.epa.gov/scitech/swguidance/waterquality/stan dards/criteTHria/aqlife/pollutants/nutrient/upload/2007_0 9_27_criteria_nutrient_ecoregions_rivers_rivers_11.pdf [32] S. A. Ekka, B. E. Haggard, M. D. Matlock and I.
Chau-bey, “Dissolved Phosphorus Concentrations and Sedi-ment Interactions in Effluent-Dominated Streams,” Eco-logical Engineering, Vol. 26, 2006, pp. 375-391.
doi:10.1016/j.ecoleng.2006.01.002
[33] N. C. Brady and R. R. Weil, “The Nature and Properties of Soils,” 13th Edition, Prentice Hall, Upper Saddle River, New Jersey, 2002.
[34] A. L. Ludwig, “Periphytic Algae Nutrient Limitation in Streams Draining the Beaver Reservoir Basin, Northwest Arkansas, USA, 2005-2006,” Master’s Thesis, University of Arkansas, Fayetteville, 2007.
[35] T. H. Diehl and W. J. Wolfe, “Suspended-Sediment Con-centration Regimes for Two Biological Reference Streams in Middle Tennessee,” Journal of the American Water Resources Association, Vol. 46, No. 4, 2010, pp.
824-837. doi:10.1111/j.1752-1688.2010.00460.x
Dy-Net Nutrient Uptake in the White River, Northwest Arkansas, Downstream of a Municipal Wastewater Treatment Plant 270
namics in Aquatic Systems: A Review,” Environmental Management, Vol. 44, No. 2, 2009, pp. 205-217.
doi:10.1007/s00267-009-9309-5
[37] B. E. Haggard, T. P. A. Moore Jr., T. C. Daniel and D. R. Edwards, “Trophic Conditions and Gradients of the Headwater Reaches of Beaver Lake, Arkansas,” Pro-ceedings of the Oklahoma Academy of Science, Vol. 79,
1999, pp. 73-84.
[38] B. E. Haggard, P. A. Moore Jr., I. Chaubey and E. H. Stanley, “Nitrogen and Phosphorus Concentrations and
Export from an Ozark Plateau Catchment in the United States,” Biosystems Engineering, Vol. 86, No. 1, 2003, pp. 75-85. doi:10.1016/S1537-5110(03)00100-4
[39] J. Hur, M. A. Schlautman, T. Karanfil, J. Smink, H. Song, S. J. Klaine and J. C. Hayes, “Influence of Drought and Municipal Sewage Effluents on the Baseflow Water Chemistry of an Upper Piedmont River,” Environmental Monitoring and Assessment, Vol. 132, No. 1-3, 2007, pp.