1 23
Annals of Operations Research
ISSN 0254-5330
Ann Oper Res
DOI 10.1007/s10479-019-03223-0
A new VIKOR-based
in-sample-out-of-sample classifier with application in
bankruptcy prediction
1 23
https://doi.org/10.1007/s10479-019-03223-0
S . I . : M O P G P 2 0 1 7
A new VIKOR-based in-sample-out-of-sample classifier
with application in bankruptcy prediction
Jamal Ouenniche1 ·Kais Bouslah2·Blanca Perez-Gladish3·Bing Xu4
© The Author(s) 2019
Abstract
Nowadays, business analytics has become a common buzzword in a range of industries, as companies are increasingly aware of the importance of high quality predictions to guide their pro-active planning exercises. The financial industry is amongst those industries where predictive analytics techniques are widely used to predict both continuous and discrete vari-ables. Conceptually, the prediction of discrete variables comes down to addressing sorting problems, classification problems, or clustering problems. The focus of this paper is on classification problems as they are the most relevant in risk-class prediction in the financial industry. The contribution of this paper lies in proposing a new classifier that performs both in-sample and out-of-sample predictions, where in-sample predictions are devised with a new VIKOR-based classifier and out-of-sample predictions are devised with a CBR-based clas-sifier trained on the risk class predictions provided by the proposed VIKOR-based clasclas-sifier. The performance of this new non-parametric classification framework is tested on a dataset of firms in predicting bankruptcy. Our findings conclude that the proposed new classifier can deliver a very high predictive performance, which makes it a real contender in industry applications in finance and investment.
Keywords In-sample prediction·Out-of-sample prediction·VIKOR classifier·CBR· k-Nearest neighbour classifier·Bankruptcy·Risk class prediction
B
Jamal Ouenniche [email protected]Kais Bouslah
Blanca Perez-Gladish [email protected]
Bing Xu [email protected]
1 Business School, University of Edinburgh, 29 Buccleuch Place, Edinburgh EH8 9JS, UK 2 School of Management, University of St Andrews, Gateway Building, North Haugh, St
Andrews KY16 9RJ, UK
3 Faculty of Economics and Business, University of Oviedo, 33006 Oviedo, Asturias, Spain 4 School of Social Sciences, Heriot-Watt University Edinburgh, Mary Burton Building G.54,
1 Introduction
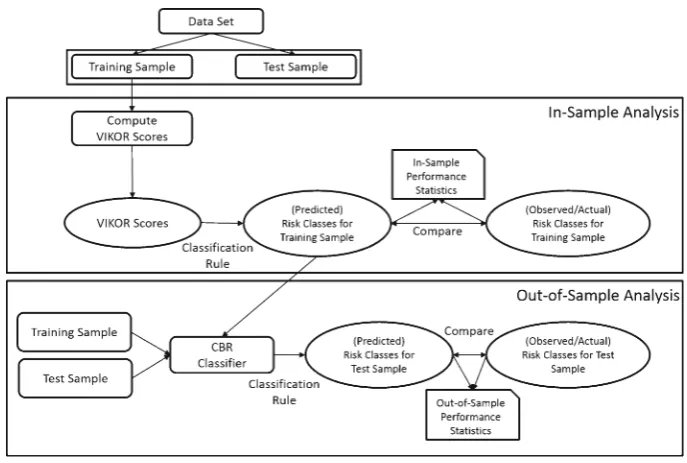
Nowadays, the use of analytical methods in extracting intelligence from data, in general, and business-related data, in particular, to support decision-making is increasing gaining popularity amongst practitioners. The popularity of descriptive analytics techniques, predic-tive analytics techniques, and prescrippredic-tive analytics techniques vary substantially from one industry to another. The financial industry is one amongst many first movers where predic-tive analytics techniques are widely used to predict risk and return amongst other variables that drive investment decision-making. The focus of this paper is on predictive analytics techniques for risk-class prediction. Analytics techniques for risk-class prediction fall into two main categories; namely, parametric methods and parametric methods, where non-parametric prediction methods have obvious advantages over non-parametric ones. In this paper, we extend the toolbox of non-parametric predictive methods by proposing a new integrated classifier that performs both in-sample and out-of-sample predictions, where in-sample pre-dictions are devised with a first VIKOR-based classifier and out-of-sample prepre-dictions are devised with a CBR-based classifier trained on the risk class predictions provided by the proposed VIKOR-based classifier—see Fig.1for a snapshot of the design of the proposed prediction framework.
VIKOR is a multi-criteria method originally designed for ranking a number of alternatives, saym, under multiple non-commensurable (i.e., measured on different scales or in different units) and often conflicting criteria, sayn, where criteria are conflicting in the sense that improving a criterion is only achievable at the expense of at least another criterion; therefore, trade-offs between conflicting criteria is the way to reach an acceptable solution. VIKOR is grounded into compromise programming, as it is designed to devise a solution that is the closest to an ideal one. In sum, VIKOR benchmarks all alternatives against an ideal solution
[image:4.439.47.391.371.602.2]and makes use of the relative closeness, as measured by the Lp distance, from the ideal solution—typically virtual and infeasible—to construct an index for each alternative or entity i, sayQi, which is a convex combination of the standardized distance between entityiand the alternative with the best (observed) average performance and the standardized distance between entityi and the entity with the least (observed) regret. Since the publication of seminal paper by Duckstein and Opricovic (1980), several hundreds of papers were published on VIKOR and its variants. Application papers apart, papers on methodological contributions on the crisp version of VIKOR could be divided into two main categories; namely, VIKOR and variants for multi-criteria decision problems where all alternatives are assessed based on a common set of criteria, and VIKOR and variants for multi-criteria decision problems where different alternatives are assessed based on different sets of criteria. Examples of contributions in the first category include the original VIKOR (Duckstein and Opricovic1980); VIKOR enhanced with Weight Stability Analysis and Trade-offs Analysis (Opricovic and Tzeng 2007); VIKOR with Choiceless and Discontent Utilities (Huang et al.2009); VIKOR with Logic Judgment (Chang2010); and VIKOR for criteria with a Normal Reference Range (Zeng et al.2013). On the other hand, examples of contributions in the second category include the modified VIKOR by Liou et al. (2011) and the modified VIKOR by Anvari et al. (2014). For reviews on VIKOR application areas, we refer the reader to Mardani et al. (2016), Gul et al. (2016), and Yazdani and Graeml (2014).
The remainder of this paper unfolds as follows. In Sect.2, we provide a detailed description of the proposed integrated in-sample and out-of-sample framework for VIKOR-based classi-fiers and discuss implementation decisions. In Sect.3, we empirically test the performance of the proposed framework in bankruptcy prediction of companies listed on the London Stock Exchange (LSE) and report on our findings. Finally, Sect.4concludes the paper.
2 An integrated framework for designing and implementing
VIKOR-based classifiers
In this section, we shall describe our integrated VIKOR-based classification framework—see Fig. 1for a graphical representation of the process. Without loss of generality, we shall customize the presentation of the proposed framework to a bankruptcy application as follows:
Input:A set ofn entities (e.g., LSE listed firm-year observations) to be assessed onm pre-specified criteria (e.g., financial criteria) along with their measures (e.g., financial ratios), where the measure of each criterion could either be minimized or maximized. Thus, each entity, sayi (i 1, . . . ,n), is represented by anm-dimensional vector of (observed) measures of the criteria under consideration, sayxi
xi j
, wherexi jdenote the observed measure of criterion jfor entityiand the set ofxis shall be denoted byX. An observed risk-class membership, sayY, is also available for all entities. The historical sampleXis divided into a training sample, sayXE, and a test sample, sayXT.
2.1 Phase 1: VIKOR-based in-sample classifier
2.1.1 Step 1: Compute the best and worst virtual alternatives or benchmarks
r+j
⎧ ⎨ ⎩
min i1,...,#XEx
E
i,jI F j∈M− max
i1,...,#XEx E
i,jI F j ∈M+
; j1, . . . ,m
and compute the worst virtual alternative—also referred to as the ideal negative alternative, sayr−, as the worst performer on each and every criterionjamongst all alternativesiin the training sampleXE; that is:
r−j
⎧ ⎨ ⎩
max i1,...,#XEx
E
i,jI F j ∈M− min
i1,...,#XEx E
i,jI F j ∈M+
; j 1, . . . ,m
whereM−(resp. M+) denote the set of features for which lower (resp. higher) values are
better, xiE,j denote the observed performance of alternativei ∈ XE on criterion j (j 1, . . . ,m), and #XEdenote the cardinality ofXE. Note that we refer to benchmarksr+and
r−as virtual, because they are not observed as such; in fact, they are made up of the observed best (respectively, worst) performer on each criterion.
2.1.2 Step 2: Compute measures of the average performance behavior of alternatives
For each entityi in the training sampleXE (i 1, . . . ,#XE), compute a measure of its average performance behavior, saySi, which allows for full compensation between criteria, as follows: Si ⎛ ⎜ ⎝ m
j1
⎛ ⎝wj
r+j −xiE,j
r+j −r−j
⎞ ⎠ p⎞ ⎟ ⎠ 1 p
withp1; i.e.,Si m
j1
wj
r+j −xiE,j
r+j −r−j
.
Also, computeS+min
i Si andS
−max
i Si.
Note thatSi is an Lp-metric based aggregation function for p 1 that quantifies how close entityiis from the positive ideal alternative and could be interpreted as a utility function of entityi. Note also that an aggregating function is used here instead of a utility function, because in many multi-criteria decision problems it is not possible to obtain a mathematical
representation of the decision maker’s utility function. Finally, notice that
r+j −xiE,j
r+j −r−j
is the deviation from the best virtual alternative on criterion j,
r+j −xiE,j
, standardized by the distance between the best and the worst virtual alternatives on criterion
j,
r+j −r−j
; therefore,Si is the weighted sum over all criteria of standardized deviations from the best virtual alternative, wherewjdenote the weight assigned to criterionj. In sum, Sireflects the average performance behavior of entityi, which allows for full compensation between criteria. SinceSireflects the average performance behavior of entityi,S+min
i Si andS−max
i Si are the best and worst observed average performance behavior across all entities in-sample, respectively. Note thatS+is often interpreted as the maximum group utility
of the “majority”. Leti+ar gmi niSi andi− ar gmaxiSi. Thus,
Si−S+
2.1.3 Step 3: Compute measures of the worst performance behavior of alternatives
For each entityi in the training sampleXE (i 1, . . . ,#XE), compute a measure of its worst performance behavior, sayRi, which does not allow for any compensation between criteria, as follows:
Ri ⎛ ⎜ ⎝ m
j1
⎛ ⎝wj
r+j −xiE,j
r+j −r−j
⎞ ⎠ p⎞ ⎟ ⎠ 1 p
withp ∞; i.e.,Ri max j
⎧ ⎨ ⎩wj
r+j −xiE,j
r+j −r−j
⎫ ⎬ ⎭.
Also, computeR+min
i RiandR
−max
i Ri.
Note thatRiis also anLp-metric based aggregation function withp ∞that quantifies how far, in the extreme case, entityi is from the positive ideal alternative and could be interpreted as a regret function of entityi. In fact, unlikeSi,Ri is the maximum over all criteria of the weighted standardized deviations from the best virtual alternative and thus reflects the worst performance behavior of entityi. Note also thatRidoes not allow for any compensation between criteria. Since Ri reflects the worst performance behavior of entity i,R+min
i Ri andR
− max
i Ri represent the least and most observed individual regrets amongst all entities in-sample, respectively. Leti++ar gmi niRiandi−−ar gmaxiRi. Thus,Ri−R+
/R−−R+is the distance between entityi and the observed entity with the least regret; i.e., entityi++, standardized by the distance between the observed entities
with the least and the most regrets; i.e., entitiesi++andi−−, respectively. 2.1.4 Step 4: Compute a VIKOR score for each alternative
For each entityiin the training sampleXE(i 1, . . . ,#XE), compute a performance score, sayQi, which represents a measure of closeness to the positive ideal solution, as a convex combination of the standardized distance between entityi and the alternative with the best (observed) average performance,i+, and the standardized distance between entityiand the entity with the least (observed) regret,i++:
Qi ⎧ ⎪ ⎪ ⎪ ⎪ ⎨ ⎪ ⎪ ⎪ ⎪ ⎩
αSi−S+ S−−S+
+(1−α)
Ri−R+ R−−R+
I F S−S+and R−R+; 0≤α≤1 Ri−R+
R−−R+I F S−S+and R−R+
Si−S+
S−−S+I F S−S+and R−R+
constant I F S−S+and R− R+
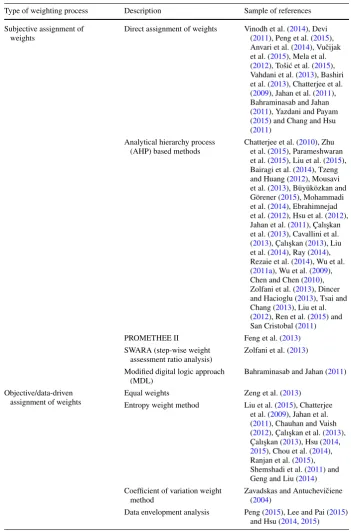
Notice that the definition ofQi allows the user to measure the performance of entities using indexes that capture the extent to which the benchmarking emphasis is put on the best observed performer,i+, the observed performer with the least regret,i++, or a combination between these two extreme behaviors, depending on the value chosen forα. Note that lower values of Q,S, andRrespectively, indicate better performance. Finally, note that the weights assigned to criteria could be chosen in many different ways; we refer the reader to Table1 for a sample of commonly used weighting schema in VIKOR implementations.
2.1.5 Step 5: Compute in-sample classification of alternatives
Table 1Sample of commonly used weighting schema in VIKOR
Type of weighting process Description Sample of references
Subjective assignment of weights
Direct assignment of weights Vinodh et al. (2014), Devi (2011), Peng et al. (2015), Anvari et al. (2014), Vuˇcijak et al. (2015), Mela et al. (2012), Toši´c et al. (2015), Vahdani et al. (2013), Bashiri et al. (2013), Chatterjee et al. (2009), Jahan et al. (2011), Bahraminasab and Jahan (2011), Yazdani and Payam (2015) and Chang and Hsu (2011)
Analytical hierarchy process (AHP) based methods
Chatterjee et al. (2010), Zhu et al. (2015), Parameshwaran et al. (2015), Liu et al. (2015), Bairagi et al. (2014), Tzeng and Huang (2012), Mousavi et al. (2013), Büyüközkan and Görener (2015), Mohammadi et al. (2014), Ebrahimnejad et al. (2012), Hsu et al. (2012), Jahan et al. (2011), Çalı¸skan et al. (2013), Cavallini et al. (2013), Çalı¸skan (2013), Liu et al. (2014), Ray (2014), Rezaie et al. (2014), Wu et al. (2011a), Wu et al. (2009), Chen and Chen (2010), Zolfani et al. (2013), Dincer and Hacioglu (2013), Tsai and Chang (2013), Liu et al. (2012), Ren et al. (2015) and San Cristobal (2011) PROMETHEE II Feng et al. (2013) SWARA (step-wise weight
assessment ratio analysis)
Zolfani et al. (2013)
Modified digital logic approach (MDL)
Bahraminasab and Jahan (2011)
Objective/data-driven assignment of weights
Equal weights Zeng et al. (2013) Entropy weight method Liu et al. (2015), Chatterjee
et al. (2009), Jahan et al. (2011), Chauhan and Vaish (2012), Çalı¸skan et al. (2013), Çalı¸skan (2013), Hsu (2014, 2015), Chou et al. (2014), Ranjan et al. (2015), Shemshadi et al. (2011) and Geng and Liu (2014) Coefficient of variation weight
method
Zavadskas and Antucheviˇciene (2004)
risk (e.g., bankruptcy) classes, sayYˆE. Then, compare the VIKOR based classification of alternatives inXEinto risk classes; that is, the predicted risk classes,YˆE, with the observed risk classes of alternatives in the training sample,YE, and compute the relevant in-sample performance statistics. The choice of a decision rule for classification depends on the nature of the classification problem; that is, a two-class problem or a multi-class problem. In this paper, we are concerned with a two-class problem; therefore, we shall provide a solution that is suitable for these problems. In fact, we propose a VIKOR score-based cut-off point procedure to classify entities inXE. The proposed procedure involves solving an optimization problem whereby the VIKOR score-based cut-off point, sayκ, is determined so as to optimize a given classification performance measure, sayπ(e.g., Type I error, Type II error, Sensitivity, Specificity), over an interval with a lower bound, sayκL B, equal to the smallest VIKOR score of entities in XE and an upper bound, sayκU B, equal to the largest VIKOR score of entities in XE. Any derivative-free unidimensional search procedure could be used to compute the optimal cut-off score, sayκ∗—for details on derivative-free unidimensional search procedures, the reader is referred to Bazaraa et al. (2006). The optimal cut-off score
κ∗is used to classify observations inX
Einto two classes; namely, bankrupt and non-bankrupt firms. To be more specific, the predicted risk classesYˆEare determined so that firms with VIKOR scores greater thanκ∗are assigned to a bankruptcy class and those with VIKOR scores less than or equal toκ∗are assigned to a non-bankruptcy class. Note that an important feature of the design of our VIKOR score-based cut-off point procedure for classification lies in the determination of a cut-off score to optimise a specific performance measure of the classifier.
2.2 Phase 2: CBR-based out-of-sample classifier
2.2.1 Step 6: Compute out-of-sample classification of alternatives
We would like to stress out that, when the decision maker is not confident enough to provide a value forα in step 5, one could automate the choice ofα. In fact, an optimal value ofαwith respect to a specific performance measure (e.g., Type 1 error, Type 2 error, Sensitivity, or specificity) to be optimized either in-sample only or both in-sample and out-of-sample could be obtained by using a derivative-free unidimensional search procedure, which calls either a procedure that consists of steps 4 and 5 to optimize in-sample performance, or a procedure that consists of steps 4 to 6 to optimize both in-sample and out-of-sample performances simultaneously.
Finally, note that VIKOR outcome depends on the choice of the ideal solution, whose calculation depends on the given set of alternativesXE. Therefore, inclusion or exclusion of one or several alternative; e.g.,XT, would affect the VIKOR outcome unless the ideal solution is chosen or fixed at the outset by the decision maker independently fromXE. This is the main reason for choosing a CBR framework for the out-of-sample classification instead of VIKOR.
In the next section, we shall report on our empirical evaluation of the proposed VIKOR-CBR integrated prediction framework.
3 Empirical results
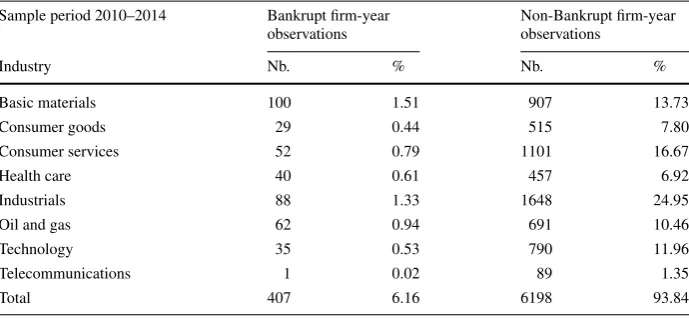
Table 2Dataset composition
Sample period 2010–2014 Bankrupt firm-year observations
Non-Bankrupt firm-year observations
Industry Nb. % Nb. %
Basic materials 100 1.51 907 13.73
Consumer goods 29 0.44 515 7.80
Consumer services 52 0.79 1101 16.67
Health care 40 0.61 457 6.92
Industrials 88 1.33 1648 24.95
Oil and gas 62 0.94 691 10.46
Technology 35 0.53 790 11.96
Telecommunications 1 0.02 89 1.35
Total 407 6.16 6198 93.84
Table 3Implementation decisions for VIKOR and k-NN
Decision Options considered and justification, if relevant
VIKOR
Value forα We performed tests forα0,0.25,0.5,0.75,1 Weighting scheme Equal weightswjs
Classification rule VIKOR score-based cut-off point procedure, where the choice of the cut-off point optimises a specific performance measure (i.e., T1, T2, Sen, Spe)
k-NN
Metricdk−N N Euclidean, Cityblock, Mahalanobis
Classification criterion Majority vote. Several criteria could have been used such as a Weighted Vote, but once again our choice is made so as to avoid any personal (subjective) preferences
Size of the neighbourhoodk k3; 5; 7. The results reported are fork3 since higher values delivered very close performances but required more computations
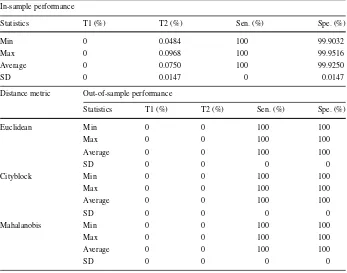
Table 4Summary statistics of the performance of the proposed framework forα 0 (non-compensating scheme)
In-sample performance
Statistics T1 (%) T2 (%) Sen. (%) Spe. (%)
Min 0 0.0484 100 99.9032
Max 0 0.0968 100 99.9516
Average 0 0.0750 100 99.9250
SD 0 0.0147 0 0.0147
Distance metric Out-of-sample performance
Statistics T1 (%) T2 (%) Sen. (%) Spe. (%)
Euclidean Min 0 0 100 100
Max 0 0 100 100
Average 0 0 100 100
SD 0 0 0 0
Cityblock Min 0 0 100 100
Max 0 0 100 100
Average 0 0 100 100
SD 0 0 0 0
Mahalanobis Min 0 0 100 100
Max 0 0 100 100
Average 0 0 100 100
SD 0 0 0 0
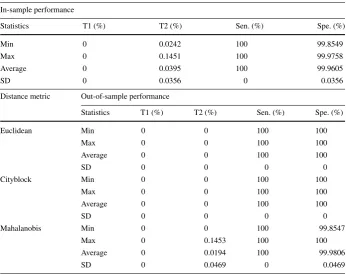
[image:12.439.47.394.283.556.2]Table 5Summary statistics of the performance of the proposed framework forα0.25 (mixed scheme)
In-sample performance
Statistics T1 (%) T2 (%) Sen. (%) Spe. (%)
Min 0 0.0242 100 99.8549
Max 0 0.1451 100 99.9758
Average 0 0.0395 100 99.9605
SD 0 0.0356 0 0.0356
Distance metric Out-of-sample performance
Statistics T1 (%) T2 (%) Sen. (%) Spe. (%)
Euclidean Min 0 0 100 100
Max 0 0 100 100
Average 0 0 100 100
SD 0 0 0 0
Cityblock Min 0 0 100 100
Max 0 0 100 100
Average 0 0 100 100
SD 0 0 0 0
Mahalanobis Min 0 0 100 99.8547
Max 0 0.1453 100 100
Average 0 0.0194 100 99.9806
SD 0 0.0469 0 0.0469
framework. Recall that Taffler’s model makes use of four explanatory variables or bankruptcy drivers which belong to the same category; namely, liquidity. These drivers are current lia-bilities to total assets, number of credit intervals, profit before tax to current lialia-bilities, and current assets to total liabilities. Note that lower values are better than higher ones for Current Liabilities to Total Assets and Number of Credit Intervals, whereas higher values of Current Assets to Total Liabilities and Profit Before Tax to Current Liabilities are better than lower ones. We report on the performance of the proposed framework using four commonly used metrics; namely, Type I error (T1), Type II error (T2), Sensitivity (Sen) and Specificity (Spe), where T1 is the proportion of bankrupt firms predicted as non-bankrupt, T2 is the proportion of non-bankrupt firms predicted as bankrupt, Sen is the proportion of bankrupt firms predicted as bankrupt, and Spe is the proportion of non-bankrupt firms predicted as non-bankrupt.
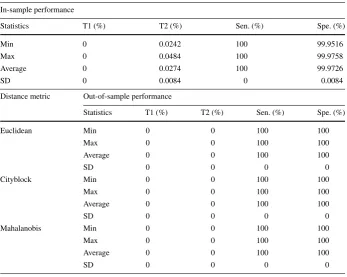
Table 6Summary statistics of the performance of the proposed framework forα0.5 (mixed scheme)
In-sample performance
Statistics T1 (%) T2 (%) Sen. (%) Spe. (%)
Min 0 0.0242 100 99.9516
Max 0 0.0484 100 99.9758
Average 0 0.0274 100 99.9726
SD 0 0.0084 0 0.0084
Distance metric Out-of-sample performance
Statistics T1 (%) T2 (%) Sen. (%) Spe. (%)
Euclidean Min 0 0 100 100
Max 0 0 100 100
Average 0 0 100 100
SD 0 0 0 0
Cityblock Min 0 0 100 100
Max 0 0 100 100
Average 0 0 100 100
SD 0 0 0 0
Mahalanobis Min 0 0 100 100
Max 0 0 100 100
Average 0 0 100 100
SD 0 0 0 0
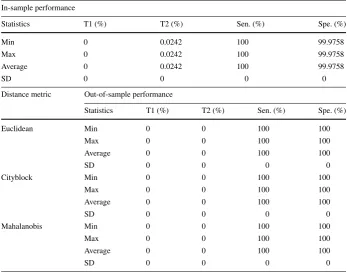
Hereafter, we shall provide a summary of our empirical results and findings. Tables4,5, 6,7and8provide summaries of In-sample statistics on the performance of the MDA model of Taffler (1984) reworked within the VIKOR-CBR framework, which is an integrated In-sample-Out-of-sample framework for VIKOR-based classifiers, forα0,0.25,0.5,0.75,1 respectively. In sum; In-sample performance statistics are reported for different scenarios ranging from a non-compensating scheme (α0) to a fully compensating scheme (α1). Note that a non-compensating scheme does not allow for any compensation between criteria. These results show that the performance of the classifier In-sample is outstanding. In fact, none of the bankrupt firms is misclassified. As to non-bankrupt firms, the misclassification errors are almost zero. For example, 0.075% (i.e., 4) firms are misclassified by VIKOR as compared to 0.26% (i.e., 16) firms misclassified by MDA—see Tables4and9. Notice that, as
αincreases or equivalently compensation between criteria is increased, the misclassification errors tend to zero. This performance could be explained by the fact that the non-compensating scheme is benchmarking each alternativeiagainst the entity with the least regret, whereas the compensating scheme is benchmarking against the best-observed performer.
Table 7Summary statistics of the performance of the proposed framework forα0.75(mixed scheme)
In-sample performance
Statistics T1 (%) T2 (%) Sen. (%) Spe. (%)
Min 0 0.0242 100 99.9516
Max 0 0.0484 100 99.9758
Average 0 0.0274 100 99.9726
SD 0 0.0084 0 0.0084
Distance metric Out-of-sample performance
Statistics T1 (%) T2 (%) Sen. (%) Spe. (%)
Euclidean Min 0 0 100 100
Max 0 0 100 100
Average 0 0 100 100
SD 0 0 0 0
Cityblock Min 0 0 100 100
Max 0 0 100 100
Average 0 0 100 100
SD 0 0 0 0
Mahalanobis Min 0 0 100 100
Max 0 0 100 100
Average 0 0 100 100
SD 0 0 0 0
the average type II error increased from 0 to 0.02% and the average specificity decreased from 100 to 99.98%. These differences in performance are however marginal to recommend that the Mahalanobis distance be avoided in implementing CBR. In sum, the performance of CBR trained on VIKOR classifier’s output is robust to the choice of the distance met-ric.
To conclude, our results suggest that the predictive performance of the proposed classifi-cation framework is by far superior to the predictive performance of multivariate discriminant analysis—see Table8.
4 Conclusions
Table 8Summary Statistics of the Performance of the Proposed Framework forα1(compensating scheme)
In-sample performance
Statistics T1 (%) T2 (%) Sen. (%) Spe. (%)
Min 0 0.0242 100 99.9758
Max 0 0.0242 100 99.9758
Average 0 0.0242 100 99.9758
SD 0 0 0 0
Distance metric Out-of-sample performance
Statistics T1 (%) T2 (%) Sen. (%) Spe. (%)
Euclidean Min 0 0 100 100
Max 0 0 100 100
Average 0 0 100 100
SD 0 0 0 0
Cityblock Min 0 0 100 100
Max 0 0 100 100
Average 0 0 100 100
SD 0 0 0 0
Mahalanobis Min 0 0 100 100
Max 0 0 100 100
Average 0 0 100 100
SD 0 0 0 0
Table 9Summary statistics of the
performance of MDA Statistics T1 (%) T2 (%) Sen. (%) Spe. (%) In-sample performance
Min 97.0500 0.1900 0 99.3700 Max 100 0.6300 2.9500 99.8100 Average 98.8200 0.2600 1.1800 99.7400 SD 0.6700 0.0900 0.6700 0.0900
Out-of-sample performance
Min 0 0 0 0.1500
Max 100 99.8500 100 100
Average 82.2000 17.0100 17.8000 82.9900 SD 37.4300 37.6600 37.4300 37.6600
[image:16.439.167.392.361.513.2]between the positive and negative ideals. These deviations or distances from the positive ideal are then used to compute the distance between the performance behavior of each alter-native and the behavior of the best observed performer, standardized by the distance between the behaviors of the best and worst observed performers, and the distance between the regret behavior of each alternative and the behavior of the observed entity with the least regret, stan-dardized by the distance between the observed entities with the least and the most regrets. A convex combination of these behavioral measures is then used as the VIKOR score. Last, but not least, the basic concepts behind both VIKOR and CBR are easy to explain to managers. We assessed the performance of the proposed VIKOR-CBR framework using a UK dataset of bankrupt and non-bankrupt firms. Our results support its outstanding predictive per-formance. In addition, the outcome of the proposed framework is robust to a variety of implementation decisions; namely, the choice of the value ofα, the choice of the weighting Scheme, and the choice of the classification rule for VIKOR, and the choice of the distance metricdk−N N, the choice of the classification criterion, and the choice of the sizekof the neighbourhood for k-NN instance of CBR. Last, but not least, the proposed classification framework delivers a high performance similar to the DEA-based classifier proposed by Ouenniche and Tone (2017) and the MCDM classifiers proposed by Ouenniche et al. (2018a, b,c).
In sum, this research relates to both the field of MCDM and the field of AI. In fact, this paper proposes a hybrid design that integrates MCDM and artificial intelligence (AI) techniques, where a VIKOR-based classifier is proposed for the first time and the output of VIKOR is used to train a CBR out-of-sample classifier. Empirical evidence supports our claim that the hybridisation of MCDM and AI fields is promising.
Open Access This article is distributed under the terms of the Creative Commons Attribution 4.0 International License (http://creativecommons.org/licenses/by/4.0/), which permits unrestricted use, distribution, and repro-duction in any medium, provided you give appropriate credit to the original author(s) and the source, provide a link to the Creative Commons license, and indicate if changes were made.
References
Anvari, A., Zulkifli, N., & Arghish, O. (2014). Application of a modified VIKOR method for decision-making problems in lean tool selection.The International Journal of Advanced Manufacturing Technology, 71(5–8), 829–841.
Bahraminasab, M., & Jahan, A. (2011). Material selection for femoral component of total knee replacement using comprehensive VIKOR.Materials and Design, 32(8–9), 4471–4477.
Bairagi, B., Dey, B., Sarkar, B., & Sanyal, S. (2014). Selection of robot for automated foundry operations using fuzzy multi-criteria decision making approaches.International Journal of Management Science and Engineering Management, 9(3), 221–232.
Bashiri, M., Mirzaei, M., & Randall, M. (2013). Modeling fuzzy capacitated p-hub center problem and a genetic algorithm solution.Applied Mathematical Modelling, 37(5), 3513–3525.
Bazaraa, M. S., Sherali, H. D., & Shetty, C. M. (2006).Nonlinear programming: Theory and algorithms(3rd ed.). New Jersey: Wiley.
Büyüközkan, G., & Görener, A. (2015). Evaluation of product development partners using an integrated AHP-VIKOR model.Kybernetes, 44(2), 220–237.
Çalı¸skan, H. (2013). Selection of boron based tribological hard coatings using multi-criteria decision making methods.Materials and Design, 50,742–749.
Çalı¸skan, H., Kur¸suncu, B., Kurbano˘glu, C., & Güven, ¸S. Y. (2013). Material selection for the tool holder working under hard milling conditions using different multi criteria decision making methods.Materials and Design, 45,473–479.
Chang, C. L. (2010). A modified VIKOR method for multiple criteria analysis.Environmental Monitoring and Assessment, 168(1–4), 339–344.
Chang, C.-L., & Hsu, C.-H. (2011). Applying a modified VIKOR method to classify land subdivisions accord-ing to watershed vulnerability.Water Resources Management, 25(1), 301–309.
Chatterjee, P., Athawale, V. M., & Chakraborty, S. (2009). Selection of materials using compromise ranking and outranking methods.Materials and Design, 30,4043–4053.
Chatterjee, P., Athawale, V. M., & Chakraborty, S. (2010). Selection of industrial robots using compromise ranking and outranking methods.Robotics and Computer-Integrated Manufacturing, 26(5), 483–489. Chauhan, A., & Vaish, R. (2012). Magnetic material selection using multiple attribute decision making
approach.Materials and Design, 36,1–5.
Chen, J.-K., & Chen, I.-S. (2010). Aviatic innovation system construction using a hybrid fuzzy MCDM model.
Expert Systems with Applications, 37(12), 8387–8394.
Chou, Y.-C., Yen, H.-Y., & Sun, C.-C. (2014). An integrate method for performance of women in science and technology based on entropy measure for objective weighting.Quality and Quantity, 48, 157–172. Devi, K. (2011). Extension of VIKOR method in intuitionistic fuzzy environment for robot selection.Expert
Systems with Applications, 38(11), 14163–14168.
Dincer, H., & Hacioglu, U. (2013). Performance evaluation with fuzzy VIKOR and AHP method based on customer satisfaction in Turkish banking sector.Kybernetes, 42(7), 1072–1085.
Duckstein, L., & Opricovic, S. (1980). Multiobjective optimization in river basin development.Water Resources Research, 16(1), 14–20.
Ebrahimnejad, S., Mousavi, S., Tavakkoli-Moghaddam, R., Hashemi, H., & Vahdani, B. (2012). A novel two-phase group decision making approach for construction project selection in a fuzzy environment.Applied Mathematical Modelling, 36(9), 4197–4217.
Feng, Y.-X., Gao, Y.-C., Song, X., & Tan, J.-R. (2013). Equilibrium design based on design thinking solving: An integrated multicriteria decision-making methodology.Advances in Mechanical Engineering, 5,125291. Geng, X., & Liu, Q. (2014). A hybrid service supplier selection approach based on variable precision rough set and VIKOR for developing product service system.International Journal of Computer Integrated Manufacturing, 28(10), 1063–1076.
Gul, M., Celik, E., Aydin, N., Gumus, A. T., & Guneri, A. F. (2016). A state of the art literature review of VIKOR and its fuzzy extensions on applications.Applied Soft Computing, 46,60–89.
Hsu, L.-C. (2014). A hybrid multiple criteria decision-making model for investment decision making.Journal of Business Economics and Management, 15(3), 509–529.
Hsu, L.-C. (2015). Using a decision-making process to evaluate efficiency and operating performance for listed semiconductor companies.Technological and Economic Development of Economy, 21(2), 301–331. Hsu, C.-H., Wang, F.-K., & Tzeng, G.-H. (2012). The best vendor selection for conducting the recycled
material based on a hybrid MCDM model combining DANP with VIKOR.Resources, Conservation and Recycling, 66,95–111.
Huang, J.J., Tzeng, G.H., & Liu, H.H. (2009). A revised VIKOR model for multiple criteria decision making-The perspective of regret theory. In Y. Shi et al. (Eds.),Cutting-edge research topics on multiple criteria decision making(pp. 761–768). Berlin: Springer.
Jahan, A., Mustapha, F., Ismail, M. Y., Sapuan, S., & Bahraminasab, M. (2011). A comprehensive VIKOR method for material selection.Materials and Design, 32(3), 1215–1221.
Lee, Z.-Y., & Pai, C.-C. (2015). Applying improved DEA and VIKOR methods to evaluate the operation performance for world’s major TFT–LCD manufacturers.Asia-Pacific Journal of Operational Research,
32(3), Article 1550020.
Liou, J. J., Tsai, C. Y., Lin, R. H., & Tzeng, G. H. (2011). A modified VIKOR multiple-criteria decision method for improving domestic airlines service quality.Journal of Air Transport Management, 17(2), 57–61.
Liu, C.-H., Tzeng, G.-H., & Lee, M.-H. (2012). Improving tourism policy implementation-the use of hybrid MCDM models.Tourism Management, 33(2), 413–426.
Liu, H.-C., You, J.-X., You, X.-Y., & Shan, M.-M. (2015). A novel approach for failure mode and effects analysis using combination weighting and fuzzy VIKOR method.Applied Soft Computing, 28,579–588. Liu, H.-C., You, J.-X., Zhen, L., & Fan, X.-J. (2014). A novel hybrid multiple criteria decision making model
for material selection with target-based criteria.Materials and Design, 60,380–390.
Mardani, A., Zavadskas, E. K., Govindan, K., Amat Senin, A., & Jusoh, A. (2016). VIKOR technique: A systematic review of the state of the art literature on methodologies and applications.Sustainability, 8(1), 37.
Mohammadi, F., Sadi, M. K., Nateghi, F., Abdullah, A., & Skitmore, M. (2014). A hybrid quality function deployment and cybernetic analytic network process model for project manager selection.Journal of Civil Engineering and Management, 20(6), 795–809.
Mousavi, S. M., Torabi, S. A., & Tavakkoli-Moghaddam, R. A. (2013). Hierarchical group decision-making approach for new product selection in a fuzzy environment.Arabian Journal for Science and Engineering, 38(11), 3233–3248.
Opricovic, S., & Tzeng, G. H. (2007). Extended VIKOR method in comparison with outranking methods.
European Journal of Operational Research, 178(2), 514–529.
Ouenniche, J., Bouslah, K., Cabello, J., & Ruiz, F. (2018a). A new classifier based on the reference point method with application in bankruptcy prediction.Journal of the Operational Research Society, 69,1–8. Ouenniche, J., Pérez-Gladish, B., & Bouslah, K. (2018b). An out-of-sample framework for TOPSIS-based classifiers with application in bankruptcy prediction.Technological Forecasting and Social Change, 131,
111–116.
Ouenniche, J., & Tone, K. (2017). An out-of-sample evaluation framework for DEA with application in bankruptcy prediction.Annals of Operations Research, 254(1–2), 235–250.
Ouenniche, J., Uvalle Perez, O. J., & Ettouhami, A. (2018c). A new EDAS-based in-sample-out-of-sample classifier for risk-class prediction.Management Decision, 99,100–101. https://doi.org/10.1108/MD-04-2018-0397.
Parameshwaran, R., Praveen Kumar, S., & Saravanakumar, K. (2015). An integrated fuzzy MCDM based approach for robot selection considering objective and subjective criteria.Applied Soft Computing, 26,
31–41.
Peng, Y. (2015). Regional earthquake vulnerability assessment using a combination of MCDM methods.
Annals of Operations Research, 234(1), 95–110.
Peng, J.-P., Yeh, W.-C., Lai, T.-C., & Hsu, C.-B. (2015). The incorporation of the Taguchi and the VIKOR methods to optimize multi-response problems in intuitionistic fuzzy environments.Journal of the Chinese Institute of Engineers, 38(7), 897–907.
Ranjan, R., Chatterjee, P., & Chakraborty, S. (2015). Evaluating performance of engineering departments in an Indian University using DEMATEL and compromise ranking methods.Opsearch, 52(2), 307–328. Ray, A. (2014). Cutting fluid selection for sustainable design for manufacturing: An integrated theory.Procedia
Materials Science, 6,450–459.
Ren, J., Manzardo, A., Mazzi, A., Zuliani, F., & Scipioni, A. (2015). Prioritization of bioethanol production pathways in China based on life cycle sustainability assessment and multicriteria decision-making.The International Journal of Life Cycle Assessment, 20(6), 842–853.
Rezaie, K., Ramiyani, S. S., Nazari-Shirkouhi, S., & Badizadeh, A. (2014). Evaluating performance of Ira-nian cement firms using an integrated fuzzy AHP–VIKOR method.Applied Mathematical Modelling, 38(21–22), 5033–5046.
San Cristóbal, J. (2011). Multi-criteria decision-making in the selection of a renewable energy project in Spain: The Vikor method.Renewable Energy, 36(2), 498–502.
Shemshadi, A., Shirazi, H., Toreihi, M., & Tarokh, M. J. (2011). A fuzzy VIKOR method for supplier selection based on entropy measure for objective weighting.Expert Systems with Applications, 38(10), 12160–12167.
Taffler, R. (1984). Empirical models for the monitoring of UK corporations.Journal of Banking and Finance,
8(2), 199–227.
Toši´c, N., Marinkovi´c, S., Daši´c, T., & Stani´c, M. (2015). Multicriteria optimization of natural and recycled aggregate concrete for structural use.Journal of Cleaner Production, 87,766–776.
Tsai, P.-H., & Chang, S.-C. (2013). Comparing the Apple iPad and non-Apple camp tablet PCs: A multicriteria decision analysis.Technological and Economic Development of Economy, 19(1), 256–284.
Tzeng, G.-H., & Huang, C.-Y. (2012). Combined DEMATEL technique with hybrid MCDM methods for cre-ating the aspired intelligent global manufacturing and logistics systems.Annals of Operations Research, 197(1), 159–190.
Vahdani, B., Mousavi, S. M., Hashemi, H., Mousakhani, M., & Tavakkoli-Moghaddam, R. (2013). A new compromise solution method for fuzzy group decision-making problems with an application to the contractor selection.Engineering Applications of Artificial Intelligence, 26(2), 779–788.
Vinodh, S., Nagaraj, S., & Girubha, J. (2014). Application of fuzzy VIKOR for selection of rapid prototyping technologies in an agile environment.Rapid Prototyping Journal, 20(6), 523–532.
Vuˇcijak, B., Paši´c, M., & Zorlak, A. (2015). Use of multi-criteria decision aid methods for selection of the best alternative for the highway tunnel doors.Procedia Engineering, 100,656–665.
Wu, H.-Y., Tzeng, G.-H., & Chen, Y.-H. (2009). A fuzzy MCDM approach for evaluating banking performance based on balanced scorecard.Expert Systems with Applications, 36(6), 10135–10147.
Yazdani, M., & Graeml, F. R. (2014). VIKOR and its applications: A state-of-the-art survey.International Journal of Strategic Decision Sciences, 5(2), 56–83.
Yazdani, M., & Payam, A. F. (2015). A comparative study on material selection of microelectromechanical systems electrostatic actuators using Ashby, VIKOR and TOPSIS.Materials and Design, 65,328–334. Zavadskas, E. K., & Antucheviˇciene, J. (2004). Evaluation of buildings’ redevelopment alternatives with an emphasis on the multipartite sustainability.International Journal of Strategic Property Management, 8,
121–128.
Zeng, Q. L., Li, D. D., & Yang, Y. B. (2013). VIKOR method with enhanced accuracy for multiple criteria decision making in healthcare management.Journal of Medical Systems, 37(2), 9908.
Zhu, G.-N., Hu, J., Qi, J., Gu, C.-C., & Peng, Y.-H. (2015). An integrated AHP and VIKOR for design concept evaluation based on rough number.Advanced Engineering Informatics, 29(3), 408–418.
Zolfani, S. H., Esfahani, M. H., Bitarafan, M., Zavadskas, E. K., & Arefi, S. L. (2013). Developing a new hybrid MCDM method for selection of the optimal alternative of mechanical longitudinal ventilation of tunnel pollutants during automobile accidents.Transport, 28(1), 89–96.