ASSESSMENT OF SOIL EROSION AND LAND USE LAND COVER CHANGE USING RUSLE MODEL, GIS
AND REMOTE SENSING: A CASE STUDY OF WOMBEYA WATERSHED, A
1, *
Yared Mesfin and
1Department of Forestry, College of Agriculture and Environmental Science, Arsi University, 2Department of Natural Resource Management
ARTICLE INFO ABSTRACT
Soil erosion is a natural phenomenon, where environmental determinants, such as climate, soil, topography,
system through deforestation, intensive land cultivation, uncontrolled grazing, activities are often accelerating the rate of soil erosion. Spatial and t
cover (LULC) is increasingly recognized as an important driver of environmental change such as soil degradation. Soil erosion models, for instance, RUSLE integrated
spatial distribution of soi
LULC change and soil erosion trends in the applies
erosion has increase
erosion causes exploring other impacts such as c
Copyright©2019, Yared Mesfin and Sisay Taddese. This unrestricted use, distribution, and reproduction in any medium,
INTRODUCTION
Soil erosion is a natural phenomenon, where environmental determinants such as climate, soil, topography,
affect the extent and magnitude of soil loss (Mutua 2006; Butt et al., 2010). Human-induced impacts on the natural system through deforestation, intensive land cultivation, uncontrolled grazing and construction activities are often accelerating the rate of soil erosion (Thomas
Reusing et.al., 2000). The impact and extent of soil erosion is more severe in the developing world (Bayramin
where farmers are highly dependent on subsistence farming (Lulseged and Vlek, 2008). Soil erosion affects soil productivity and soil organic carbon (Quine and Zhang 2002; Cruse and Herndl 2009). Land use/land cover change (LULC) is increasingly recognized as an important driving factor of soil degradation (Ahmet, 2010; Tadesse et al.,
understanding the dynamics and trend of LULC changes provides evidence-based support to improve soil and land management practices (Lu et al., 2004, Cotter
Studies have been demonstrated the stronger impacts of LULC change on soil erosion than rainfall variability (García 2010; Pacheco et al., 2014; Wijitkosum, 2012; Alkharabsheh
et al., 2013) and on the livelihood of the rural community (Gessese, 2018). In Ethiopia, LULC change and the
result on soil erosion have been observed (Tadesse 2018). Soil erosion models such as USLE
ISSN: 0975-833X
Article History:
Received 18th April, 2019
Received in revised form
11th May, 2019
Accepted 24th June, 2019
Published online 31st July, 2019
Citation: Yared Mesfin and Sisay Taddese, 2019. “Assessment of soil erosion and land use land cover change using RUSLE model, GIS and remote sensing: a case study of Wombeya watershed, Awash basin, Ethiopia
Key Words:
Annual rate of change, Changed area, Change extent, LULC, RUSLE, Soil loss.
*Corresponding author: Yared Mesfin
RESEARCH ARTICLE
ASSESSMENT OF SOIL EROSION AND LAND USE LAND COVER CHANGE USING RUSLE MODEL, GIS
E STUDY OF WOMBEYA WATERSHED, AWASH BASIN,
Yared Mesfin and
2Sisay Taddese
Department of Forestry, College of Agriculture and Environmental Science, Arsi University, Resource Management, College of Agriculture and Environmental Science
ABSTRACT
Soil erosion is a natural phenomenon, where environmental determinants, such as climate, soil, topography, and vegetation affect the extent and magnitude of soil loss. Human impact on the natural system through deforestation, intensive land cultivation, uncontrolled grazing,
activities are often accelerating the rate of soil erosion. Spatial and t
cover (LULC) is increasingly recognized as an important driver of environmental change such as soil degradation. Soil erosion models, for instance, RUSLE integrated
spatial distribution of soil loss and identify areas of concern. This study was aimed at assessing the LULC change and soil erosion trends in the Wombeya watershed between 1986 and 2017. This study applies the RUSLE model to explore soil erosion in the watershed. In the last four
erosion has been increased from 146 t ha-1yr-1to 214 t ha-1yr-1. C
increase in the expenses of forest and grassland. However, for the complete understanding of soil erosion causes exploring other impacts such as climate change is essential.
This is an open access article distributed under the Creative Commons medium, provided the original work is properly cited.
Soil erosion is a natural phenomenon, where environmental determinants such as climate, soil, topography, and vegetation affect the extent and magnitude of soil loss (Mutua et al.,
impacts on the natural system through deforestation, intensive land cultivation, uncontrolled grazing and construction activities are often (Thomas et al., 2018; 2000). The impact and extent of soil erosion is more severe in the developing world (Bayramin et al., 2003) where farmers are highly dependent on subsistence farming (Lulseged and Vlek, 2008). Soil erosion affects soil productivity and soil organic carbon (Quine and Zhang 2002; Cruse and Herndl 2009). Land use/land cover change (LULC) recognized as an important driving factor of soil
et al., 2017). Therefore, understanding the dynamics and trend of LULC changes based support to improve soil and land 04, Cotter et al., 2014). been demonstrated the stronger impacts of LULC change on soil erosion than rainfall variability (García-Ruiz 2014; Wijitkosum, 2012; Alkharabsheh 2013) and on the livelihood of the rural community
LULC change and the associated been observed (Tadesse et al.,
USLE and RUSLE
integrated in GIS has been
distribution of soil loss and identify areas of concerns (Bizuwerk et al., 2008, Ioannis
2017; Kayet et al., 2018) and explore soil erosion relation with different factors such as land cover change (Cebecauer and Hofierka, 2008, Wijitkosum 2012).
shifting and creation of active and dead gullies are
across the Wombeya river watershed. Therefore, exploring the spatial and temporal dynamism of land use land
erosion is crucial for sound land use planning and soil and water conservation. Therefore, this study aimed at assessing the LULC change and soil erosion trends of the study area between 1986 and 2017.
MATERIALS AND METHODS
Description of the study area
located in upper part of Awash basin located southeast of Ethiopia covering an area of 1804 Km
experiences bimodal rainfall, the minor rains occur in March and April and major rains from July to Aug
2010). Wombeya watershed elevation ranges between 887 and 3379 meters above sea level (Figure 1). The southern and eastern escarpments of the watershed have higher elevation and covered with trees mainly Eucalyptus and agricultural practices are being incremented on the
the Ethiopia statistics agency
population lives around the watershed estimated to 364,537.
International Journal of Current Research Vol. 11, Issue, 07, pp.5730-5738, July, 2019
DOI: https://doi.org/10.24941/ijcr.35603.07.2019
Assessment of soil erosion and land use land cover change using RUSLE model, GIS and remote sensing:
wash basin, Ethiopia”, International Journal of Current Research, 11, (07), 5730
ASSESSMENT OF SOIL EROSION AND LAND USE LAND COVER CHANGE USING RUSLE MODEL, GIS
WASH BASIN, ETHIOPIA
Department of Forestry, College of Agriculture and Environmental Science, Arsi University,Ethiopia
Environmental Science, Arsi University, Ethiopia
Soil erosion is a natural phenomenon, where environmental determinants, such as climate, soil, vegetation affect the extent and magnitude of soil loss. Human impact on the natural system through deforestation, intensive land cultivation, uncontrolled grazing, and construction activities are often accelerating the rate of soil erosion. Spatial and temporal change of land use/land cover (LULC) is increasingly recognized as an important driver of environmental change such as soil degradation. Soil erosion models, for instance, RUSLE integrated into GIS has used to assess the l loss and identify areas of concern. This study was aimed at assessing the watershed between 1986 and 2017. This study model to explore soil erosion in the watershed. In the last four decades, soil . Crop field and homestead show an the expenses of forest and grassland. However, for the complete understanding of soil
limate change is essential.
Commons Attribution License, which permits
has been used to assess the spatial distribution of soil loss and identify areas of concerns Ioannis et al., 2009; Tadesse et al.,
and explore soil erosion relation with d cover change (Cebecauer and Hofierka, 2008, Wijitkosum 2012). Land use land cover shifting and creation of active and dead gullies are witnessing river watershed. Therefore, exploring the spatial and temporal dynamism of land use land cover and soil erosion is crucial for sound land use planning and soil and water conservation. Therefore, this study aimed at assessing the LULC change and soil erosion trends of the study area
MATERIALS AND METHODS
the study area: The Wombeya watershed is
located in upper part of Awash basin located southeast of Ethiopia covering an area of 1804 Km2. The watershed the minor rains occur in March and April and major rains from July to August (Edossa et al.,
watershed elevation ranges between 887 and above sea level (Figure 1). The southern and eastern escarpments of the watershed have higher elevation and covered with trees mainly Eucalyptus and agricultural practices are being incremented on the hillsides. According to the Ethiopia statistics agency (ESA) (2007) census the population lives around the watershed estimated to 364,537.
INTERNATIONAL JOURNAL OF CURRENT RESEARCH
Figure 1. Location map of Wombeya watershed, southeastern Ethiopia
Methodology
Data acquisition and analysis: RUSLE adapted by (Renard et
al. 1997) is a predecessor of the Universal Soil Loss Equation (USLE) first developed by (Wischmeier and Smith, 1978). RUSLE is an empirical model used to estimate soil loss and identify soil erosion-prone areas based on the climate, topography, soil properties, and land use conditions (Renard et al., 1997). This empirical model equation stated as:
A = R * K * L * S * C * P (1)
Where: A =computed average annual soil loss in t ha-1year-1 R = rainfall-runoff erosivity factor MJ mm t ha-1yr-1 K = soil erodibility factor
L = slope length factor S = slope steepness factor; C = cover management factor and P = conservation practice factor.
A. Erosivity (R) factor: Soil loss is closely related to rainfall partly through the detaching power of raindrops striking the soil surface and partly through the contribution of rain to runoff (Morgan, 1995). According to Hurni, (1985) the R factor value has been calculated using equation 2.
R= -8.12 + 0.562P (2)
P is the mean annual rainfall (mm) for the respective years of (1986, 2000 and 2017) has been obtained from the metrological stations around the study area. P values for 1986, 2000 and 2017 have been computed from the mean precipitation value of the year between 1982 and 2017. Once the mean annual rainfall for each year has been computed the R factor value was calculated using equation 2 and interpolated to the whole watershed using inversed distance weighting method. The metrological data has been collected from four metrological stations across the watershed such are Guna abajama, Metehara, Teferi Birhan, and Welenchiti.
B. Erodability (K) Factor: Renard et al. (1997) describe erodability as the vulnerability and susceptibility of soil type to detachment by erosion. It is determined by the cohesive force between the soil particles and may vary depending on the presence or absence of plant cover, the soil’s water content and the development of its structure (Wischmeier and Smith,
1978). The higher erodibility value implies the vulnerability of the soil to erosion due to rainfall, splash or surface flow (Hudson, 1981). K for each soil types in the watershed has been determined following Stewart et al. (1975), which determines the K value based on soil texture i.e. sand, clay and silty, the percentage of each soil along with organic matter. The soil data for the study area has been extracted from the FAO harmonized world soil database (HWSD), (2012).
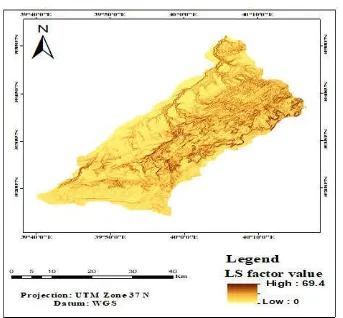
C. Topographic (LS) Factors: The influence of land surface slope (vertical distance/horizontal distance) has a positive impact on the amount of runoff and eroded sediment (Wischmeier and Smith, 1978). Steeper slope accelerates the speed of runoff; consequentially, the amount of sediment would be higher. Slope length is defined as the horizontal distance from the origin of overland flow to the point where deposition begins or where runoff flows into a defined channel (Renard et al., 1997). The slope length and slope steepness can be used in a single index, which expresses the ratio of soil loss as defined by (Wischmeier and Smith, 1978). The LS factor has been calculated using from 30-m resolution DEM data. The L (slope length) and S (slope steepness) factors were calculated using topographic information using formula proposed by McCool et al. (1987) and used in Sharma and Bhadori (2010).
L= (λ/22.13) m (3)
Where: L is slope length factor, λ is field slope length (in m), m is a dimensionless exponent that depends on slope steepness, being 0.5 for slopes exceeding 5%, 0.4 for 4% slopes, and 0.3 for slopes <3%. Digital elevation model (DEM) was used to derive the slope percent. The field slope length (l) determined from 200 m grid size, and the S factor for slope longer than 4 m derived as follows:
S = 10.8sin θ + 0.03 for slope < 9% (4)
S = 16.8sin θ − 0.50 for slope ≥ 9% (5)
discussions to recall about LULC history covering, this approach has been using by (Abate and Angassa 2016, Musa et al., 2018). Furthermore, the possible drivers and consequences of the changes have been also explored using group discussions with local elders and key informants such as agricultural development. The study area was not entirely contained within a single Landsat scene therfore two Landsat images of path 1684 row 54 and path 167 row 54 were mosaicked to get complete coverage of the study area (Table 4). Therefore, six images two for each year was mosaicked and the study area extracted using shapefile. Satellite imagery with minimum (<5%) cloud cover obtained in January and February was used as a source of data for the detection of LULC changes. Thematic Mapper (TM) of Landsat 5 scenes obtained for the 1986, the Enhanced Thematic Mapper Plus (ETM+) of Landsat 7 scenes obtained in 2000 and the Operational Land Imager (OLI) and the Thermal Infrared Sensor (TIRS) of Landsat 8 scene images obtained from USGS website were used (Table 1).The present land-use/cover study used 1986 as the base of the changes in 40 years with comparing 2017 and 2000 image were used to examine the change dynamics. All scenes used in this study were obtained from the website of the U.S. Geological Survey (USGS), Earth Resources Observation and Science (EROS) Center. The LULC change of Wombeya watershed has been explored for the last 40 years; 1986 year has been taken as the baseline to understand the change with respect to 2000 and 2017. The C factor is defined as the ratio of soil loss from land with specific vegetation to the corresponding soil loss from continuous fallow (Wischmeier and Smith, 1978). In this study, the C factor values were derived from different kinds of literature (Table 2). P is the support practice factor which is the ratio of soil loss with a support practice such as contouring, strip cropping, or terracing to reduce soil loss (Renard et al., 1997). The conservation practices factor values depend on the type of conservation measures implemented and require mapping of conserved areas for it to be quantized.
As in the case of Wombeya watershed where data are lacked on permanent management factors or when there were no management practices, P factor values determined by integrating slope and agriculture (Wischmeier and Smith, 1978; Bewket and Teferi 2009). This classifies land use into agricultural and other land use/land cover class and intercepts with a land slope (Table 3). The extracted agricultural land map from the other LULC overlaid with a slope map to produce a P factor map. P factor of land covers other than agricultural land has been assigned to 1 (Tadesse et al., 2018).
In this study C, R and P factors maps of 1986, 2000 and 2017 have been developed, but a single map of K and LS factors map was developed. In order to minimize geo-location errors and to improve the horizontal accuracy, the input factors of RUSLE were co-registered to a common geographic reference. All the layers was projected to WGS84 datum zone 37 N with a grid cell size of 30 meters. Once all the factors had been developed the quantitative output was computed on a pixel-by-pixel base (using raster calculator function) in ArcGIS.
Land cover change analysis: The classified images was
overlaid for change comparison (Lu et al., 2004; Abate and Abate and Angassa, 2016). The amount of changed area (CA), change extent (CE) and the annual rate of change (CR) variables were used to determine the magnitudes of change in terms of LULC. The variables were calculated as follows (Abate and Angassa 2016, Mussa et al., 2017):
CA = TA (t2) -TA (t1) (6)
CE = (CA/TA (t1) * 100 (7)
CR = CE/ (t2-t1) (8)
[image:3.595.69.530.76.157.2]Where TA is a total area, t1 and t2 are the beginning and ending time of the land cover studies.
Table 1. Characteristic of satellite images
Path Row Date of acquisition Sensor Satellite
[image:3.595.167.428.188.250.2]168 54 21 Jan 1986 Thematic Mapper (TM) Landsat 5 167 54 30 Jan 1986 Thematic Mapper (TM) Landsat 5 168 54 13 Feb 2000 Enhanced Thematic Mapper Plus (ETM+) Landsat 7 167 54 06 Feb 2000 Enhanced Thematic Mapper Plus (ETM+) Landsat 7 168 54 10 Jan 2017 Operational Land Imager (OLI) and the Thermal Infrared Sensor (TIRS) Landsat 8 167 54 03 Jan 2017 Operational Land Imager (OLI) and the Thermal Infrared Sensor (TIRS) Landsat 8
Table 2. C factor value for different land use
LULC C factor value References
Forest 0.01 Hurni (1985)
Cultivated land (cereal) 0.15 Hurni (1985)
Homestead 0.99 Eweg and van Lammeren (1996)
Grassland 0.01 Eweg and van Lammeren (1996)
Shrubland 0.01 Hurni (1985)
Table 3. P factor value of Wombeya watershed
Land Use Type Slope (%) P factor
Agricultural Land
0-5 0.11
5-10 0.12
10-20 0.14
20-30 0.22
30-50 0.31
50-100 0.43
[image:3.595.171.431.280.362.2]RESULTS
LULC dynamics in Wombeya watershed: The classification
has been achieved 91% of accuracy in 2017, and 82% and 87% for 1986 and 2000, respectively. Similarly, the Kappa coefficient of 2017 is higher with 0.89 followed by 0.81 for 1986 and 0.86 for 2000. In the last four decades, continuous decreases of forest and grassland have been witnessed. Forest has been decreased by 38% (142 km2) with a 6.8% annual rate of decline. The annual decline of grassland is 2.6% and a total of 54 km2 has been converted to cultivated land mainly (Figure 2 and Table 4). Farmland has been increased significantly with an annual rate of 5.9% and a total of 125 km2 (14%) increases mainly on the expenses of forest mainly (Table 4). Homestead has been also increased steadily from 1986 to 2017. The result obtained from the key informant interview and group discussion have demonstrated the major change with respect to land cover is the conversion of forest and grassland areas to agricultural land and settlement due to urbanization population growth.
CA= Changed area, CE=Change extent, the CR= annual rate of change
Potential Soil loss
Cover and management (C) Factor: Due to the fact that
farmland and homestead are vulnerable to direct rainfall the watershed are being exposed to soil loss in the last four decades. Further, the decline in forest and grassland coverage maximized the rate of soil loss (Table 4 and Figure 2).
Rainfall Erosivity (R) factor: The mean annual rainfall has
been decreased from 1986 to 2017 consequentially the R factor. Yet the highland areas have experienced high erosivity factors (Guna abajama) and low in the lowland areas (Metehara) (Table 5). The mean annual rainfall has been decreasing throughout the study period, consequentially the R factor value. The interpolated R factor value of Guna abajama has been decreased from 764.1 mm ha-1 h-1y-1 in 1986 to 526.3 mm ha-1 h-1y-1 in 2017 (Table 5).
Soil Erodibility (K) factor: 47.2% of the watershed is
dominated by Lithosols (Table 6). According to Stewart et al.,
[image:4.595.58.540.336.771.2](1975) this soil has moderate erodibility characteristics. The soil with high erodibility characteristics Eutric Cambisols covers 2.4%.
Topographic (LS) factors: The topographic factor ranges between 0 and 69.4 High impacts of topography has been observed along the gorges and mountains of the watershed (Figure 3).
Supporting conservation practice (P) factor: In the recent
year's settlement and Agricultural practices are experienced in the steeper slope of the watershed. Farming at elevation 30 to 50 percent was not practiced in 1986 but in 2000 it has been cultivated and intensified in 2017. This intensifies soil erosion rate (Table 7).
Estimated soil loss in the Wombeya watershed: The result
shows that soil loss in the Wombeya watershed has been
[image:5.595.40.553.82.162.2]increased throughout the period. In the 1980s estimated soil loss reaches 145.7 t ha-1 yr-1 and in 2000 and 2017 the estimated soil loss reaches 211.8 t ha-1yr-1 and 214.2 t ha-1yr-1, respectively (Figure 4). The mean annual soil loss has been also increased from 19 t ha-1yr-1 in 1986 to 25 t ha-1yr-1 and 40 t ha-1yr-1 in the 2000 and 2017 respectively. This exemplifies the increasing of soil erosion which was mainly associated with LULC cover change and poor soil and water conservation practices. The local community has also stressed the continuous grawth of agriculture and LULC changes are the main cause for the increase in soil loss. However, the extent of severing soil loss has been declined from 1986 to 2017 (Figure 4), this is due to the recent soil and water conservation practices implemented throughout the country.
Table 4. Area coverage, the rate of LULC changes between 1986 and 2016 and C factor value of Wombeya watershed.
Land use 1986 2000 2017 1986-2000 2000-2017 1986-2017 C factor value
Km2 Km2 Km2 CA km2 CE(%) CR(%) CA km2 CE(%) CR(%) CA km2 CE(%) CR(%)
Grassland 103 97 49 -6 -5.8 -0.4 -48 -49.4 -2.9 -54 -52.4 -2.6 0.01
Farmland 892 966 1017 74 8.3 0.6 51 5.3 0.3 125 14.0 5.9 0.15
Forest 365 271 223 -94 -25.8 -1.8 -48 -17.7 -1.0 -142 -38.9 -6.8 0.01
Homestead 246 267 304 21 8.5 0.6 37 13.9 0.8 58 23.6 2.8 0.99
Shrub land 198 203 211 5 2.5 0.2 8 3.9 0.2 13 6.6 0.6 0.02
Total area 1804 1804 1804 - - - -
[image:5.595.161.434.202.266.2]CA= Changed area, CE=Change extent, the CR= annual rate of change
Table 5. Mean annual rainfall and R factor value of Wombeya watershed
Stations 1981-1986 1986-2000 2000-2017
Mean R value Mean R value Mean R value
Guna abajama 1374.8 764.1 1300.48 772.8 950.9 526.3
Metehara 445.8 242.4 514.2 280.9 486.5 265.3
Teferi birhan 1000.4 554.1 989.4 547.9 824.4 455.2
Welenchiti 893.4 493.9 895.7 495.3 868.9 480.2
[image:5.595.164.430.300.417.2](Source: NMA, Data compiled by the authors, 2017)
Table 6. Soil type and K factor value of Wombeya watershed
Soil type Coverage K factor value
Km2 %
Chromic Cambisols 203 11.2 0.28
Chromic Luvisols 17 0.9 0.28
Chromic Vertisols 19 1.1 0.24
Eutric Cambisols 43 2.4 0.34
Eutric Nitosols 58 3.2 0.14
Lithosols 852 47.2 0.2
Orthic Luvisols 385 21.3 0.05
Pellic Vertisols 117 6.5 0.24
Vertic Cambisols 113 6.3 0.24
Total 1,807
Table 7. P factor value and area coverage
Slope 1986 2000 2017 P factor value
Km2 % Km2 % Km2 %
0-5 476 26.3 498 27.6 504 27.9 0.11
5-10 249 13.8 273 15.1 296 16.4 0.12
10-20 133 7.4 149 8.2 155 8.6 0.14
20-30 34 1.9 46 2.5 51 2.8 0.22
30-50 - - - 11 0.6 0.31
Other land use 915 50.6 841 46.5 790 43.7 1.00
Table 8. Soil loss severity extent of Wombeya watershed
Soil erosion severity (t/ha/yr)
Severity class
1986 2000 2017
Km2 % Km2 % Km2 %
<12 Low 1265 70.0 1017 56.3 1001 55.4
12-25 Moderate 127 7.0 543 30.0 626 34.6
25-50 High 8 0.4 48 2.7 45 2.5
50-80 Very high 32 1.8 14 0.8 11 0.6
80-125 Severe 304 16.8 73 4.0 31 1.7
[image:5.595.164.432.442.521.2] [image:5.595.159.434.550.632.2]Figure 3. LS factor map of Wombeya watershed
Soil erosion severity across Wombeya watershed: Following Bewket and Teferi (2009) soil loss severity classification in the Wombeya watershed most parts are lies in the low severity (tolerable soil loss class) i.e. 70% in 1986, 56.3% in 2000 and 55.4% in 2017. Yet, the extent of low soil loss shows a decline throughout the period and an increase of moderate soil loss areas. (Table 8).
DISCUSSION
The conversion of woodland/forest and grassland areas to homestead and cropland has been observed in the Wombeya watershed, similar findings have been observed in the Abaya Chamo basin (WoldeYohannes et al., 2018) and Yezat watershed Abay basin (Tadesse et al., 2017). According to Mussa et al. (2017), WoldeYohannes et al. (2018) and Teka et al., (2018) the main driving forces for LULC change are population grawth, regime changes in the late 1980s and conversion of forest land to cash crop fields and clearing of trees for charcoal. Invasive species have also a significant impact on LULC change (WoldeYohannes et al., 2018). Tsegaye et al. (2010) stated the intense livestock brawsing results on the decline of woody plant species, indicating the severity of land cover degradation. The main effect for soil erosion is LULC changes, and soil loss is intense in steeper slope and open lands (Thomas et al., 2018, Tadesse et al.,
2017, Sisay et al., 2014). The volume of soil loss is high in the steeper and open areas of the Wombeya watershed. RUSLE is the most commonly applied soil loss estimation model (Erol et al., 2015; Hasan et al., 2012; Wang et al., 2013; Ganasri and Ramesh, 2016, Ahmet, 2014, Tadesse et al., 2017). It has been adapted to Ethiopian condition by Hurni (1985). Moreover, RUSLE model strength lies in giving predicted soil loss using limited information, especially in developing countries where data are scarce (Gebreyesus and Kirubel, 2009). Increment of the crop field and homestead intensifies the trend of soil erosion in the Wombeya watershed. Emre et al. (2018) study on the Maritsa, Mediterranean Basin demonstrated the adverse impact of land cover change on soil erosion and agricultural production. According to water and land research center (WLRC) (2016) between 1973 and 2015 removal of vegetation in the bale eco-region, Ethiopia intensifies soil loss. High soil loss is mainly from poor vegetation cover areas and steeper slope (Sisay et al., 2014). However, due to the recent soil and water conservation practices, soil erosion severity has been decreased in the Wombeya watershed. Similar results have been also noted by Tezera et al., (2016) in Anti tide watershed, Ethiopia and by Emre et al., (2018) in Maritsa Basin, Mediterranean Basin. The contribution of farmers in mitigating soil loss from agricultural land is vital but lacks technical support and fund are hindering their positive impacts (Adugna
et al., 2015). Further, securing land tenure has a positive impact on the conservation of soil erosion by creating a sense of ownership (Abate, 2011; Tsue et al. 2014; Rabia 2012). The estimated annual soil loss in Ethiopia due to erosion is 1.5 billion ton of which 50% occurs in cropland (Assefa and Bork, 2015). Agricultural productivity of Ethiopia is adversely affected by soil erosion (Gelagay and Minale, 2016; Tamene et al., 2006), consequentially farmer’s food security (Deresa and Legesse, 2015). Soil erosion causes a decline in crop yields by reducing rooting depth, soil water holding capacity and depletion of soil organic matter and nutrients which eventually causes soil acidity (WLRC, 2016).
Conclusion
Forest in the Wombeya watershed has been declined in the study time period i.e. 365 in 1986 to 223 in 2017 similarly grassland declines from 103 km2 in 1986 to 49 km2 2017. On the other hand, homestead increased from 256 km2 in 1986 to 304 km2 in 2017 and farmland incremented from 892 km2 in 1986 to 1017 km2 in 2017. Soil loss in the Wombeya watershed has been increased from 146 t ha-1yr-1 in 1986 to 214 t ha-1yr-1 in 2017. LULC change is accelerating soil erosion in the study area. In the recent year, soil loss increment is low i.e. only 3 t ha-1yr-1 between 2011 and 2017 this could be the attribute of better soil and water conservation practices. Yet, forest clearing for crop field and conversion of grassland to homestead along with population growth played a vital role in intensifying soil erosion. The findings of such research will
contribute to developing future watershed resources
management strategies in response to sustainable land management. Soil erosion is the most serious causes of land degradation that influence tremendous pressure on productivity
and environmental resilience. Beside LULC other
anthropogenic activities such as climate change might cause direct and indirect effects on soil erosion at various scales. Therefore, assessing the impact of climate change on soil erosion is often necessary to get the full figure of soil erosion causes.
Funding: The fund was provided by Arsi University
Conflict of interest: There is no any conflict of ineret
Acknowledgment: We are grateful forArsi University for the
financial and logistic support.
REFERENCES
Abate and Angassa, 2016. Conversion of savanna rangelands to bush dominated the landscape in Borana, Southern Ethiopia. Ecological Processes, 5(6):1-18.
Abate S. 2011. Estimating soil loss rates for soil conservation planning in the Borena Woreda of South Wollo Highlands, Ethiopia. J Sustain Dev Afr., 13(3):1–20.
Adugna A., Abegaz A., Cerdà A. 2018. Soil erosion assessment and control in Northeast Wollega, Ethiopia. Solid Earth Discuss 7, 3511–3540.
Ahmet K. 2010. Estimation of C factor for soil erosion
modeling using NDVI in Buyukcekmece watershed. Ozean
Journal of Applied Sciences,3(1):77-85.
Assefa E., Bork H. R. 2015. Farmers' perception of land degradation and traditional knowledge in Southern Ethiopia-resilience and stability. Land Degradation and Development, 27(6), 1552-1561.
Bayramin I, Dengiz O, Baskan O, Parlak M. 2003. Soil erosion risk assessment with ICONA model; case study: Beypazarı Area. Turkish Journal of Agriculture and Forestry, 27:105-116.
BCEOM. 1998. Abay River Basin Integrated Development Master Plan, Main Report. Ministry of Water Resources: Addis Ababa.
Bewket W., Teferi E. 2009. Assessment of soil erosion hazard and prioritization watershed, Blue Nile basin, Ethiopia.
Bizuwerk A., Taddese G., Getahun Y. 2010. Application of GIS for Modeling Soil loss rate in Awash River Basin, Ethiopia. International Livestock Research Institute (ILRI). Ethiopia.
Butt, M.J., Waqas, A., Mahmood, R., CSHRG, 2010. The combined effect of vegetation and soil erosion in water resource management. Water Resources Management, 24 (13):3701-3714.
Cebecauer T., and Hofierka J. 2008. The consequences of land-cover changes on soil erosion distribution in Slovakia.
Geomorphology, 98:187 –198.
Congalt R., and Green K., 1999. Assessing the accuracy of remotely sensed data. Principles and practices. Lewis Publishers, Boca Rat, 137
Cotter M. Berkhoff, K. Gibreel, T. Ghorbani, A. Golbon, R. Nuppenau, E.A. Sauerborn, J. Designing, 2014. A sustainable land use scenario based on a combination of ecological assessments and economic optimization. Ecol. Indic., 36:779–787.
Cruse, R. M., Herndl, C. G. 2009. Balancing corn stover harvest for biofuels with soil and water conservation.
Journal of Soil and Water Conservation, 64:286–291 CSA (Central Statistical Authority of Ethiopia) 2007. Report
of population and housing census. Addis Ababa, Ethiopia. Addis Ababa, Ethiopia.
Deresa, Legesse, 2015. Cause of Land Degradation and Its Impacts on Livelihoods of the Population in Toke Kutaye Woreda. International Journal of Scientific and Research Publications, 5(5):1–9.
Edossa, M., Singh B., Ashim Das G. 2010. Drought Analysis in the Awash River Basin, Ethiopia. Water Resour Manage, 24:1441–1460
Emre Ozsahin, Umit Duru, Ilker Eroglu, 2018. Land Use and Land Cover Changes (LULCC), a Key to Understand Soil Erosion Intensities in the Maritsa Basin. Water 103:1–15. Erol, A., Koşkan, Ö., and Başaran, M. A. 2015.
Socioeconomic modifications of the universal soil loss equation. Solid Earth, 6:1025–1035.
Eweg, H. P. A. and Van Lammeren, R. 1996. The Application of a Geographical Information System to the Rehabilitation of Degraded and Degrading Areas. A case study in the Highlands of Tigray, Ethiopia, Centre for Geographical
Information Processing, Wageningen Agricultural
University, Wageningen
FAO 2012. Harmonized soil databases. Accessed on October 2017.
Ganasri, B. P., Ramesh H., 2016. Assessment of soil erosion by RUSLE model using remote sensing and GIS - A case study of Nethravathi Basin. Geoscience Frontiers, 7, 953– 961.
García-Ruiz, J. M. 2010. The effects of land use on soil erosion in Spain: A review. Catena, 81(1):1–11.
Gebreyesus B, Kirubel M. 2009. Estimating Soil Loss Using Universal Soil Loss Equations (USLE) for Soil Conservation Planning at Medego Watershed, Northern Ethiopia. J. Am. Sci., 5(1):58-69.
Gelagay S., Amare M. 2016. International Soil and Water Conservation Research Soil loss estimation using GIS and Remote sensing techniques : A case of Koga watershed, Northwestern Ethiopia. International Soil and Water Conservation Research, 4(2), 126–136.
Hudson NW. 1981. Soil Conservation. Batsford. London. Hurni, 1985. Erosion Productivity - Conservation Systems in
Ethiopia. In Proc. 4th International Conference on Soil Conservation 654-674. Maracay, Venezuela.
Jensen, J. R. 2003. Introductory Digital Image Processing, a Remote Sensing Perspective.3rd edition. 505–50
Kayet N., Pathak K., Chakrabarty A., Sahoo S. 2018. Evaluation of soil loss estimation using the RUSLE model
and SCS-CN method. International Soil and Water
Conservation Research, 6: 31-42.
Lillesand M., Kiefer R.W. 2004. Remote Sensing and Image Interpretation. Fourth Edition. John Willy & Sons Inc. Newark, Chechister, Wenheim, Brisbane, Singapore, and Toronto.
Lu D., Mausel P., Brondi ́Zio E., Moran E. 2004. Change detection techniques. International Journal of Remote Sensing, 25 (12):2365–2407.
Lulseged T., Vlek G L P. 2008. Soil Erosion Studies in Northern Ethiopia. Springer Science Business Media B.V. McCool, D. K., Foster, G. R., Mutchler, C. K. and Meyer, L.
D. 1987. Revised slope steepness factor for the universal soil loss equation. Transactions of the ASAE, 30:1387– 1396.
Morgan, R.P.C. 1995. Soil Erosion and Conservation. Edinburgh. Addison-Wesley Longman
Mussa M., Teka H. and Mesfin Y. 2017. Land use/cover change analysis and local community perception towards land cover change in the lowland of Bale rangelands, Southeast Ethiopia. International Journal of Biodiversity and Conservation, 9(12):363-372.
Mutua B.M., Klik A., Loiskandl W. 2006. Modelling soil erosion and sediment yield at a catchment scale: the case of
Masinga catchment, Kenya. Land Degradation &
Development, 17(5):557-570.
Pacheco F. L., Varandas S. G. P. Sanches Fernandes L. F., Valle R. F., 2014. Soil losses in rural watersheds with environmental land use conflicts. The Science of the Total Environment, 485(486):110–20.
Quine TA, Zhang Y. 2002. An investigation of spatial variation in soil erosion, soil properties, and crop production within an agricultural field in Devon, United Kingdom. Journal of Soil and Water Conservation, 57:55– 65.
Rabia AH. 2012. Mapping Soil Erosion Risk Using RUSLE, GIS and Remote Sensing, The 4th International Congress of ECSSS, EUROSOIL 2012 “soil science for the benefit of mankind and environment” 1082, 2-6 June, Bari, Italy. Renard K.G., G.R. Foster, G.A. Weesies, D.K. McCool, D.C.
Yoder, 1997. Predicting soil erosion by water: a guide to conservation planning with the Revised Universal Soil Loss Equation (RUSLE). Agriculture Handbook No. 703. Agricultural Research Service, Washingt, DC.
Reusing, M., T. Schneider, U. Ammer, 2000. Modeling Soil Loss rates In the Ethiopian highlands by Integration of High-Resolution MOMS-02/D2-Stream-data in a GIS. Int. Journal of Remote Sensing, 21 (9):1885-1896.
Sharma A., P.B.S. Bhadoria, 2010. Effect of land use land cover change on soil erosion potential in an agricultural watershed. Environmental Monitoring and Assessment, 173, 789–801.
Shi Z.H., Cai C.F., Ding S.W., Wang T.W., Chow T.L. 2003. Soil conservation planning at the small watershed level using RUSLE with GIS: a case study in the Three Gorge Area of China. Catena 55:33–48.
Sisay A., Chalie N., Girmay Z., Takele G., Tolera A. 2014. Landscape-scale Soil Erosion Modeling and Risk Mapping of Mountainous areas in Eastern Escarpment of Wondo
Journal of Agricultural Science and Soil Science, 4(6): 107–116.
Stewart, B. A., Woolhiser, D. A., Wischmeier, W. H., Caro, J. H. and Freere, M. H. 1975. Control of water pollution from cropland. Vol. I, Report EPA-600. US Environmental Protection Agency, Washingt DC, USA.
Tadesse L., Suryabhagavan, K V., Sridhar, Legesse, G. 2017. Land use and land cover changes and Soil erosion in Yezat Watershed, North Western Ethiopia. International Soil and Water Conservation Research, 5:85-94.
Tamene, L. and Vlek, P. L. G. 2007. Assessing the potential of changing land use for reducing soil erosion and sediment yield of catchments: a case study in the highlands of northern Ethiopia. Soil Use and Management, 23:82–91 Tamene, L., S. J. Park , R. Dikau, P.L.G Vlek, 2006. Analysis
of factors determining sediment yield variability in the highlands of Ethiopia. Geomorphology, 76:76-91.
Teka H., Madakadze I.C., Botai O. J., Hassen A., Angassa A., Mesfin Y. 2018. Evaluation of land use land cover changes using remote sensing Landsat images and pastoralists ’perceptions on range cover changes in Borana rangelands, Southern Ethiopia. International Journal of Biodiversity and Conservation, 10(1):1-11.
Tezera, Abrham, Tilashwork Chanie, Tesfaye Feyisa, Abdlesemed Jemal, 2016. Impact Assessment of Land Use/ Land Cover Change on Soil Erosion and Rural Livelihood in Andit Tid Watershed, North Shewa, Ethiopia. Archives of Current Research International, 3(1), 1–10.
Thomas J., Sabu J., Thrivikramji, K. P. 2018. Assessment of soil erosion in a tropical mountain river basin of the
southern Western Ghats, India using RUSLE and GIS.
Geoscience Frontiers, 9:893-906.
Tsegaye D, Moe SR, Vedeld P, Aynekulu E. 2010. Agriculture, Ecosystems and Environment Land-use cover dynamics in Northern Afar rangelands, Ethiopia. Agric. Ecosyst. Environ., 139:174- 180.
Tsue, P. T., Nweze, N. J., Okoye C. U. 2014. Effects of arable land tenure and use on environmental sustainability in
North-central Nigeria. Journal of Agriculture and
Sustainability. 6:14–38.
Wang L., Huang J., Du Y., Hu Y., Han P. 2013. Dynamic Assessment of Soil Erosion Risk Using Landsat TM and HJ Satellite Data in Danjiangkou Reservoir Area, China. Remote Sensing, 5(8):3826-3848.
Water and Land Resource Centre, 2016. BER Eco-Region Degradation Hotspots. Water and Land Resource Centre, Addis Ababa University, Addis Ababa
Wijitkosum, S. 2012. Impacts of land use changes on soil erosion in Pa Deng Subdistrict, the adjacent area of Kaeng.
Soil & Water Res., 2012(1):10–17.
Wischmeier, D.A., Smith, D.D. 1978. Predicting rainfall erosion losses — a guide to conservation planning, USDA, Ag. Hndbk. 537, Science and Education Admin., U.S. Gov. Print. Office, Washingt, D.C.
WoldeYohannes A., Cotter M., Kelboro G., Dessalegn W., 2018. Land Use and Land Cover Changes and Their Effects on the Landscape of Abaya-Chamo Basin Southern Ethiopia. Land., 7(2):1-17.