An Optical Fiber Sensor Probe Using a PMMA/CPR
Coated Bent Optical Fiber as a Transducer for Monitoring
Trace Ammonia
Yu Huang, Shiquan Tao
Department of Mathematics, Chemistry and Physics, West Texas A&M University, Canyon, USA E-mail: stao@wtamu.edu
Received March 26, 2011; revised May 6, 2011; accepted May 26, 2011
Abstract
Ammonia sensors have broad spectrum of applications for industrial process control as well as for environ-mental monitoring. An optical fiber ammonia sensor probe has been developed by using a bent optical fiber having dual poly(methyl methacrylate) (PMMA)/chlorophenol red (CPR) coatings as a transducer. This sen-sor probe was tested for monitoring trace ammonia in gas samples using air as sample matrix. The reaction of ammonia with CPR causes a color change of the reagent, which was detected by using fiber optic evanes-cent wave absorption spectrometry as a sensing signal. By adopting a dual layer coating structure, the sensor probe has faster response compared to a sensor using a broadly accepted sensing reagent-immobilized poly-mer coating structure. The sensor developed in this work is sensitive, has a detection limit of 2.7 ppb NH3 in
air, which is the most sensitive among the reported optical fiber ammonia sensors to the best knowledge of the authors. The sensor is also reversible and has a response time of 25 minutes. The features of high sensi-tivity, reversibility and reasonable response time make this sensor technique very attractive for air quality monitoring.
Keywords:Optical Fiber Chemical Sensor, Ammonia Sensor, Chlorophenol Red, Air Quality Monitoring
1. Introduction
Ammonia is an important substance with broad spectrum of applications ranging from fertilizers to pharmacies, plastics, explosives, textiles, pesticides, dyes and other chemicals. On the other hand, ammonia is also a major air pollutant emitted from agricultural practices, such as fertilizer application, animal feeding. Ammonia is a vo-latile compound. It will partially vaporize to air when applied to soil or generated from fertilizer decomposition. [1,2] In animal feeding practices, ammonia can be emit-ted to air through hydrolysis of urea and microbial breakdown of fecal materials in confinement buildings, on feedlot surfaces, in stockpiles, and in lagoons or run-off retention ponds. Ammonia concentration in cattle feedlots has been reported to be in sub part-per-million (ppm) level, with range from 0.066 ppm to 2.2 ppm ac-cording to published reports. [3-5] Ammonia concentra-tion in poultry house air can be as high as 50 ppm. [6,7] The contribution of NH3 emission from agricultural
ac-tivities to air quality as well as the effect of emitted NH3
to the health of local residents, agricultural workers as well as animals have drawn considerable attentions. This is especially true in recent years due to the fast growth of large scale concentrated animal feeding practices, and the fast urban development, which brought residents closer to animal feedlots. Sensor technologies with capa-bility of continuous real time monitoring of NH3
concen-tration and its spatial distribution are needed for indus-trial process control as well as for air quality monitoring. Presently there are mainly four type gas sensors re-ported for detecting NH3 gas: semiconductor metal oxide
(SMO) sensors, surface acoustic wave (SAW) sensors, optical absorption spectrometric sensors and optical fiber chemical sensors (OFCS). SMO sensors are based on detecting the change of electrical properties, such as re-sistance or capacitance, of a metal oxide film on expo-sure to gas samples containing NH3. [8-10] Films of
tungsten trioxide, [8] tin dioxide, [9] platinum or gold loaded indium oxide [10] have been reported for sensing NH3 gas. The detection limit of these sensors is in ppm
temperatures from 200˚C to 500˚C or even higher. An-other major problem with these NH3 sensing
technolo-gies is that the sensors have cross response to other re-ducing compounds, such as NO, H2S, SO2, CH4, VOCs
as well as to moisture. [8-10] It is very difficult to use these sensors for applications in real world air quality monitoring. SAW sensors are based on detecting the frequency change of SAW resulted from the adsorption of NH3 into an elastic membrane, which is coated on a
piezoelectric crystal. In an SAW sensor, an elastic or-ganic polymer coating is normally used as a transducer. [11-15] A chemical reagent can also be immobilized into the polymer to react/absorb NH3 from gas samples.
Po-lymer coatings used for NH3 sensing include
polyvi-nylidene fluoride, [11] nanoporous alumina. [16] Sensing regents include L-glutamic acid hydrochloride. [13] The problems with SAW sensors are similar to that of SMO sensors, including cross response to other gases and moisture. [14] In addition, SAW sensors’ response also depends on temperatures. [15]
Ammonia molecules in gas phase has finger-print ab-sorption spectra in deep-ultraviolet (UV, 190 nm - 220 nm), near infrared (NIR, 1.53 μm) and infrared (IR, 9.2 μm) wavelength regions, can be detected with optical absorp-tion spectrometric methods. [16-19] However, the optical absorption spectrometric methods in both NIR and IR wavelength regions are not sensitive enough for moni-toring trace ammonia in air samples. For example, it was reported that when a 10-meters sample cell is used, FTIR has a detection limit of 0.77 ppmv for NH3 in gas
sam-ples. [16] A NIR diode laser open-path optical absorption spectrometric method has a absorption path-length up to 1 kilometers can only achieve a 0.70 ppm detection limit. [20] The optical absorption spectrometry in deep-UV region is sensitive for detecting NH3, but has serious
spectral interferences in real world gas sensing applica-tions. [19]
OFCS is a new development in chemical sensing technologies. [21,22] The advantages of OFCS include, but not limited to, high sensitivity and selectivity origi-nated from spectroscopic finger-print identification com-bined with selective chemical reactions, low cost, capa-bility of remote sensing and the formation of sensor networks by using present optical fiber communication technologies, immune of interference from electromag-netic field. OFCS for sensing NH3 gas have been
re-ported. [20,23-25] Most reported OFCS using a sensing reagent-immobilized polymer coating on the surface of an optical fiber core or on the end of an optical fiber as a transducer. The sensitivity of the reported sensors varies from tens part-per-billion (ppb) to ppm, depending on transducer structure design, sensing reagent used.
We report in this paper an optical fiber sensor probe
using a chlorophenol red (CPR) coated bent optical fiber as a transducer for sensing trace NH3. The transducer of
this sensor has dual-layer coatings. A poly(methyl me- thacrylate) (PMMA) membrane is first coated on the surface of a bent optical fiber core. A thin layer CPR is further coated on the surface of the PMMA membrane. Ammonia-spiked air was used as a gas sample in inves-tigating the sensor probe’s response. This sensor probe responded sensitively and reversibly to trace NH3 in air.
It can detect NH3 in air to 2.7 ppb. The high sensitivity
nature makes this sensor technique very attractive for monitoring trace NH3 in ambient air in air quality
re-search.
2. Experimental
2.1. Chemicals
A 64 mM CPR solution was made by dissolving 50 mg CPR (C19H12Cl2O5S, Sigma-Aldrich, St. Louis, MO,
USA) in 2.0 mL acetone (HPLC grade, Sigma-Aldrich). A pure PMMA ((C5H8O2)x) coating solution was
pre-pared by dissolving 25 mg PMMA (Mw 12000, Sigma- Aldrich) in 2.5 mL acetone. Other chemicals used in this work are analytical grade reagents.
2.2. Standard Gas and Air Gas Samples
A 100 ppm NH3 balanced with N2 gas (Airgas South, Inc.
Dallas, TX, USA) was used as an NH3 stock standard gas
sample. Compressed air with about 14% relative humid-ity (RH%) was supplied to our laboratory and was used without further purification. Air gas samples having dif-ferent NH3 concentration were made by diluting the NH3
stock standard gas with compressed air using a multi gas calibrator. The NH3-containing air sample made from the
dilution flowing out of the multi gas calibrator was di-vided to two flowing lines with a “Y” connector as showing in Figure 1. One of the lines was flowing through an ultrasonic humidifier (Crane EE-5301G Ul-trasonic Cool Mist Nursery Humidifier, Crane USA, Bensenville, IL), and water vapor was added to the gas. The humidified gas line was then combined with the second gas line with another “Y” connector. The RH% of the obtained air gas sample can be adjusted by chang-ing the flow rate of the gas flowchang-ing through the humidi-fier while keep the total gas flow rate constant.
2.3. Instruments
100
ppm
N
H3
Gas
C
om
pre
ss
ed
a
ir
multi gas calibrator
U
S
B
-400
0
LS
-1 RH/te
m
p.
s
en
so
r To venting hood
B
en
t o
pti
ca
l
fib
er p
ro
be
Computer for data acquisition and processing Humidifier
Valve and flow meter
Climate chamber
Figure 1. The diagram of laboratory set-up for investigating the response of the bent optical fiber NH3-sensing probe to
trace NH3 in air gas samples.
probe’s absorbance signal in this work. An optical fiber compatible light source (LS-1, OceanOptics, Inc) was used to provide light in UV/Vis wavelength region for spectrometric measurement. A multi gas calibrator (Model 146i, Thermo Environmental Instruments Inc., Franklin, MA, USA) was used in diluting the NH3 stock standard
gas sample with compressed air to make testing air gas samples.
2.4. Preparing Sensor Probe
A previously reported procedure was followed to prepare bent optical fiber probes. [20,23,24] This process in-volves bending an optical fiber using a micro flame torch, cleaning the obtained bent optical fiber probe with a K2CrO4/H2SO4 washing solution, and activating bare
bent fiber core surface with a 1 M NaOH solution. The activated bent optical fiber probe was then cleaned with DI water before coating polymer and sensing reagent.
An activated and cleaned bent optical fiber probe was first coated with a PMMA membrane by dipping the bare bent part of the probe into the PMMA coating solution, and pulling out slowly. This process repeated three times. The coated probe was dried in air for 10 seconds be-tween the dip-coatings. After letting aging at room tem-perature in air for at least one hour, the PMMA-coated probe was then coated with CPR using the dip-coating method with the 64 mM CPR as a coating solution. The coated probe is air-dried for one hour before test.
2.5. Laboratory Set-up for Testing the Coated Optical Fiber Probes
In order to test the response of a coated bent optical fiber probe to air samples of different NH3 concentration, the
coated bent part of the optical fiber probe was sealed
inside plastic climate chamber as shown in Figure 1. The two ends of the bent probe were connected to the optical fiber compatible visible light source (LS-1) and the opti-cal fiber compatible UV/Vis spectrometer (USB-4000) by using SMA connectors, respectively. A testing air gas sample was flowed through the climate chamber, and the optical absorption spectrum of the bent optical fiber probe was recorded using the UV/Vis spectrometer with compressed air as a blank sample. A humidity/tempera- ture sensor (TJ-USB/RH-USB, Omega Engineering, Inc., Stamford, CT, USA), which is sealed inside a tube con-nected to the exit port of the climate chamber as shown in Figure 1, was used to continuously monitor RH% of the air sample.
3. Result and Discussion
3.1. Spectral Response of CPR to NH3
CPR is a pH indicator. This compound is yellow-colored in a solution having pH < 4.8, and purple-colored when exists in a solution of pH > 6.2. CPR’s peak optical ab-sorption wavelength is 576 nm in a basic solution and 434 nm in an acidic solution. [26] When the dual PMMA/ CPR coated bent optical fiber probe was exposed to air containing 2.0 ppm NH3, an absorption spectrum as
[image:3.595.58.286.81.233.2]showing in Figure 2 was recorded. This absorption spectrum is similar to that of CPR in a basic solution, but peak absorption wavelength is shifted to 595 nm. The peak absorption wavelength in this case is 20 nm red- shifted compared with that in a basic solution. It is be-lieved that difference of micro-environment of regent molecules in a solution and a solid phase caused this peak absorption wavelength shift.
Figure 2. A spectral response of the optical fiber sensor probe exposed to an air sample containing 2.0 ppm NH3.
The peak absorption wavelength of the sensing-probe ex-posed to NH3 is 597 nm, which is around 20 nm red-shifted
[image:3.595.310.536.516.649.2]3.2. Method of Fabricating NH3-Sensing Probe
Most reported OFCS for monitoring ammonia have a sensing reagent immobilized inside a polymer, which is coated on the surface of an optical fiber core. [20,23-25, 27,28] The most important advantage of this method for making OFCS is that a sensing reagent is “trapped” in-side the pores of a porous polymer or dissolved in a po-lymer solid phase. This is especially important when such a sensor was developed for detecting a compound in an aqueous solution, because the reagent molecules are prevented from leaking out of the membrane. However, this advantage is not significant when such a sensor was developed for gas sensing. A potential disadvantage of “trapping” the sensing reagent in a polymer in sensor design is the slow response. In this work two methods for preparing NH3-sensing probes were compared. The first
[image:4.595.312.536.465.629.2]method involves dissolving CPR and PMMA together in acetone. The obtained solution was used to coat a bent optical fiber probe. In this case, CPR is trapped inside PMMA. The second method is as that described in Sec-tion 2.4, from which a sensing probe having dual PM- MA/CPR coatings was made.
Figure 3 shows the time responses of these two sensor probes exposed to air gas samples. The response time, which is defined as the time needed for the sensor to reach 90% of its full scale response, of the sensor probe having CPR immobilized PMMA coating is 64 minutes, while the response time of the sensing probe having dual PMMA/CPR coating is 25 minutes. Obviously, the sen-sor probe having dual PMMA/CPR coatings has fast response. The sensitivity of these two specific probes for sensing NH3 is also different as demonstrated in Figure
Figure 3. Time response profiles of two optical fiber sensor probes exposed to NH3-containing air gas samples. (A), an
optical fiber sensor probe having a dual PCR/PMMA coat-ing exposed to 4.0 ppm NH3-containing air sample; (B), an
optical fiber sensor probe having a PCR-immobilized PM- MA coating exposed to 25.0 ppm NH3-containing air sample.
The absorbance signal spike at 98 minutes was caused by the abrupt change of NH3 concentration when the multi gas
calibrator turn off NH3 gas channel.
3. However, many factors affect the sensitivity of such sensors, and it is inappropriate to compare the sensitivity of these two coating methods based on results from these experiments.
The function of the PMMA coating on the surface of silica optical fiber core is for preventing the formation of liquid water membrane on surface of optical fiber sens-ing probe when the probe was used for monitorsens-ing gas samples of high moisture level. The surface of a silica optical fiber core is covered with hydroxide groups, which is highly hydrophilic with strong tendency of ab-sorbing water vapor from surrounding gas. A liquid wa-ter membrane will form on such a fiber surface if a bare silica fiber core was exposed to a gas sample of high moisture level. PCR is a water-soluble reagent and can dissolve into the water membrane formed on a fiber core surface. A PCR coating of a different morphology can form when liquid water membrane vaporized after ex-posing the probe to a dry gas sample. This can change the sensitivity of the sensing probe. PMMA is a hydro-phobic polymer. A PMMA coating on the surface of sil-ica optsil-ical fiber core converts fiber core surface to be hydrophobic and avoid the formation of liquid water membrane on the surface. The sensitivity stability of the dual PMMA/CPR coating based sensor probe was inves-tigated. The sensor probe was alternatively exposed to an air sample containing 0.40 ppmv NH3 with air humidity
RH% = 50% and a blank air sample of high humidity (RH = 80%). The test result showing in Figure 4 indi-cates that the absorbance change of the sensing probe (after subtracting the baseline shift) after exposed to high
Figure 4. Time response of an optical fiber sensor probe having a dual PCR/PMMA coating exposed alternatively to air samples of low humidity and high humidity. This test result indicates the stability of PCR coating on the surface of PMMA membrane because PMMA is a hydrophobic polymer. The absorbance signal spike at 147 minutes was caused by the abrupt change of NH3 concentration when
[image:4.595.60.282.495.620.2]humidity air sample is 1.5%. It can be concluded from this result that the CPR coating on the surface of PMMA is stable even exposed to air samples of high humidity.
[image:5.595.60.282.362.521.2]3.3. Sensitivity, Detection Limit and Reversibility
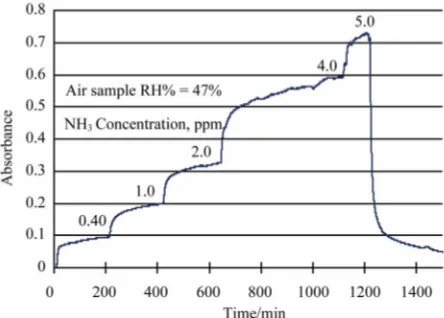
Figure 5 shows the time response of the sensor exposed to air gas samples (RH% = 47%) of different NH3
con-centration. The response (Abs.) of the sensor to ammonia concentration in air is listed in Table 1. A calibration curve describing the relationship of sensor’s absorbance signal with NH3 concentration in air samples was built
with a linear regression method (Least-squares regres-sion method [29]) using data from Testable 1. The equa-tion is:
Abs. = 0.143CNH3 (ppm) + 0.037 (r2 = 0.994)
From the baseline signal in Figure 5, the standard de-viation of blank air sample’s sensing signal is calculated to be 0.00013. The detection limit of this sensor, which is defined as the concentration of NH3 in air sample giving
a sensing signal equals three times that of the
Figure 5. Time response of the optical fiber sensor probe of this work exposed to air samples of different NH3
[image:5.595.57.284.600.720.2]concen-tration.
Table 1. Response (Abs.) of the optical fiber ammonia sen-sor of this work to ammonia in air samples.
NH3 concentration (ppm) Abs. ± standard deviation
0.0 0.000 ± 0.00013
0.40 0.105 ± 0.00020
1.0 0.198 ± 0.00021
2.0 0.325 ± 0.00018
4.0 0.593 ± 0.00045
5.0 0.714 ± 0.00067
standard deviation of blank sample signal, is calculated to be 2.7 ppb.
Figures 4 and 5 clearly demonstrate the reversibility nature of the sensor developed in this work. However, a baseline shift was observed after the sensing probe ex-posed to high humidity air sample (Figure 4). The me-chanism of this baseline shift is not understood at this moment, and will be the topic of further investigations.
4. Conclusions
An optical fiber NH3-sensing probe has been developed
for monitoring trace NH3 in gas samples by using a
dual-layer PMMA/CPR coated bent optical fiber as a transducer. The dual PMMA/CPR coating probe has faster response compared to the sensing probe having a CPR-immobilized PMMA coating. This sensor is re-versible, has a reasonable response time. The sensor is sensitive, has a detection limit of 2.7 ppb, which is the most sensitive optical fiber NH3 sensor to the best
knowledge of the authors. The high sensitivity nature makes it very attractive in air quality monitoring because NH3 concentration in ambient air is in tens-ppb range.
Further work will be focused on testing the probe for monitoring trace NH3 in ambient air.
5. Acknowledgements
This work was supported by USDA through award number: 2010-65112-20521.
6. References
[1] J. O. Bash, J. T. Walker, G. G. Katul, M. R. Jones, E. Nemitz and W. P. Robarge, “Estimation of in-Canopy Ammonia Sources and Sinks in a Fertilized Zea mays Field,” Environmental Science and Technology, Vol. 44,
No. 5, 2010, pp. 1683-1689. doi:10.1021/es9037269
[2] T. Nyord, K. M. Schelde, H. T. Sogaard, L. S. Jensen and S. G. Sommer, “A Simple Model for Assessing Ammonia Emission from Ammoniacal Fertilizers as Affected by pH and Injection into Soil,” Atmospheric Environment, Vol.
42, No. 19, 2008, pp. 4656-4664.
doi:10.1016/j.atmosenv.2008.01.051
[3] S. M. McGinn, T. K. Flesch, B. P. Crenna, K. A. Beau-chemin and T. Coates, “Quantifying Ammonia Emissions from a Cattle Feedlot Using a Dispersion Model,” Jour-nal of Environmental Quality, Vol. 36, No. 6, 2007, pp.
1585-1590.doi:10.2134/jeq2007.0167
[4] R. W. Todd, N. A. Cole, L. A. Harper, T. K. Flesch and B. H. Baek, “Ammonia and Gaseous Nitrogen Emissions from a Commercial Beef Cattle Feedyard Estimated Us-ing The Flux-Gradient Method and N:P Ratio Analysis,”
Proceedings of State of the Science: Animal Manure and Waste Management, San Antonio, 4-7 January 2005, pp.
[5] M. B. Rhoades, B. W. Auvermann, N. A. Cole, R. W. Todd, D. B. Parker, E. A. Caraway, G. Schuster and J. Spears, “Ammonia Concentration and Modeled Emission Rates from a Beef Cattle Feedyard,” Proceedings of 2008 ASABE Annual International Meeting, Providence, 29
June-2 July 2008.
[6] C. M. Wathes, M. R. Holden, R. W. Sneath, R. P. White and V. R. Phillips, “Concentrations and Emission Rates of Aerial Ammonia, Nitrous Oxide, Methane, Carbon Dioxide, Dust and Endotoxin in UK Broiler and Layer Houses,” British poultry science, Vol. 38, No. 1, 1997, pp.
14-28.doi:10.1080/00071669708417936
[7] E. F. Wheeler, K. D. Casey, J. S. Zajaczkowski, P. A. Topper, R. S. Gates, H. Xin, Y. Liang and A. Tanaka, “Ammonia Emission from U.S. Poultry Houses: Part III-Broiler Houses,” Proceedings of the 3rd International Conference on Air Pollution from Agricultural Opera-tions, Research Triangle Park, 12-15 October 2003, pp.
159-166.
[8] V. V. Malyshev and A. V. Pislyakov, “Dynamic Proper-ties and Sensitivity of Semiconductor Metal-Oxide Thick-Film Sensors to Various Gases in Air Gaseous Medium,” Sensors and Actuators B: Chemical, Vol. 96,
No. 1-2, 2003, pp. 413-434.
doi:10.1016/S0925-4005(03)00579-3
[9] B. T. Marquis and J. F. Vetelino, “A Semiconducting Metal Oxide Sensor Array for the Detection of NOx and NH3,” Sensors and Actuators B: Chemical, Vol. 77, No. 1-2, 2001, pp. 100-110.
doi:10.1016/S0925-4005(01)00680-3
[10] V. Romanovskaya, M. Ivanovskaya and P. Bogdanov, “A Study of Sensing Properties of Pt- and Au-Loaded In2O3 Ceramics,” Sensors and Actuators B: Chemical, Vol. 56,
No. 1-2, 1999, pp. 31-36.
doi:10.1016/S0925-4005(99)00018-0
[11] K. Chen, Y, Xu, H. Zhang, L. Nie and S. Yao, “Novel Surface Acoustic Wave-Interdigitated Array Electrode Gas Sensor for Dissolved Ammonia,” Fresenius’ Journal of Analytical Chemistry, Vol. 357, No. 4, 1997, pp. 379- 383.
[12] O. K. Varghese, D. Gong, W. R. Dreschel, K. G. Ong, G. Keat and C. A. Grimes, “Ammonia Detection Using Na-noporous Alumina Resistive and Surface Acoustic Wave Sensors,” Sensors and Actuators B: Chemical, Vol. 94,
No. 1, 2003, pp. 27-35.
doi:10.1016/S0925-4005(03)00252-1
[13] C. Shen, C. Huang and H. Chuo, “The Improved Ammo-nia Gas Sensors Constructed by L-Glutamic Acid Hy-drochloride on Surface Acoustic Wave Devices,” Sensors and Actuators B: Chemical, Vol. 84, No. 2-3, 2002, pp.
231-236.doi:10.1016/S0925-4005(02)00030-8
[14] C. Shen, C. Hsu, R. Hwang and J. Jeng, “The Interference of Humidity on a Shear Horizontal Surface Acoustic Wave Ammonia Sensor,” Sensors and Actuators B: Chemical, Vol. 122, No. 2, 2007, pp. 457-460.
doi:10.1016/j.snb.2006.06.017
[15] C. Shen, R. Chen, Y. Shen, L. Wu, C. Huang and J. Jeng, “An Improved System Based on Surface Acoustic Wave Sensors for Reliable Measurement,” Chemical Sensors,
Vol. 20, Supplement B, 2004, pp. 266-267.
[16] NIOSH “Organic and Inorganic Gases by Extractive FTIR Spectrometry,” 4th Edition, NIOSH Manual of Analytical Methods, 2000.
[17] Z. Loh, D. Chen, M. Bai, T. Naylor, D. Griffith, J. Hill, T. Denmead, S. McGinn and R. Edis, “Measurement of Greenhouse Gas Emissions From Australian Feedlot Beef Production Using Open-Path Spectroscopy and Atmos-pheric Dispersion Modeling,” Australian Journal of Ex-perimental Agriculture, Vol. 48, No. 2, 2008, pp. 244-247.
doi:10.1071/EA07244
[18] E. D. Thoma, R. C. Shores, E. L. Thompson, D. B. Harris, S. A. Thorneloe, R. M. Varma, R. A. Hashmonay, M. T. Modrak, D. F. Natschke and H. A .Gamble, “Open-Path Tunable Diode Laser Absorption Spectroscopy for Ac-quisition of Fugitive Emission Flux Data,” Journal of the Air & Waste Management Association, Vol. 55, No. 5,
2005, pp. 658-668.
[19] J. Wang, P. Xie, A. Li, F. Si, K. Dou, W. Fang, F. Wu, Y. Jiang and M. Qin, “Advanced Sensor Systems and Ap-plications IV,” Proceedings of SPIE-The International Society for Optical Engineering, Beijing, 18-20 October
2010, pp. 1-11.
[20] S. Tao, “Optical Fiber Ammonia Sensing Probes Using Reagent Immobilized Porous Silica Coating as Transduc-ers,” Sensors and Actuators B: Chemical, Vol. 115, No. 1,
2006, pp. 158-163.
[21] S. Tao, “Fiber Optic Chemical Sensors for Environmental Monitoring,” In: C. A. Grimes, E. C. Dickey and M. V. Pishko, Eds., Encyclopedia of Sensors, Vol. 3, American
Scientific Publishers, Stevenson Ranch, 2006, pp. 449- 473.
[22] M. El-Sherif, “Fiber-Optic Chemical and Biosensors,”
Springer Series on Chemical Sensors and Biosensors,
Springer, New York, 2010, pp. 109-149.
[23] H. Guo and S. Tao, “Silver Nanoparticles Doped Silicate Nanocomposites Coated on an Optical Fiber for Ammo-nia sensing,” Sensors and Actuators B: Chemical, Vol.
123, No. 1, 2007, pp. 578-582.
doi:10.1016/j.snb.2006.09.055
[24] S. Tao, S. Gong, J. C. Fanguy and X. Hu, “The Applica-tion of a Light Guiding Flexible Tubular Waveguide in Evanescent Wave Absorption Optical Sensing,” Sensors and Actuators B: Chemical, Vol. 120, No. 2, 2007, pp.
724-731.doi:10.1016/j.snb.2006.03.039
[25] E. Scorsone, S. Christie, K. C. Persaud, P. Simon and F. Kvasnik, “Fiber-Optic Evanescent Sensing of Gaseous Ammonia with Two Forms of a New Near-Infrared Dye in Comparison to Phenol Red,” Sensors and Actuators B:
Chemical, Vol. 90, No. 1-3, 2003, pp. 37-45.
doi:10.1016/S0925-4005(03)00019-4
[26] R. W. Sabnis, “Handbook of Acid-Base Indicators,” CRC Press, Boca Raton, 2008.
[27] M. J. Aernecke and D. R. Walt, “Optical-Fiber Arrays for Vapor Sensing,” Sensors and Actuators B: Chemical, Vol.
142, No. 2, 2009, pp. 464-469.
doi:10.1016/j.snb.2009.06.054
Gas Detection” In: R. V. Harrison, Ed., Chemical Sensors: Properties, Performance and Applications, Nova Science
Publishers, Inc., Hauppauge, 2010, pp. 69-92.