Original Article
Establishment and characterization of an immortalized
rat hepatic stellate cell line
Tao Li, Xi-Sheng Leng, Ji-Ye Zhu, Fu-Shun Wang
Department of Hepatobiliary Surgery, Peking University People’s Hospital, Beijing, P. R. China
Received August 16, 2015; Accepted September 23, 2015; Epub October 1, 2015; Published October 15, 2015
Abstract: Hepatic stellate cells (HSCs) play an important role in liver fibrosis and portal hypertension. This study es -tablished a new rat HSC cell line LSC-1. Liver ex vivo perfusion with collagenase IV and density gradient centrifuga-tion were used to isolate rat HSC. Cells have been maintained in culture for multiple passages. LSC-1 cell biological characteristics were studied. LSC-1 cell have been maintained in culture over 100 passages. This new HSC cell line express telomerase reverse transcriptase (TRT) and p53, suggesting that it is immortalized spontaneously. LSC-1 cells have a doubling time of 46 hours and their growth is serum-dependent. Karyotypic analysis revealed that LSC-1 cells possess normal chromosome phenotype. Moreover, LSC-LSC-1 cells do not grow in soft agar or induce tumors in nude mice, suggesting that they are not transformed. LSC-1 cells express desmin, glial fibrillary acidic proteins (GFAP), collagen type I and III, α-smooth muscle actin (α-SMA), transforming growth factor β1 (TGF-β1), platelet derived growth factor B (PDGF-B) and inducible nitric oxide synthase (iNOS). TGF-β1 stimulation increased collagen type I and III expression in LSC-1 cells. Additionally, LSC-1 cells proliferate in response to PDGF-BB, and contract in response to endothelin-1 (ET-1). In summary, LSC-1 cells exhibit activated HSC phenotype characteristics, and therefore are useful tool to study the pathogenesis of liver cirrhosis and portal hypertension.
Keywords: Hepatic stellate cell, cell line, LSC-1, cell culture, liver fibrosis
Introduction
Hepatic fibrosis is a common result of chronic liver injury and may progress to liver cirrhosis and portal hypertension. The main feature of hepatic fibrosis is deposition of extracellular matrix (ECM) protein, e.g. collagen, vimentin, fibronectin, et al. Due to technological advanc -es in isolation, culture and characterization of hepatic parenchymal and non-parenchymal cells from normal and injured livers, it has been proved that hepatic stellate cells (HSCs) are the major source of ECM [1-10]. HSCs reside in the space of Disse, in close contact with sinusoidal endothelial cells and hepatocytes. A character-istic feature of HSC is that they possess long, branching cytoplasmic processes. In normal liver, HSCs are responsible for the transport and storage of retinoids and for the production of basement membrane components. After liver injury, HSCs are activated. The maker of HSCs activated phenotype is the expression of the intracellular microfilament protein α-smooth
muscle actin (α-SMA). Activated HSCs lose reti -noids, produce increased level of ECM, and express cytokins and its receptors. Many stud-ies have also revealed that HSC possess con-tractility. Thus, HSCs play a key role in regula-tion of hepatic microcircularegula-tion and pathogen-esis of portal hypertension [5, 11-16].
Isolation of HSC from the liver makes it possible to directly examine their mechanism of activa-tion and related changes in gene expression [17-19]. HSC isolation is a complex and time-consuming procedures and is dependent on the availability of liver specimens. Additionally, yields are low and several weeks in culture are required to obtain sufficient cell numbers to perform experiments. Therefore, establishment of an HSC cell line will be a valuable tool for studying the mechanism of liver fibrosis and portal hypertension.
Materials and methods
Isolation and culture of primary rat HSCs
Rat HSCs were isolated from normal Wistar rats by liver ex vivo perfusion of collagenase type IV and density gradient centrifugation methods [20-23]. Isolated HSCs were seeded on uncoated plastic tissue culture dishes and cultured in Dulbecco’s modified Eagle’s medi -um (DMEM; Gibco BRL, Grand Island, New York, USA) supplemented with 20% fetal bovine serum (FBS) (Hyclone, Logan, UT, USA). Cell viability was determined by Trypan blue exclu-sion staining. Cells were counted under fluores -cence microscopy for auto-fluores-cence at a wavelength of 328 nm. HSC purity was identi-fied by immunocytochemistry detection of the expression of either desmin or glial fibrillary acidic proteins (GFAP). All animals received humane care and study protocols complied with Peking University People’s Hospital guidelines.
Morphological and growth characterization
HSCs were observed under light phase-con-trast microscope, and were processed for transmission electron microscopy and scan-ning electron microscopy using standard tech-niques. To determine cell growth curves, cells were seeded in 24-well plates at a density of 1×10⁴/well in DMEM containing 10% FBS. Cells
were maintained in culture for 8 days and were trypsinized and counted in triplicate at 24-hour intervals. Doubling time was calculated from the linear portion of the growth curve. Serum dependence was checked by growing the cells
in medium with serum concentrations of 1%, 3%, 5%, and 10%.
Telomerase activity and p53 expression
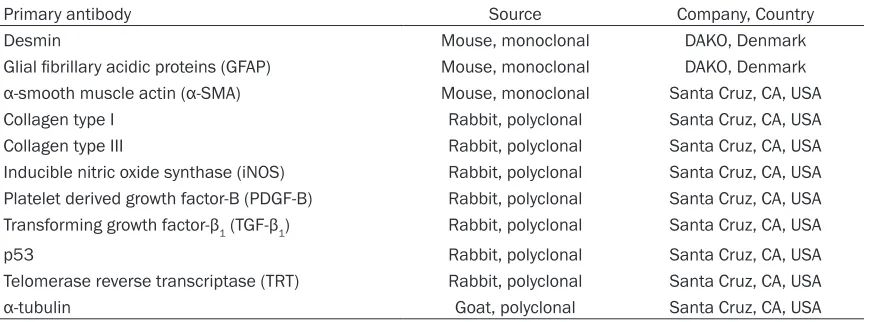
[image:2.612.91.526.85.246.2]Telomerase activity and p53 expression were analyzed by Western blot and immunocyto-chemistry in several passages (i.e. passages 1, 30, 50, 70 and 100) during the course of cell line development. Primary antibodies against telomerase reverse transcriptase (TRT) and p53 were used to detect telomerase and p53. Details of the primary antibodies are shown in
Table 1.
Karyotypic analysis and soft agar assay
Cells from the 100th passages were used for
Karyotypic analysis, chromosomal prepara-tions took place with conventional air-drying methods, and chromosomal analysis was per-formed using trypsin-Giemsa procedures. The ability of HSC cells to sustain anchorage-inde-pendent growth was assessed by seeding cells in soft agar. The soft agar assay was performed as described previously [24].
In vivo tumor generation assay
Cells from the 100th passage were prepared in
PBS at a density of 5×10⁷. 4 to 6-week-old
BALB/c nude mice were used for tumor forma-tion assay. A total of 5×10⁶ cells were injected
subcutaneously. BEL 7402 hepatocellular can-cer cells were used as a control. The nude mice were observed for up to 4 weeks for tumor formation.
Table 1. Antibodies used for immunocytochemistry and Western blot
Primary antibody Source Company, Country
Desmin Mouse, monoclonal DAKO, Denmark
Glial fibrillary acidic proteins (GFAP) Mouse, monoclonal DAKO, Denmark
α-smooth muscle actin (α-SMA) Mouse, monoclonal Santa Cruz, CA, USA
Collagen type I Rabbit, polyclonal Santa Cruz, CA, USA
Collagen type III Rabbit, polyclonal Santa Cruz, CA, USA
Inducible nitric oxide synthase (iNOS) Rabbit, polyclonal Santa Cruz, CA, USA Platelet derived growth factor-B (PDGF-B) Rabbit, polyclonal Santa Cruz, CA, USA Transforming growth factor-β1 (TGF-β1) Rabbit, polyclonal Santa Cruz, CA, USA
p53 Rabbit, polyclonal Santa Cruz, CA, USA
Telomerase reverse transcriptase (TRT) Rabbit, polyclonal Santa Cruz, CA, USA
Immunocytochemical analysis
Cells from the several passages (passages 1, 30, 50, 70 and 100) were cultured on cover slips in the presence of DMEM containing 10% FBS. Specific cellular protein expression was checked using primary antibodies against des-min, GFAP, collagen type I and III, transforming growth factor-β1 (TGF-β1), platelet derived growth factor-B (PDGF-B), α-SMA and inducible nitric oxide synthase (iNOS). Details of antibod-ies are shown in Table 1.
Expression of TGF-β1 and PDGF-BB
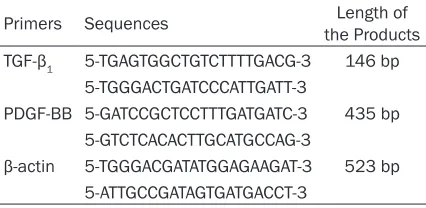
Total RNA from several cell passages (passag-es 1, 30, 70 and 90) was isolated from subcon-fluent cells using Trizol Reagent (Gibco BRL). RT-PCR was performed to determine TGF-β1 and PDGF-BB expression. Primer sequences and product lengths are shown in Table 2. β-actin was used as a control. All PCR reaction was performed in a total volume of 25 μl. PCR mixture contained 10 mM Tris-Cl (pH 8.3), 50 mM KCl, 1.5 mM MgCl, 0.01% gelatin, 200 pmol each primer, 2 U Taq DNA polymerase, and 0.5 μl cDNA. Amplification was performed by denaturation at 94°C for 2 min, followed by 30 cycles at 94°C for 30 s, 55°C for 30 s, and 72°C for 30 s with a final extension at 72°C for 5 min. PCR products were electrophoresed on 2% agarose gel.
Expression of α-SMA by western blot analysis
Cells from several passages (passages 1, 30, 50 and 70) were cultured and cellular total pro-teins were extracted. Propro-teins were sepa rated on 10% denaturing sodium dodecyl sulfate-polyacrylamide gels, and transferred to pyroxy-lin membranes. Membranes were blocked for 3 to 4 h in Tris-buffer saline with Tween-20. Membranes were incubated with mouse
anti-α-SMA and goat anti-α-tubulin antibodies (1:3000) overnight at 4°C. Second ary antibody linked to horseradish peroxidase (anti-rabbit 1:3000) was added and incubated for 2 h at room temperature. Membranes were subse-quently incubated in Chemiluminescence Luminol Reagent (Santa Cruz Co. USA) to visual-ize proteins. Goat anti-α-tubulin antibody was used as a control.
Effect of TGF-β1 on collagen types I and III ex-pression
Cells from the 100th passages were seeded at
a density of 2×10⁵/ml onto 12-well plates in
DMEM containing 10% FBS. After reaching sub-confluence, cells were washed and incubated for 4 h with DMEM containing 0.05% FCS. Cells were then incubated with or without 5 ng/ml TGF-β1 (PeproTech. Rocky Hill, NJ, USA). To determine the effects of TGF-β1 on collagen type I and III expression, cells were maintained in culture for 48 h. Determination of collagen type I and III expression was subsequently car-ried out by Western blot analysis.
Effect of PDGF-BB on cell proliferation
Several cell passages were assayed for their proliferative response to PDGF-BB stimulation in serum-free conditions by [3H] thymidine
incorporation. The cells were incubated in medium in the presence or absence of 10 ng/ ml PDGF-BB (PeproTech. Rocky Hill, NJ, USA) with 1 μCi/ml [3H] thymidine.
Preparation of silicone rubber membrane and cell contraction
Silicone rubber membrane was prepared as described previously [25]. Briefly, dimethylpoly -siloxane-12M and dimethylpolysiloxane-60M were mixed to produce 30000 centipoise sili-cone fluids. The silisili-cone fluid was spread in a relatively thick layer onto one surface of a cover slip. This surface was then turned face down into the top of a Bunsen-burner flame for 2 sec. During flaming, a sheen of tiny wrinkles formed on the fluid surface, and if the cover slip was withdrawn as soon as these were seen, they will reflattened to form the desired smooth, elastic, nontoxic, and transparent surface. Cells were seeded at a density of 1×10⁵/ml on
[image:3.612.91.304.86.190.2]a dish containing silicone rubber membrane
Table 2. RT-PCR primers and products lengths Primers Sequences the ProductsLength of TGF-β1 5-TGAGTGGCTGTCTTTTGACG-3 146 bp
5-TGGGACTGATCCCATTGATT-3
PDGF-BB 5-GATCCGCTCCTTTGATGATC-3 435 bp 5-GTCTCACACTTGCATGCCAG-3
cover slip. After culturing for 3 days, endothe-lin-1 (ET-1) was added to the DMEM medium (final ET-1 concentration 2×10⁻⁶ mol/L). PBS
was added to another dish as a control. Photos were taken before and after 20 min of
endothe-at 5- to 6- d intervals. After the 50th passage,
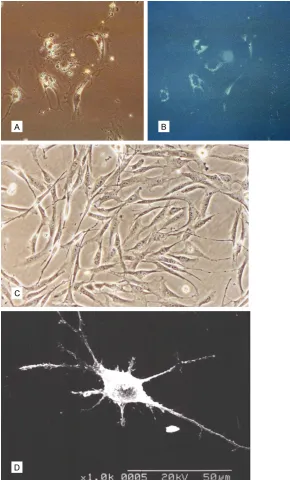
[image:4.612.89.379.71.551.2]cells were split 1:4 at 3- to 4- d intervals. To date, these cells have been maintained in cul-ture over 100 passages. Samples of trypsin-ized cells at each passage were stored in liquid Figure 1. A: HSCs contain lipid droplets in the perinuclear zone (original
mag-nification, ×200). B: Fluorescence microscopy demonstrates the fluorescence of vitamin A in same field of vision (original magnification, ×200). C: Morpho -logical characteristics of LSC-1 at the 100th passage observed under light
phase-contrast microscope (original magnification, ×200). D: Scanning elec -tron microscopy shows the long branching cytoplasmic processes and typical stellate appearance of LSC-1 at the 100th passage (original magnification,
×1000).
lin-1 administration. Wrinkle changes around cells in the same field of vision were analyzed to estimate the cell contractions. Increases of wrinkles indicated, cell con-traction and decreases of wrinkles indicated cell rela- xation.
Statistical analysis
The final value of data was expressed as mean ± stan-dard deviation (_X±s) and statistical analyses included the univariate variance anal-ysis and t-test. P<0.05 was considered statistically signi- ficant.
Results
Establishment of rat HSC cell line LSC-1
Primary HSC yield rates were (2.93±0.09) ×107 and cell
viability exceeded 98%. The purity of primary HSC was higher than 97%. Primary HSCs showed characteristic vitamin A fluorescence. Ap-proximately 80% of fresh iso-lated HSCs displayed auto-fluorescence at a wavelength of 328 nm under fluores -cence microscopy. HSCs were maintained in culture until reaching confluence after 20 d. Cells were trypsin-ized, passaged at a ratio of 1:2 and cultured in DMEM supplemented with 10% FBS in 5% CO2 at 37°C. Initially, cells were trypsinized at 7- to 10- d intervals and under-went up to 20 passages at a ratio of 1:2. After the 20th
nitrogen. Cells that were kept frozen and then cultured showed the same morphological char-acteristics and proliferation. This cell line was named LSC-1.
Morphological characteristics and cell growth curve
After 3 d culturing on uncoated plastic disks, primary HSC cells were spread out and con-tained lipid droplets in the perinuclear zone under phase microscopy, demonstrating the fluorescence of vitamin A (Figure 1A, 1B). LSC-1 cells resemble the morphological char-acteristics of activated HSC, possess many spreading long branching cytoplasmic process-es, and exhibit a typical “stellate” appearance (Figure 1C, 1D). LSC-1 cells at the 100th
pas-sages showed contact inhibited at high cell density, and did not form foci of proliferating, multi-layered cells. The Cell doubling time of LSC-1 cells at the 100th passages was 46 h.
LSC-1 cells growth was serum dependent.
LSC-1 cells were immortalized
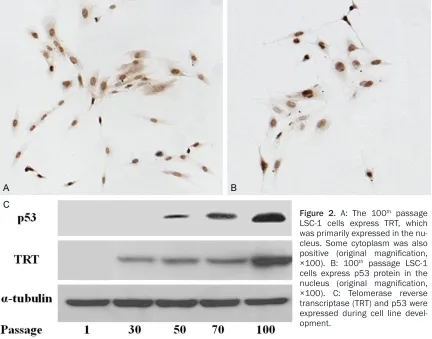
As shown in Figure 2, LSC-1 cell passage 1 was negative for telomerase activity. However, cells at the 30th passages displayed telomerase
activity, and telomerase reverse transcriptase (TRT) expression increased gradually during the course of cell line development. Immunocytochemistry analysis suggested that TRT was primarily expressed in the nucleus (Figure 2A). Additionally, LSC-1 cells at the 1st
and 30th passages were p53 negative. The p53
protein was expressed in the 50th passage of
LSC-1 cells and expression increased gradually thereafter (Figure 2C). Immunocytochemistry analysis indicated that the p53 protein expressed in the nucleus (Figure 2B). These results suggest that LSC-1 cells became immor-talized spontaneously.
LSC-1 cells showed no signs of oncogenic transformation
LSC-1 cell karyotype at the 100th passage was
[image:5.612.91.523.72.411.2]analyzed randomly in 108 metaphase nuclei. Figure 2. A: The 100th passage
LSC-1 cells express TRT, which was primarily expressed in the nu-cleus. Some cytoplasm was also positive (original magnification, ×100). B: 100th passage LSC-1
80% (86/108) displayed 42 chromosomes. 18% (20/108) displayed 43 chromosomes, and only 2% (2/108) displayed 44 chromosomes. This indicated that LSC-1 cells have a normal rat karyotype. Soft agar assay revealed no cell colony formation after culturing in soft agar for 14 days. As a positive control, Hela cells did form colonies. Potential LSC-1 cell in vivo tumor formation was examined 4 wks, after inocula-tion, no palpable tumor nodules were produced in nude mice, but tumor transplantation was observed during week 1 in the BEL 7402 cell group. Taken together, these findings indicated no evidence for the oncogenic transformation of LSC-1 cells.
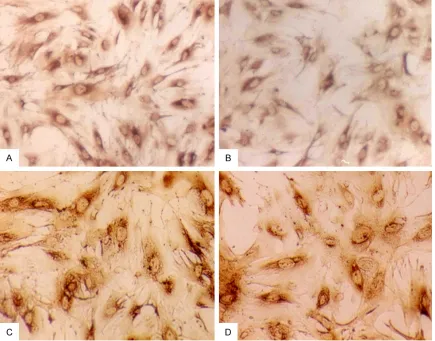
LSC-1 cells express desmin, GFAP, collagen type I and III, TGF-β1, PDGF, α-SMA and iNOS The cellular intermediate filament proteins des -min and GFAP were expressed in LSC-1 cells
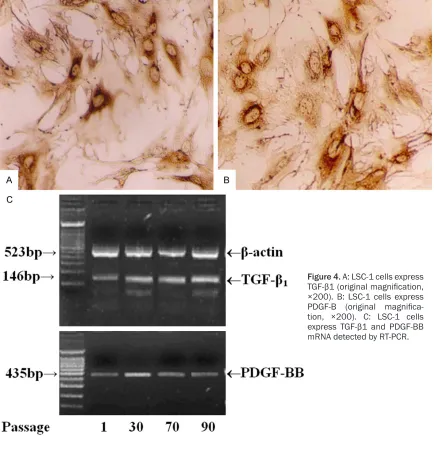
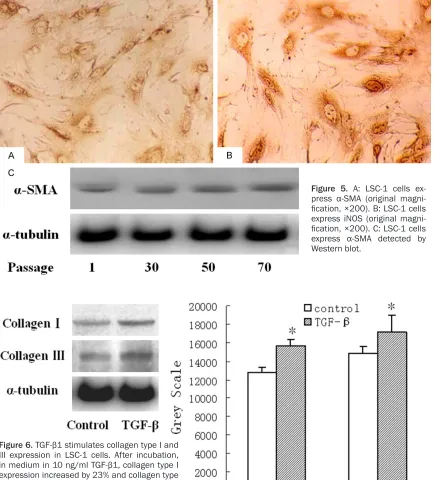
(Figure 3A, 3B). The ability of LSC-1 cells to pro-duce ECM proteins collagen type I and III was shown immunocytochemically (Figure 3C, 3D). TGF-β1 and PDGF-BB and their mRNA and pro-tein were expressed in LSC-1 cells (Figure 4). α-SMA was also expressed in LSC-1 cells (Figure 5A). Additionally, LSC-1 cells were posi-tive for iNOS (Figure 5B).
TGF-β1 stimulates collagen types I and III in LSC-1 cells
[image:6.612.90.525.73.414.2]LSC-1 cell proliferation induced by PDGF-BB
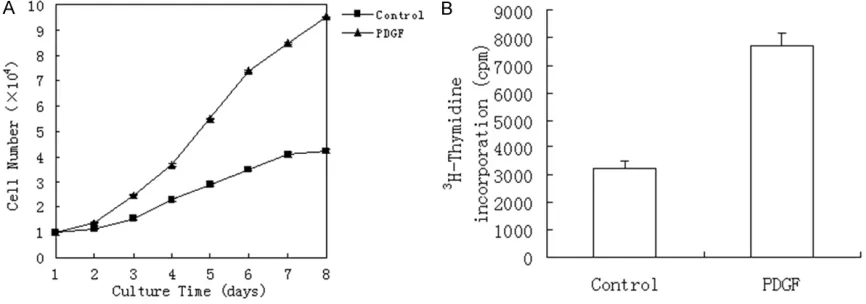
The most potent mitogen towards activated HSCs is PDGF. In this study, LSC-1 cell prolifera-tion was increased by PDGF-BB, as is shown in the cell growth curve (Figure 7A). After a period of serum starvation, stimulation of LSC-1 cells with 10 ng/ml PDGF-BB for 24 h resulted in a 2.4-fold increase of [3H] thymidine
incorpora-tion as compared with the control (Figure 7B). LSC-1 cell contractility induced by ET-1
Silicone rubber membrane is sensitive and reli-ably measures cell contractility. In this study, after culturing on silicone rubber membrane for
3 days, membrane wrinkles were formed around LSC-1 cells (Figure 8). This indicates the contractility of LSC-1 cells. After ET-1 adminis-tration for 20 min, the number of wrinkles increased (Figure 8).
Discussion
[image:7.612.90.524.72.528.2]Research on HSCs has made great advances since Knook et al. [20] successfully isolated and cultured HSC in 1982. Subsequently, numerous studies have shown that HSC plays a fundamental role in liver fibrogenesis [1-10]. HSC has become a focus in understanding the mechanisms involved in hepatic fibrogenesis. Although great progress has been made in the
HSC isolation and culture, these procedures remain complex and time-consuming and yields are low because of the small proportion of HSC in liver cells. Therefore, establishment of an HSC cell line is of significant importance for the study of HSC biology and the mechanism of liver fibrosis.
In this study, we established a new rat hepatic stellate cell line LSC-1, which was isolated from
[image:8.612.91.525.72.552.2]normal Wistar rats. To date, cells have been cultured over 100 passages. During the course of cell line development, LSC-1 cells displayed TRT and p53 expression. Normal cells in cul-ture divide a limited number of times and then enter a non-dividing state termed (replicative senescence). Telomeres undergo progressive shortening with successive cell divisions in nor-mal cells, and cellular senescence is thought to be induced when telomeres shorten beyond a Figure 5. A: LSC-1 cells ex-press α-SMA (original magni -fication, ×200). B: LSC-1 cells express iNOS (original magni-fication, ×200). C: LSC-1 cells express α-SMA detected by Western blot.
critical length. Telomere shortening controls the entry of cells into senescence. Expression of the telomerase catalytic subunit stabilizes telomere length and extends the life span of various normal cells [26-28]. Cell-cycle check-points, such as p53, also contributed to cell immortalization [29]. TRT and p53 expression might have enabled LSC-1 cells to overcome senescence and crisis, accounting for their extended life span. Our results suggest that LSC-1 cells are immortalized spontaneously. Additionally, these cells have a doubling time of 46 h and their growth is serum-dependent. Karyotypic analysis revealed that LSC-1 cells have a normal rat chromosome phenotype. Moreover, LSC-1 cells do not grow in soft agar or induce tumors in nude mice, suggesting that they are not transformed.
LSC-1 cells resemble the characteristics of acti-vated HSC. Morphological features, include lose vitamin A droplets, increases in cell size, possession of spreading long cytoplasmic pro-cesses and a typical stellate appearance. LSC-1 cells express desmin and GFAP simulta-neously, these two intermediate filament pro -teins are the reliable markers for HSC [3, 4, 10]. Additionally, LSC-1 cells express α-SMA, which is the characteristic marker of activated HSC [11, 12]. These cells also have the ability to pro-duce ECM proteins, such as collagen type I and III. TGF-β1 and PDGF-BB, the two major cyto-kines involved in HSC activation, are also expressed in LSC-1 cells. Finally, LSC-1 cells
have contractile abilities. All these features depict this new cell line as being extremely sim-ilar to activated phenotype of HSC.
It is well established that cytokines play a key role in HSC activation. TGF-β1 and PDGF are the two major cytokines involved in hepatic fibrosis [1, 30]. TGF-β1 appears to play a central role in the cytokine network involved in fibrogenesis [30-32]. TGF-β1 is believed to be involved in the synthesis and deposition of ECM components such as collagens type I and III, and fibronectin et al. It has been shown that the level of mRNA for TGF-β1 is tightly correlates with liver biop-sies of patients with chronic liver disease [33, 34]. Additionally, PDGF-BB is known as the most potent mitogen for HSC, and is over-expressed during active hepatic fibrogenesis [16, 33]. In this study, we showed that LSC-1 cells retain responsiveness to TGF-β1 and PDGF-BB. TGF-β1 treatment of LSC-1 cells increased expression of collagen type I and III. LSC-1 cells also proliferate in response to PDGF-BB. Consequently, LSC-1 cells may be used as a valuable cell model for studying the mechanism of HSC activation.
[image:9.612.90.523.73.225.2]LSC-1 cells are also to contract in response to endothelin-1. Contractility is an important HSC function. HSCs reside in the space of Disse, in close contact with sinusoidal endothelial cells. Their long branching cytoplasmic processes surround liver sinusoidal. Therefore, HSC con-tractility plays a role in the regulation of the Figure 7. A: PDGF-BB stimulates LSC-1 proliferation; LSC-1 cells were incubated in medium in the presence or ab-sence of 10 ng/ml PDGF-BB. Cell counts were performed in duplicate from day 1 to day 8 in culture. Data represent the mean ± SD. B: For [3H] thymidine incorporation assay, LSC-1 cells were serum starved for 24 h in serum-free
medium and afterwards were stimulated with 10 ng/ml PDGF-BB for another 24 h in medium containing 1 μCi/ml [3H] thymidine. LSC-1 cells maintained in 0% FCS served as a control. Experiments were performed in triplicate.
hepatic microcirculation and affects distribu-tion of liver blood flow and portal vein resis -tance [12-14, 35]. Additionally, LSC-1 cells express iNOS. Thus, this cell line can be used to study the mechanism of HSC contraction and to select drugs for reducing portal vein pressure.
In summary, our study established a new rat HSC cell line, LSC-1, which possesses the char-acteristics of activated HSC phenotype. It will be a valuable tool with which to study the bio-logical function of HSC and pathogenesis of liver fibrosis and portal hypertension.
[4] Puche JE, Saiman Y, Friedman SL. Hepatic stel-late cells and liver fibrosis. Compr Physiol 2013; 3: 1473-1492.
[5] Marra F, Pinzani M. Role of hepatic stellate cells in the pathogenesis of portal hyperten-sion. Nefrologia 2002; 22 Suppl 5: 34-40. [6] Friedman SL. Mechanisms of hepatic fibrogen
-esis. Gastroenterology 2008; 134: 1655-1669.
[7] Novo E, Cannito S, Paternostro C, Bocca C, Miglietta A, Parola M. Cellular and molecular mechanisms in liver fibrogenesis. Arch Biochem Biophys 2014; 548: 20-37.
[8] Povero D, Busletta C, Novo E, di Bonzo LV, Cannito S, Paternostro C, Parola M. Liver fibro -Figure 8. LSC-1 cell contraction induced by endothelin-1. A: Before ET-1
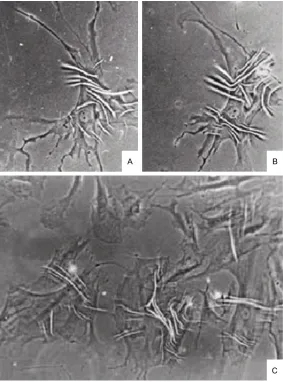
administration (original magnification, ×400). B: After 20 min endothelin-1 administration, the number of wrinkles increased (original magnification, ×400). C: To analyze LSC-1 cell contractility, cells were cultured on silicone rubber membrane for 3 d, membrane wrinkles were formed around cells (original magnification, ×400).
Acknowledgements
This research was supported by grants from the National Natural Science Foundation of China (No. 30872498) and a grant from the Beijing Mu- nicipal Natural Science Foun- dation (No. 7083116) and Pe- king University People’s Hos- pital Research and Deve- lopment Funds (No. RDB2014- 08).
Disclosure of conflict of inter -est
None.
Address correspondence to: Dr. Xi-Sheng Leng, Department of Hepatobiliary Surgery, Peking Uni- versity People’s Hospital, 11 Xizhimen South Street, West District, Beijing 100044, P. R. China. Tel: +8610-88326705; Fax: +8610-68318386; E-mail: [email protected]
References
[1] Friedman SL. Hepatic Fibro- sis: Emerging Therapies. Dig Dis 2015; 33: 504-507. [2] Friedman SL. Hepatic
stel-late cells: protean, multi-functional, and enigmatic cells of the liver. Physiol Rev 2008; 88: 125-172. [3] Pinzani M. Pathophysiology
[image:10.612.90.373.71.453.2]sis: a dynamic and potentially reversible pro-cess. Histol Histopathol 2010; 25: 1075-1091. [9] Friedman SL. Liver fibrosis: from mechanisms to treatment. Gastroenterol Clin Biol 2007; 31: 812-814.
[10] Trautwein C, Friedman SL, Schuppan D, Pinzani M. Hepatic fibrosis: Concept to treat -ment. J Hepatol 2015; 62 Suppl: S15-S24. [11] Rockey DC, Boyles JK, Gabbiani G, Friedman
SL. Rat hepatic lipocytes express smooth mus-cle actin upon activation in vivo and in culture. J Submicrosc Cytol Pathol 1992; 24: 193-203. [12] Soon RK Jr, Yee HF Jr. Stellate cell contraction: role, regulation, and potential therapeutic tar-get. Clin Liver Dis 2008; 12: 791-803, viii. [13] Reynaert H, Thompson MG, Thomas T, Geerts
A. Hepatic stellate cells: role in microcircula-tion and pathophysiology of portal hyperten-sion. Gut 2002; 50: 571-581.
[14] Rockey DC. Hepatic fibrosis, stellate cells, and portal hypertension. Clin Liver Dis 2006; 10: 459-479, vii-viii.
[15] Reynaert H, Urbain D, Geerts A. Regulation of sinusoidal perfusion in portal hypertension. Anat Rec (Hoboken) 2008; 291: 693-8. [16] Rockey DC. Hepatic blood flow regulation by
stellate cells in normal and injured liver. Semin Liver Dis 2001; 21: 337-349.
[17] Friedman SL, Rockey DC, McGuire RF, Maher JJ, Boyles JK, Yamasaki G. Isolated hepatic li-pocytes and Kupffer cells from normal human liver: morphological and functional character-istics in primary culture. Hepatology 1992; 15: 234-243.
[18] Maher JJ. Interactions between hepatic stel-late cells and the immune system. Semin Liver Dis 2001; 21: 417-426.
[19] Seki E, Brenner DA. Recent advancement of molecular mechanisms of liver fibrosis. J Hepatobiliary Pancreat Sci 2015; 22: 512-518.
[20] Knook DL, Seffelaar AM, de Leeuw AM. Fat-storing cells of the rat liver. Their isolation and purification. Exp Cell Res 1982; 139: 468-471. [21] Friedman SL, Roll FJ. Isolation and culture of hepatic lipocytes, Kupffer cells, and sinusoidal endothelial cells by density gradient centrifu-gation with Stractan. Anal Biochem 1987; 161: 207-218.
[22] Alpini G, Phillips JO, Vroman B, LaRusso NF. Recent advances in the isolation of liver cells. Hepatology 1994; 20: 494-514.
[23] Friedman SL, Rockey DC, McGuire RF, Maher JJ, Boyles JK, Yamasaki G. Isolated hepatic li-pocytes and Kupffer cells from normal human liver: morphological and functional character-istics in primary culture. Hepatology 1992; 15: 234-243.
[24] Cox AD, Der CJ. Biological assays for cellular transformation. Methods Enzymol 1994; 238: 277-294.
[25] Harris AK, Wild P, Stopak D. Silicone rubber substrata: a new wrinkle in the study of cell lo-comotion. Science 1980; 208: 177-179. [26] Counter CM, Avilion AA, LeFeuvre CE, Stewart
NG, Greider CW, Harley CB, Bacchetti S. Telomere shortening associated with chromo-some instability is arrested in immortal cells which express telomerase activity. EMBO J 1992; 11: 1921-1929.
[27] Yang J, Chang E, Cherry AM, Bangs CD, Oei Y, Bodnar A, Bronstein A, Chiu CP, Herron GS. Human endothelial cell life extension by telom-erase expression. J Biol Chem 1999; 274: 26141-26148.
[28] Bodnar AG, Ouellette M, Frolkis M, Holt SE, Chiu CP, Morin GB, Harley CB, Shay JW, Lichtsteiner S, Wright WE. Extension of life-span by introduction of telomerase into normal human cells. Science 1998; 279: 349-352. [29] Vogelstein B, Kinzler KW. p53 function and
dysfunction. Cell 1992; 70: 523-526. [30] Nagy P, Schaff Z, Lapis K. Immunohisto-
chemical detection of transforming growth factor-beta 1 in fibrotic liver diseases. Hepatology 1991; 14: 269-273.
[31] Gressner AM, Weiskirchen R. Modern pathoge-netic concepts of liver fibrosis suggest stellate cells and TGF-beta as major players and thera-peutic targets. J Cell Mol Med 2006; 10: 76-99.
[32] Pinzani M, Gentilini A, Caligiuri A, De Franco R, Pellegrini G, Milani S, Marra F, Gentilini P. Transforming growth factor-beta 1 regulates platelet-derived growth factor receptor beta subunit in human liver fat-storing cells. Hepatology 1995; 21: 232-239.
[33] Casini A, Pinzani M, Milani S, Grappone C, Galli G, Jezequel AM, Schuppan D, Rotella CM, Surrenti C. Regulation of extracellular matrix synthesis by transforming growth factor beta 1 in human fat-storing cells. Gastroenterology 1993; 105: 245-253.
[34] Liu Y, Liu H, Meyer C, Li J, Nadalin S, Königsrainer A, Weng H, Dooley S, ten Dijke P. Transforming growth factor-β (TGF-β)-mediated connective tissue growth factor (CTGF) expres-sion in hepatic stellate cells requires Stat3 sig-naling activation. J Biol Chem 2013; 288: 30708-19.