ORIGINAL RESEARCH
Diffusion Tensor Imaging in the Assessment of
Normal-Appearing Brain Tissue Damage in
Relapsing Neuromyelitis Optica
C.S. Yu F.C. Lin K.C. Li T.Z. Jiang C.Z. Zhu W. Qin H. Sun P. Chan
BACKGROUND AND PURPOSE:Normal-appearing brain tissue (NABT) damage was established in multiple sclerosis by histology, MR spectroscopy, magnetization transfer imaging and diffusion tensor imaging (DTI). However, whether this phenomenon can be detected in relapsing neuromyelitis optica (RNMO) remains unclear. The aim of this study was to use DTI to investigate the presence of NABT damage in RNMO patients and its possible mechanism.
METHODS: Conventional MR imaging and DTI scans were performed in 16 patients with RNMO without visible lesions on brain MR imaging and in 16 sex- and age-matched healthy control subjects. Histogram analysis of mean diffusivity (MD) and fractional anisotropy (FA) was performed in the entire brain tissue (BT), white matter (WM), and gray matter (GM). Region of interest (ROI) analysis of MD and FA was also performed in WM regions connected with the spinal white matter tracts or optic nerve (including medulla oblongata, cerebral peduncle, internal capsule, and optic radiation), in corpus callosum without direct connection with them, and in some GM regions.
RESULTS: From histogram analysis, we found the RNMO group had a higher average MD of the BT, WM, and GM, a lower average MD peak height and a higher average MD peak location of the GM, and a higher average FA peak height of the WM than did the control group. From ROI analysis, compared with control subjects, RNMO patients had a higher average MD and a lower average FA in ROIs of WM connected with the spinal white matter tracts or optic nerve and a normal average MD and FA in corpus callosum without direct connection with them. In addition, a high average MD was found in parietal GM in these patients.
CONCLUSIONS: Our findings confirm the presence of abnormal diffusion in brain tissue in patients with RNMO and suggest that secondary degeneration caused by lesions in the spinal cord and optic nerve might be an important mechanism for this abnormality.
N
euromyelitis optica (NMO) is a severe form of demyeli-nating disease characterized by the selective involvement of spinal cord and optic nerves.1-6 NMO may follow a monophasic or multiphasic pattern; the latter is called relaps-ing NMO (RNMO).4-6In many patients, RNMO is initially misdiagnosed as multiple sclerosis (MS) because of the simi-larities in clinical manifestation. Numerous features, however, distinguish RNMO from MS, including its older age of onset, a more female preponderance, lesions restricted to spinal cord and optic nerves, greater attack severity, typically normal brain MR imaging findings, longitudinally extensive spinal cord lesions, CSF profile, pathologic findings, and immuno-pathologic characteristics.2-12Conventional MR imaging has been widely used to evalu-ate the abnormal changes in the spinal cord and optic nerve of patients with NMO.5,6,13,14Some previous studies, in which 1.5T MR imaging was used to investigate abnormal changes in brain tissue (BT), found that most NMO patients had no brain MR imaging abnormality, and a few of them had minor lesions
associated with age-related changes or other diseases.5,9,13 Some authors have used quantitative MR imaging to investi-gate whether patients with NMO had occult damage in nor-mal-appearing brain tissue (NABT) as found in MS.15-20One study19used magnetization transfer imaging (MTI) to inves-tigate the occult damage of the NABT in 8 patients with relaps-ing NMO and found no difference between patients and con-trol subjects. Another study20used MTI and diffusion tensor imaging (DTI) to investigate the abnormal changes in the nor-mal-appearing white matter (NAWM) and gray matter (NAGM) in 10 patients with NMO, and found reduced mag-netization transfer ratio (MTR) and increased apparent diffu-sion coefficient (ADC) of the NAGM in patients with NMO, which suggested the presence of gray matter damage in these patients. In addition, an abnormal pattern of movement-as-sociated cortical activations was reported in patients with NMO by using functional MR imaging,21which suggested the presence of adaptive reorganization in functional cortices in these patients.
The last 2 studies20,21indicate that subtle abnormality may be present in the NABT in patients with NMO. Such abnor-mality is caused either by secondary degeneration as a result of lesions in the spinal cord and optic nerve or by the presence of small, discrete lesions, which are beyond the resolution of con-ventional MR imaging to be detected. It is clinically important to determine the presence of occult BT damage in patients with RNMO and its possible mechanisms. If RNMO does not have occult damage in NABT, we can use this information to differentiate RNMO from MS. If RNMO has occult NABT Received August 3, 2005; accepted after revision September 30.
From the Departments of Radiology (C.S.Y., K.C.L., W.Q.) and Neurology (P.C., H.S.), Xuanwu Hospital, Capital University of Medical Sciences; and the National Laboratory of Pattern Recognition (F.C.L., T.Z.J., C.Z.Z.), Institute of Automation, Chinese Academy of Sciences, Beijing, China.
Supported in part by the Natural Science Foundation of China (30470519.30425004 and 60121302), Beijing Natural Science Foundation (7042026), and the National Key Basic Research and Development Program (973), (2004CB318107).
Address correspondence to Kun Cheng Li, MD, Department of Radiology, Xuanwu Hospital, Capital University of Medical Sciences, No. 45, Chang-Chun St, Xuanwu District, Beijing 100053, China.
BRAIN
ORIGINAL
damage only caused by secondary degeneration, it can be re-garded as a distinct disease from MS. If RNMO has occult NABT damage caused by both, this information indicates that RNMO is a subtype of MS. Our study had 2 major aims: 1) to globally investigate whether patients with RNMO have occult BT damage by using DTI histogram analysis and 2) to detect abnormal regions by using region of interest (ROI) analysis to clarify the possible mechanism for BT damage in patients with RNMO.
Methods
Subjects
From April 2003 to December 2004, we prospectively examined 100 patients with recurrent demyelinating diseases. Among them, 20 pa-tients satisfied the proposed diagnostic criteria of NMO6; 16 of these 20 patients had normal brain MR imaging, and 4 of them had brain lesions (3 patients exhibited multiple lesions in the frontoparietal white matter considered to be abnormal for their ages; one patient had a lacunar infarction in the internal capsule). The diagnosis of NMO required all absolute criteria (optic neuritis; acute myelitis; no evidence of clinical disease outside of the optic nerve or spinal cord) and one major supportive criterion (negative brain MR imaging at onset [does not meet criteria of Paty et al22for MS]; spinal cord MR imaging with signal intensity abnormality extending over at least 3 vertebral segments; CSF pleocytosis of⬎50 white blood cell count/ mm3or⬎5 neutrophils/mm3) or 2 minor supportive criteria (bilat-eral optic neuritis; severe optic neuritis with fixed visual acuity worse than 20/200 in at least one eye; severe, fixed, attack-related weakness [Medical Reseach Council (MRC) gradeⱖ2] in one or more limbs).6 To study whether NABT of patients with RNMO has occult damage and to exclude the influence of other concomitant disorders, we re-cruited only the 16 patients (1 man and 15 women) with normal brain MR imaging for further study. Their mean age was 35.4⫾11.8 years (range, 19 –55 years), the mean duration of the disease was 4.7⫾2.4 years (range, 1.0 – 8.0 years), and the mean Kurtzke Expanded Dis-ability Status Scale (EDSS) score was 3.4⫾1.2 (range, 1.5–5.0). Six-teen sex- and age-matched healthy volunteers (1 man and 15 women) with no history of neurologic disorders and a normal neurologic ex-amination served as control subjects. Their mean age was 35.4⫾11.8 years (range, 19 –55 years). None of the participating patients with RNMO was experiencing an acute relapse or was being treated with corticosteroids when MR images were obtained. Local ethical com-mittee approval and written informed consent from all subjects were obtained before the MR examinations.
MR Image Acquisition
MR images of the brain were obtained by using a 1.5T MR scanner (Sonata; Siemens, Erlangen, Germany). The following sequences with identical section position, number of sections (30) section thickness (4 mm), and intersection gap (0.4 mm) were obtained: 1) Turbo spin-echo (TSE) T2-weighted imaging (repetition time [TR], 5500; echo time [TE], 94; number of excitations [NEX], 3), 11 echo-train length, 256⫻224 matrix, 240⫻210 mm2field of view [FOV]); 2) T1-weighted spin-echo imaging (650/6/3 [TR/TE/NEX], 256⫻224 matrix, 240⫻210 mm2FOV); 3) Fluid-attenuated inversion recovery (FLAIR) sequence (8500/150/1 [TR/TE/NEX]; inversion time [TI], 2200; 8 echo-train length; 256⫻224 matrix, 240⫻210 mm2FOV); and 4) a spin-echo single-shot echo-planar pulse sequence (5000/ 100/10 [TR/TE/NEX], 128⫻112 matrix, and 240⫻210 mm2FOV).
A total of 7 image sets were acquired: 6 with noncollinear diffusion weighting gradients and with a b value of 1000 s/mm2, and one with-out diffusion weighting.
Image Analysis
Image analysis was performed on an off-line workstation. TSE T2-weighted and FLAIR images were used to exclude patients with le-sions in the brain from patients with RNMO. Diffusion tensor was calculated for each pixel according to the following equation23:
Si⫽S0exp(⫺bgiTDgi)共i⫽1,. . .,6兲,
whereSiis the measured signal intensity,S0is the T2-weighted signal intensity,giare diffusion sensitizing gradients, andDis a 3⫻3 diffu-sion tensor. The diffudiffu-sion tensor was estimated statistically, by using log-linear fitting of the data, on the basis of the least-squares meth-od.23After diagonalization of the tensor, the mean diffusivity (MD) and fractional anisotropy (FA) were derived for each pixel according to the following equations24:
MD⫽1⫹2⫹3 3
FA⫽
冑
共1⫺2兲2⫹共1⫺3兲2⫹共2⫺3兲2
2共1⫹2⫹3兲2
in whichi(i⫽1, 2, 3) are eigenvalues of diffusion tensor. Then, T2-weighted images of the DTI scans were coregistered with the T1-weighted images based on normalized mutual information method by using SPM2 (Wellcome Department of Imaging Neuroscience, London, UK). The same transformation parameters were then used to coregister the MD and FA images.
Pixels containing extracerebral tissue were removed from T1-weighted images with the use of a semiautomated technique provided by MRIcro (http://www.sph.sc.edu/comd/rorden/mricro.html). Brain gray matter (GM), white matter (WM), and CSF were automatically segmented from T1-weighted images with the use of multicontext fuzzy clustering technique,25because it is insensitive to the intensity inhomogeneity. Each pixel was classified as GM, WM, or CSF, and BT derived by the summation of the pixels of the GM and WM. Therefore, the masks of the BT, WM, and GM of all subjects were created, and the absolute volumes of the BT of all subjects were measured.
The resulting BT, WM, and GM masks were superimposed onto the MD and FA images. Then the corresponding MD and FA images of the BT, WM, and GM were created. Histograms, which contain 1000 bins, were created from these images. To compensate for vari-ability of brain size, each bin was normalized by the total number of voxels contributing to the histogram. From each of the histogram, the following measures were extracted: the average value, the histogram peak height, and the histogram peak location.
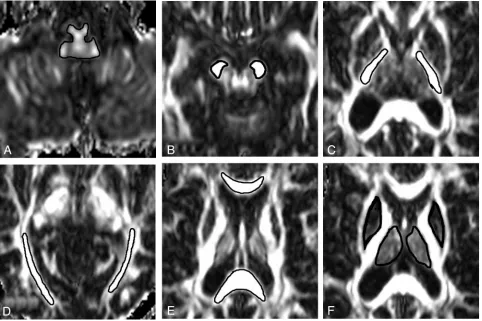
types of ROIs were defined on the FA images (Fig 1) and the last type of ROI was determined on the MD images. Two sides of a specific structure were regarded as a dedicated region of interest. The bound-ary of each region of interest was carefully defined to achieve the trade-off between consistence of ROI and the influence of partial volume effect. Intraobserver reproducibility of DTI measures from ROIs was also assessed. On 2 separate occasions (separated by at least 3 months), the same observer measured the average MD and FA of each of the considered ROIs from all 16 control subjects. The mean intraobserver coefficients of variation for the average MD and FA were calculated for all ROIs studied.
Statistical Analysis
A 2-tailed Studentttest for nonpaired data was used to examine the difference in each of the considered measurements derived from both ROI and histogram between patients with RNMO and control sub-jects. Similar to statistical methods used by previous studies26,27to reflect the large number of comparisons and to avoid type II errors,P valuesⱕ.005 were considered statistically significant.
Results
The average BT volume was 1135.6⫾67.3 mL for patients with RNMO and 1086.8⫾109.0 mL for control subjects. No significant difference was found between these 2 groups, indi-cating the absence of brain atrophy in patients with RNMO compared with control subjects. The intraobserver coefficient of variation was 0.73% and 1.32% for the average MD and FA of medulla oblongata; 0.85% and 1.06% for the average MD
and FA of cerebral peduncle; 0.74% and 1.17% for the average MD and FA of internal capsule; 1.15% and 1.37% for the av-erage MD and FA of optic radiation; 0.43% and 1.02% for the average MD and FA of splenium of corpus callosum; 0.52% and 1.18% for the average MD and FA of genu of corpus cal-losum; 0.67% and 1.09% for the average MD of putamen and thalamus; and 1.34%, 1.29%, 1.45%, and 1.37% for the aver-age MD of frontal, parietal, temporal, and occipital GM.
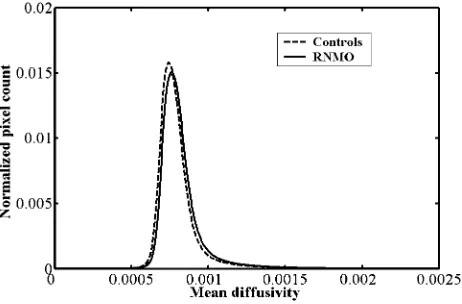
Compared with control subjects, we found the average MD histogram of the BT from patients with RNMO shifted to the right with a lower peak height (Fig 2). However, no obvious difference was found in average FA histograms between pa-tients and control subjects (Fig 3). Based on further analysis, we found that the average MD histograms of the GM and WM from patients with RNMO shifted to the right with lower peak heights (Figs 4 and 5) and that the average FA histogram of the WM from patients with RNMO shifted to the left with a higher peak height (Fig 6).
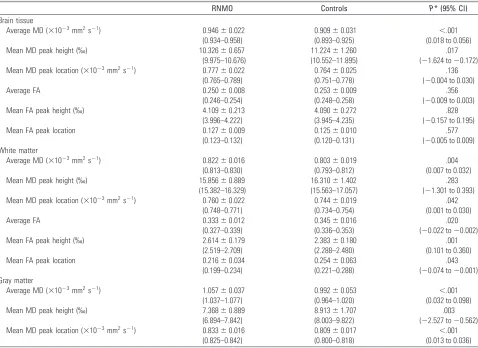
The MD and FA histogram-derived measures of the BT, GM, and WM from patients with RNMO and control subjects are reported in Table 1. The RNMO group had a significantly higher average MD of the BT (P⬍.001), WM (P⫽.004), and GM (P⬍.001); a lower average MD peak height (P⫽.003); a higher average MD peak location (P⬍0.001) of the GM; and a higher average FA peak height (P⫽.001) of the WM than the control group.
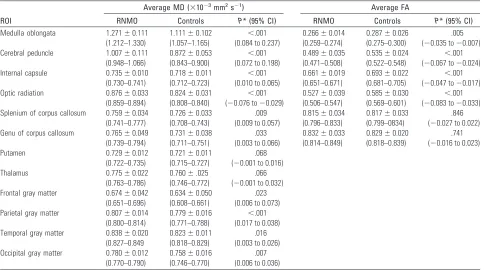
[image:3.585.53.535.43.364.2]of WM connected with the spinal white matter tracts or optic nerve, including medulla oblongata, cerebral peduncle, inter-nal capsule, and optic radiation, patients with RNMO had a significantly higher average MD and a lower average FA (Pⱕ
.005) than did control subjects. In ROIs of WM without direct connection with spinal cord or optic nerve, including sple-nium and genu of corpus callosum, however, no significant difference was found in average MD and FA between patients with RNMO and control subjects. The difference was not sig-nificant in average MD of putamen and thalamus of patients
with RNMO versus that of control subjects. The average MD of parietal GM from patients with RNMO was significantly different (P⬍.001) from that of control subjects.
Discussion
At first, RNMO was regarded as a subtype of MS, because both of them have a relapsing-remitting course. However, increas-ing evidence supports the concept that RNMO is a distinctive disorder.2-12 Some previous studies have confirmed that NAWM and NAGM had occult damage in patients with MS.15-18Such damage may be caused by occult brain tissue lesions (confirmed by pathologic studies28-31) and by the sec-ondary degeneration resulting from MS visible lesions. Some authors have reported that patients with NMO had occult damage in GM and adaptive reorganization in functional cor-tices.20,21However, whether such damage was present in brain WM and its possible mechanism (occult brain tissue lesions, secondary degeneration caused by lesions in the spinal cord and optic nerve, or both) need to be determined.
In this study, we first analyzed the MD and FA histograms of the BT to globally investigate whether patients with RNMO had abnormal brain diffusion. We found that they had a higher average MD than did control subjects, which indicated the presence of occult damage of BT in them. We can exclude the possible influence of partial volume effects from brain at-rophy contributing to this abnormality by the finding of no Fig 2.Average mean diffusivity (mm2
/s) histograms of the brain tissue from patients with relapsing neuromyelitis optica (RNMO) (solid line) and control subjects (dotted line).
Fig 3.Average fractional anisotropy histograms of the brain tissue from patients with relapsing neuromyelitis optica (RNMO) (solid line) and control subjects(dotted line).
Fig 4.Average mean diffusivity (mm2
/s) histograms of the brain white matter from patients with relapsing neuromyelitis optica (RNMO) (solid line) and control subjects (dotted line).
Fig 5.Average mean diffusivity (mm2/s) histograms of the brain gray matter from patients
with relapsing neuromyelitis optica (RNMO) (solid line) and control subjects (dotted line).
[image:4.585.302.533.41.197.2] [image:4.585.53.285.42.197.2] [image:4.585.52.289.232.388.2] [image:4.585.299.534.233.390.2] [image:4.585.55.286.426.578.2]statistically significant difference in brain tissue volume be-tween patients with RNMO and control subjects. However, this abnormality in the BT was not detected by a previous study,19which used MTI to investigate the occult damage of the NABT in 8 patients with RNMO and found no difference between patients and control subjects. This discrepancy is probably caused by the difference between what MTI and DTI methods measure (MTR measures the magnetization ex-change between mobile and bounded protons and reflects the percentage of residual axons and the degree of demyelina-tion32; MD measures the average molecular motion and is affected by cellular size and integrity; and FA is a measure of anisotropy and reflects the degree of alignment of cellular structures and their structural integrity23,24). Although some pathologic changes (demyelination and axon loss) may be de-tected by both DTI and MTI, the sensitivity of detecting dif-ferent pathologic changes may be difdif-ferent between these 2 methods. Another study20found that the NAGM in patients with RNMO had a reduced MTR and an increased ADC, which partly supported our results, but whether patients with RNMO had detectable abnormality in NABT was not re-ported. We consider that this discrepancy is probably caused by the difference in sensitivity between MTI and DTI methods. To further determine the specific region with abnormal diffusion in the BT, we analyzed the average MD histograms of the WM and GM and the average FA histogram of the WM.
[image:5.585.55.533.56.404.2]From the average MD histogram of the GM, we found that patients with RNMO had more pixels with a higher MD than did control subjects, indicating a reduction in “barriers” that restrict water molecular motion. Histogram peak height might be regarded as an index of the remaining healthy tissue, and a decrease in histogram peak height perhaps indicates that many healthy neurons are involved by the disease. Histogram peak location is the average MD value of the bin with the most pixels. In patients with RNMO, an increased histogram peak location may represent the increase of the average MD of the bin with the most pixels, which indirectly indicates that many neurons may have a reduced amount of “barriers ” restricting water molecular motion. Our results confirmed those of a pre-vious study.20Furthermore, the shape of the average MD his-togram of the GM of patients with RNMO versus control sub-jects was obviously different, suggesting that the MD histogram-derived measurements were distinctly different be-tween these 2 groups. Similar findings were also seen in the average MD histogram of the WM, but the extent of the dif-ference between the 2 groups was less than that of the GM. It is noteworthy that though the average FA histogram of the BT of patients with RNMO versus control subjects was not signifi-cantly different, the average FA histogram of the WM was clearly different between patients and control subjects. We also found that the most notable regions with decreased FA values were in pixels with high FA values, which indicated the
Table 1: MD and FA histogram-derived measures of brain tissue, gray matter, and white matter from patients with RNMO and control subjects
RNMO Controls P* (95% CI)
Brain tissue
Average MD (⫻10⫺3mm2s⫺1) 0.946⫾0.022 0.909⫾0.031 ⬍.001
(0.934–0.958) (0.893–0.925) (0.018 to 0.056) Mean MD peak height (‰) 10.326⫾0.657 11.224⫾1.260 .017
(9.975–10.676) (10.552–11.895) (⫺1.624 to⫺0.172) Mean MD peak location (⫻10⫺3mm2s⫺1) 0.777⫾0.022 0.764⫾0.025 .136
(0.765–0.789) (0.751–0.778) (⫺0.004 to 0.030) Average FA 0.250⫾0.008 0.253⫾0.009 .356
(0.246–0.254) (0.248–0.258) (⫺0.009 to 0.003) Mean FA peak height (‰) 4.109⫾0.213 4.090⫾0.272 .828
(3.996–4.222) (3.945–4.235) (⫺0.157 to 0.195) Mean FA peak location 0.127⫾0.009 0.125⫾0.010 .577
(0.123–0.132) (0.120–0.131) (⫺0.005 to 0.009) White matter
Average MD (⫻10⫺3mm2s⫺1) 0.822⫾0.016 0.803⫾0.019 .004
(0.813–0.830) (0.793–0.812) (0.007 to 0.032) Mean MD peak height (‰) 15.856⫾0.889 16.310⫾1.402 .283
(15.382–16.329) (15.563–17.057) (⫺1.301 to 0.393) Mean MD peak location (⫻10⫺3mm2s⫺1) 0.760⫾0.022 0.744⫾0.019 .042
(0.748–0.771) (0.734–0.754) (0.001 to 0.030) Average FA 0.333⫾0.012 0.345⫾0.016 .020
(0.327–0.339) (0.336–0.353) (⫺0.022 to⫺0.002) Mean FA peak height (‰) 2.614⫾0.179 2.383⫾0.180 .001
(2.519–2.709) (2.288–2.480) (0.101 to 0.360) Mean FA peak location 0.216⫾0.034 0.254⫾0.063 .043
(0.199–0.234) (0.221–0.288) (⫺0.074 to⫺0.001) Gray matter
Average MD (⫻10⫺3mm2s⫺1) 1.057⫾0.037 0.992⫾0.053 ⬍.001
(1.037–1.077) (0.964–1.020) (0.032 to 0.098) Mean MD peak height (‰) 7.368⫾0.889 8.913⫾1.707 .003
(6.894–7.842) (8.003–9.822) (⫺2.527 to⫺0.562) Mean MD peak location (⫻10⫺3mm2s⫺1) 0.833⫾0.016 0.809⫾0.017 ⬍.001
(0.825–0.842) (0.800–0.818) (0.013 to 0.036)
presence of occult damage in some white matter fiber tracts with high FA values.
To detect abnormal regions that will explain the abnormal changes in BT, we performed ROI analysis. The most impor-tant finding of our study was that in patients with RNMO, ROIs of the WM connected with the spinal white matter tracts or optic nerve had significantly higher MD and lower FA val-ues, compared with control subjects, whereas ROIs of the WM without direct connection with spinal cord or optic nerve had normal average MD and FA values. This finding indicated that secondary degeneration caused by lesions in the spinal cord and optic nerve might be the possible mechanism for the pres-ence of abnormal diffusion in BT. We did not find statistically significant differences in the average MD of putamen and thal-amus between patients and control subjects, which was con-sistent with findings of a previous study of MS.33This finding suggested either no abnormality in deep GM in patients with RNMO or lack of sensitivity of DTI for detecting possible ab-normalities of basal ganglia in them. In patients with RNMO, we also found obviously increased MD in parietal GM con-nected with the spinal white matter tracts and slightly in-creased MD in occipital GM connected with the optic nerve, which also supported our assumption that the abnormal brain diffusion is related to secondary degeneration caused by le-sions in the spinal cord and optic nerve. Although the above findings supported the idea that secondary degeneration was the main reason for abnormal brain diffusion in RNMO, we cannot absolutely exclude the possibility of the presence of primary subtle involvement of BT might partly contribute to the abnormal brain diffusion. In the future, biopsy examina-tions of RNMO may be helpful for clarifying this issue.
We speculate that our findings might have the following 2
clinical implications. One is that our study confirmed the con-cept of NMO being a distinct disease from MS, because they had different distribution mode of abnormal diffusion in NABT, which might indicate the presence of different sub-strates between these 2 disorders. The other is that we might monitor the progress of RNMO by measuring MD and FA in relevant brain regions (such as medulla oblongata, cerebral peduncle, internal capsule, and optic radiation), because brain DTI data are easily obtained and secondary degeneration is the main reason for brain abnormal diffusion in RNMO.
Although we found BT damage in patients with RNMO and indicated its possible mechanism, there exist some possi-ble limitations in this study. To our knowledge, no segmenta-tion method can perfectly segment WM and GM because of the influence of partial volume effect, noise, and relatively poor resolution of source images.25,34As a consequence, the used segmentation method inevitably brings some misclassi-fication in the interfacial regions of WM and GM in our study. The presence of low FA component (especially FA⬍0.2) in the average FA histogram of the WM also indicated this mis-classification. However, we are still convinced of the validity of our results because the proportion of misclassification is too small to significantly influence our results.
[image:6.585.53.540.57.327.2]Another possible limitation is the definition of ROIs. It is impossible to set an identical size of ROI at an absolutely iden-tical site in a dedicated structure for all subjects because of the variability of brain size. This difficulty in anatomic delimita-tion may cause misleading results in comparative studies. Fur-thermore, a small ROI cannot reflect overall status of a dedi-cated structure, so we used a relatively large ROI, which includes the greater part of 2 sides of a dedicated structure to globally reflect the status of the considered structure. We also
Table 2: Average MD and FA values of ROIs from patients with RNMO and control subjects
ROI
Average MD (⫻10⫺3mm2s⫺1) Average FA
RNMO Controls P* (95% CI) RNMO Controls P* (95% CI)
Medulla oblongata 1.271⫾0.111 1.111⫾0.102 ⬍.001 0.266⫾0.014 0.287⫾0.026 .005 (1.212–1.330) (1.057–1.165) (0.084 to 0.237) (0.259–0.274) (0.275–0.300) (⫺0.035 to⫺0.007) Cerebral peduncle 1.007⫾0.111 0.872⫾0.053 ⬍.001 0.489⫾0.035 0.535⫾0.024 ⬍.001
(0.948–1.066) (0.843–0.900) (0.072 to 0.198) (0.471–0.508) (0.522–0.548) (⫺0.067 to⫺0.024) Internal capsule 0.735⫾0.010 0.718⫾0.011 ⬍.001 0.661⫾0.019 0.693⫾0.022 ⬍.001
(0.730–0.741) (0.712–0.723) (0.010 to 0.065) (0.651–0.671) (0.681–0.705) (⫺0.047 to⫺0.017) Optic radiation 0.876⫾0.033 0.824⫾0.031 ⬍.001 0.527⫾0.039 0.585⫾0.030 ⬍.001
(0.859–0.894) (0.808–0.840) (⫺0.076 to⫺0.029) (0.506–0.547) (0.569–0.601) (⫺0.083 to⫺0.033) Splenium of corpus callosum 0.759⫾0.034 0.726⫾0.033 .009 0.815⫾0.034 0.817⫾0.033 .846
(0.741–0.777) (0.708–0.743) (0.009 to 0.057) (0.796–0.833) (0.799–0834) (⫺0.027 to 0.022) Genu of corpus callosum 0.765⫾0.049 0.731⫾0.038 .033 0.832⫾0.033 0.829⫾0.020 .741
(0.739–0.794) (0.711–0.751) (0.003 to 0.066) (0.814–0.849) (0.818–0.839) (⫺0.016 to 0.023) Putamen 0.729⫾0.012 0.721⫾0.011 .068
(0.722–0.735) (0.715–0.727) (⫺0.001 to 0.016) Thalamus 0.775⫾0.022 0.760⫾.025 .066
(0.763–0.786) (0.746–0.772) (⫺0.001 to 0.032) Frontal gray matter 0.674⫾0.042 0.634⫾0.050 .023
(0.651–0.696) (0.608–0.661) (0.006 to 0.073) Parietal gray matter 0.807⫾0.014 0.779⫾0.016 ⬍.001
(0.800–0.814) (0.771–0.788) (0.017 to 0.038) Temporal gray matter 0.838⫾0.020 0.823⫾0.011 .016
(0.827–0.849 (0.818–0.829) (0.003 to 0.026) Occipital gray matter 0.780⫾0.012 0.758⫾0.016 .007
(0.770–0.790) (0.746–0.770) (0.006 to 0.036)
Note:—RNMO indicates relapsing neuromyelitis optica; MD, mean diffusivity; FA, fractional anisotropy; ROI, region of interest. Values are expressed as mean⫾SD (95% confidence interval).
defined the margin of a ROI inner to the observed margin of the dedicated structure to eliminate the influence of partial volume effect from other structures.
Conclusion
We have shown the presence of abnormal diffusion in BT in patients with RNMO by the average MD histogram analysis. Moreover, we found that abnormalities were present both in the WM and GM in these patients by analyzing their MD and FA histograms. Finally, the abnormal changes of brain tissue have been found mainly in regions connected with the spinal white matter tracts or optic nerve in patients with RNMO by ROI analysis. It suggests that secondary degeneration caused by spinal cord and optic nerve damage might be an important reason for occult BT damage.
References
1. Wingerchuk DM, Weinshenker BG.Neuromyelitis optica.Curr Treat Options Neurol2005;7:173– 82
2. Bergamaschi R, Ghezzi A.Devic’s neuromyelitis optica: clinical features and prognostic factors.Neurol Sci2004;25:S364 – 67
3. Ghezzi A, Bergamaschi R, Martinelli V, et al.Clinical characteristics, course and prognosis of relapsing Devic’s Neuromyelitis Optica.J Neurol2004;251: 47–52
4. Wingerchuk DM, Weinshenker BG.Neuromyelitis optica: clinical predictors of a relapsing course and survival.Neurology2003;60:848 –53
5. O’Riordan JI, Gallagher HL, Thompson AJ, et al.Clinical, CSF, and MRI find-ings in Devic’s neuromyelitis optica.J Neurol Neurosurg Psychiatry1996;60: 382– 87
6. Wingerchuk DM, Hogancamp WF, O’Brien PC, et al.The clinical course of neuromyelitis optica (Devic’s syndrome).Neurology1999;53:1107–14 7. Correale J, Fiol M.Activation of humoral immunity and eosinophils in
neu-romyelitis optica.Neurology2004;63:2363–70
8. Nakashima I, Fujihara K, Fujimori J, et al.Absence of IgG1 response in the cerebrospinal fluid of relapsing neuromyelitis optica.Neurology2004;62: 144 – 46
9. Mandler RN, Davis LE, Jeffery DR, et al.Devic’s neuromyelitis optica: a clini-copathological study of 8 patients.Ann Neurol1993;34:162– 68
10. Lefkowitz D, Angelo JN.Neuromyelitis optica with unusual vascular changes.
Arch Neurol1984;41:1103– 05
11. Lucchinetti CF, Mandler RN, McGavern D, et al.A role for humoral mecha-nisms in the pathogenesis of Devic’s neuromyelitis optica.Brain2002;125: 1450 – 61
12. Mandler RN, Dencoff JD, Midani F, et al.Matrix metalloproteinase and tissue inhibitors of metalloproteinases in cerebrospinal fluid differ in multiple scle-rosis and Devic’s neuromyelitis optica.Brain2001;24:493–98
13. Fazekas F, Offenbacher H, Strasser-Fuchs S.MRI of neuromyelitis optica: evi-dence for a distinct entity.J Neurol Neurosurg Psychiatry1994;59:1140 – 42
14. de Seze J, Stojkovic T, Ferriby D, et al.Devic’s neuromyelitis optica: clinical, laboratory, MRI and outcome profile.J Neurol Sci2002;197:57– 61 15. Cercignani M, Inglese M, Pagani E, et al.Mean diffusivity and fractional
an-isotropy histograms of patients with multiple sclerosis.AJNR Am J Neurora-diol2001;22:952–58
16. Rovaris M, Gallo A, Valsasina P, et al.Short-term accrual of gray matter pa-thology in patients with progressive multiple sclerosis: an in vivo study using diffusion tensor MRI.Neuroimage2005;24:1139 – 46
17. Rashid W, Hadjiprocopis A, Griffin CM, et al.Diffusion tensor imaging of early relapsing-remitting multiple sclerosis with histogram analysis using auto-mated segmentation and brain volume correction.Mult Scler2004;10:9 –15 18. Bozzali M, Cercignani M, Sormani MP, et al.Quantification of brain gray
matter damage in different MS phenotypes by use of diffusion tensor MR imaging.AJNR Am J Neuroradiol2002;23:899 –900
19. Filippi M, Rocca M, Moiola L, et al.MRI and magnetization transfer imaging changes in the brain and cervical cord of patients with Devic’s neuromyelitis optica.Neurology1999;53:1705–10
20. Rocca MA, Agosta F, Mezzapesa DM, et al.Magnetization transfer and diffu-sion tensor MRI show gray matter damage in neuromyelitis optica.Neurology 2004;62:476 –78
21. Rocca MA, Agosta F, Mezzapesa DM, et al.A functional MRI study of move-ment-associated cortical changes in patients with Devic’s neuromyelitis op-tica.NeuroImage2004;21:1061– 68
22. Paty DW, Oger JJ, Kastrukoff LF, et al.MRI in the diagnosis of MS: a prospec-tive study with comparison of clinical evaluation, evoked potentials, oligo-clonal banding, and CT.Neurology1988;38:180 – 85
23. Basser PJ, Mattiello J, Le Bihan D.Estimation of the effective self-diffusion tensor from the NMR spin-echo.J Magn Reson B1994;103:247–54 24. Basser PJ, Pierpaoli C.Microstructural features measured using diffusion
ten-sor imaging.J Magn Reson B1996;111:209 –19
25. Zhu C, Jiang T.Multicontext fuzzy clustering for separation of brain tissues in magnetic resonance images.Neuroimage2003;18:685–96
26. Iannucci G, Rovaris M, Giacomotti L, et al.Correlation of multiple sclerosis measures derived from T2-weighted, T1-weighted, magnetization transfer, and diffusion tensor MR imaging.AJNR Am J Neuroradiol2001;22:1462– 67 27. Filippi M, Cercignani M, Inglese M, et al.Diffusion tensor magnetic resonance
imaging in multiple sclerosis.Neurology2001;56:304 –11
28. Allen IV, McKeown SR.A histological, histochemical and biochemical study of the macroscopically normal white matter in multiple sclerosis.J Neurol Sci 1979;41:81–91
29. Evangelou N, Esiri MM, Smith S, et al.Quantitative pathological evidence for axonal loss in normal appearing white matter in multiple sclerosis.Ann Neu-rol2000;47:391–95
30. Kidd D, Barkhof F, McConnel R, et al.Cortical lesions in multiple sclerosis.
Brain1999;122:17–26
31. Peterson JW, Bo L, Mork S, et al.Transected neurites, apoptotic neurons, and reduced inflammation in cortical multiple sclerosis lesions.Ann Neurol2001; 50:389 – 400
32. van Waesberghe JH, Kamphorst W, De Groot CJ, et al.Axonal loss in multiple sclerosis lesions: magnetic resonance imaging insights into substrates of dis-ability.Ann Neurol1999;46:747–54
33. Filippi M, Bozzali M, Comi G.Magnetization transfer and diffusion tensor MR imaging of basal ganglia from patients with multiple sclerosis.J Neurol Sci 2001;183:69 –72