reducing re-offending
local authority research
LGA
analysis and research
Acknowledgement
The Local Government Association would like to thank BMRB Social Research for conducting the survey and case studies.
We would also like to thank all those local authorities which responded to the survey, and in particular those people involved in the case studies.
Questions about the report should be addressed to Stephen Richards at the LGA:
Local Government House, Smith Square, London SW1P 3HZ
Contents
Executive summary 3
1 Introduction 5
1.1 Methodology 5
2 Targets and strategies for reducing re-offending 7
2.1 Local authority staff and responsibility for community safety 7
2.2 Strategies for reducing re-offending 8
2.3 Targets for reducing re-offending 9
2.4 Summary 10
3 Local authorities’ contributions to reducing re-offending 11
3.1 Priority level of reducing re-offending 11
3.2 Contributions to reducing re-offending 11 3.3 Services offered to offenders / offenders who are released in local area 12
3.4 Areas worked with to reduce re-offending 14 3.5 Services provided for offenders prior to release 14 3.6 Reviews of local authorities’ or partnerships’ roles in reducing re-offending 16 3.7 Perceived barriers to reducing re-offending 17
3.8 Summary 18
4 Partnerships / working with other organisations 19
4.1 Organisations which have an effect on reducing re-offending 19 4.2 Quality of working relationship with Criminal Justice System 20 4.3 Awareness of regional and other partnerships 21 4.4 Prevalence of elected members working within the CJS 21 4.5 Information sharing for releases in local area 22
4.6 Summary 26
5 Community Payback and Restorative Justice 27
5.1 Awareness of and involvement in Community Payback schemes in local area 27 5.2 Prevalence of Community Payback schemes in local area 27
5.3 Restorative Justice 29
5.4 Summary 29
Case studies 30
Index of tables and figures
Figure 1 Number of full-time equivalent community safety officers 7 Figure 2 Strategies which featured tackling re-offending in the local area 8 Table 1 Priority level of reducing re-offending 11 Table 2 Contributions authorities should make to the reduction of re-offending 12 Table 3 Services offered to offenders / offenders released in local area 12 Table 4 Services offered to offenders by first-tier and district authorities 13 Table 5 Areas worked with to reduce re-offending 14 Table 6 Whether local authorities provide facilities prior to release 15 Table 7 Facilities provided / funded for offenders prior to release 15
Figure 3 Perceived barriers to reducing re-offending 17 Figure 4 Perceived biggest barrier to reducing re-offending 18
Executive summary
This summary provides an overview of the main findings from research carried out on behalf of the Local Government Association (LGA) in 2007. Detailed findings are discussed in subsequent chapters in the main body of the report.
The survey was sent to all 410 local authorities in England and Wales. Overall, 176 local authorities
responded (43 per cent). Generally, the results from the survey are quite positive. Compared with the 2005 survey, reducing re-offending is now a higher priority for community safety teams.
Targets and strategies for reducing re-offending
• The number of community safety officers within local authorities has increased since 2005. Nearly four in ten local authorities in 2007 had two or more community safety offices compared with 17 per cent in 2005.
• The prevalence of local strategies for reducing re-offending has increased since 2005. Nearly all local authorities (91 per cent) had at least one local strategy which covered reducing re-offending. Targets usually featured in either the Crime and Disorder Reduction Partnership (CDRP) or Local Area Agreement (LAA) strategy.
• For 2007/8 it is mandatory for all first-tier authorities to include an indicator of re-offending in their LAA. All of the first-tier authorities surveyed were aware of this requirement and most had already implemented indicators for prolific and other priority offenders, young offenders and adult offenders.
• Knowledge of local re-offending rates remains uncommon; only one quarter (24 per cent) of respondents were able to estimate the local level of re-offending. Most respondents who were able to provide an estimate said the local level was better than the national average. Current figures suggest that 60 per cent of adult offenders re-offend within two years of their release.
Contributions to reducing re-offending
• The reduction of re-offending was a higher priority for local authorities than it was in 2005. Most
respondents rated the reduction of re-offending as a high or medium priority for their authority; 29 per cent rated it as a high priority compared with 17 per cent in 2005.
• All authorities surveyed provided at least one type of service for offenders before or after release. The most common services provided were drug and alcohol treatment / advice, housing advice, provision of housing on release, and benefits advice. First-tier authorities tended to provide a wider range of services for offenders, although district councils were providing a wider range of services than they were in 2005.
• Respondents most commonly thought that authorities should contribute to the reduction of re-offending through housing provision or support (64 per cent of all respondents mentioned this as one of the top three things that authorities should be involved in). Other common responses included employment provision or support, working in partnership with other agencies and drugs and alcohol rehabilitation / support / treatment.
Partnership and working with other organisations
• As in 2005, local authorities tended to have most contact with the police and Probation Services and rated the quality of their relationships with these two agencies positively. Of all local organisations, the police and Probation Services were thought to have the biggest effect on the reduction of re-offending.
• Local authorities’ relationships with Crown Courts, Magistrates’ Courts and the Prison Service were less positive. A significant proportion of respondents rated the quality of their relationship with these organisations as poor or very poor (respectively 33 per cent, 24 per cent and 25 per cent).
• Two-thirds (68 per cent) of local authorities had elected members working within another agency in the Criminal Justice System (most commonly within a police authority), an increase from 58 per cent in 2005.
• Information sharing between local authorities and the Prison and Probation Services has improved since 2005. A greater proportion of authorities in 2007 received information about at least some offenders when they were released (63 per cent and 74 per cent informed of releases by prison and probation respectively in 2007 compared with 42 per cent and 48 per cent in 2005) and a greater proportion had direct or indirect access to offenders’ computer records (35 per cent in 2007 compared with 25 per cent in 2005).
Community Payback and Restorative Justice
• At the time of the survey 86 per cent of respondents were aware of Community Payback schemes operating in their local area. Awareness of Payback schemes was more common within first-tier authorities than district councils. Restorative Justice schemes were less common than Payback schemes (operated in 43 per cent of local authority areas).
• The importance of local authorities being involved in the actual implementation of Community Payback schemes seems to have gained further recognition since 2005 (95 per cent compared with 84 per cent).
1 Introduction
The prison population in the United Kingdom has risen dramatically over the last decade and recent figures estimate the current population at c.80,0001
. The prison system is near capacity; at the time of writing available capacity within UK prisons and police cells was estimated at approximately 1,700.
Previous research by the Local Government Association (LGA)2
highlighted a number of issues with the current prison system and the way that offenders are dealt with after they are released. More than half (59 per cent)3
of all offenders are reconvicted within two years of release. This figure is significantly higher among young offenders. The evidence therefore suggests the current system is failing to rehabilitate offenders after they are released.
In November 2006, the government published the Offender Management Bill which implemented proposals relating to the National Offender Management Service (NOMS). The central aim of the bill is to reduce re-offending. The Home Office then introduced a mandatory re-offending indicator to be included in all 2007/8 LAAs for first-tier authorities in England.
Previous work by the Social Exclusion Unit (SEU) in 2002 (Reducing Re-offending by Ex-prisoners) identified a number of key factors which affected an offender’s likelihood of re-offending. These included: education, housing, drug and alcohol use, mental and physical health and housing. Offenders who had access to a support network to assist with these types of issues were less likely to re-offend. It is generally recognised that supporting offenders after they are released requires cross-agency working. No single organisation is capable of providing all the services that an offender may need.
The LGA commissioned BMRB in 2007 to conduct a survey of all local authorities in England and Wales to detail local authorities’ role in reducing adult re-offending, to identify barriers to reducing adult re-offending, and to ascertain the importance of the new LAA mandatory indicators on re-offending. The survey builds on similar research carried out on behalf of the LGA in 2004/54
. The previous survey identified a wide range of services and initiatives which local authorities were already involved in. The findings were used to benchmark local authorities’ contributions to the reduction of re-offending and highlight areas of best practice.
1.1 Methodology
Self-completion questionnaires were posted to each of the 410 local authorities in England and Wales. These were addressed to named individuals who were known to have responsibility for community safety in the local area. Individuals tended to be working as Community Safety Officers (or in an equivalent position). Questionnaires were sent with a covering letter from the LGA and a prepaid envelope so respondents could return questionnaires to BMRB. Initial questionnaires were sent in April 2007.
To encourage response, non-responders were sent reminder letters and a second reminder questionnaire. Reminders were sent during May and June 2007. In total 176 local authorities replied representing a
response rate of 43 per cent. The sample included 107 district councils, 10 county councils and 59 single-tier authorities. The response was comparable to that of the 2004/5 survey when 175 local authorities took part. Throughout the report comparisons are made between the benchmark 2004/5 survey and the current survey. Any changes identified between the surveys should be treated with caution as they may at least in part be attributable to changes in the sample.
1
NOMS – Prison population and accommodation briefing – 6 July 2007 2
Going Straight – reducing re-offending in local communities - 2005 3
Shepherd, A. and Whiting, E. (2006) Re-offending of adults: results from the 2003 cohort.
Online report for the Home Office. Available online at http://www.homeoffice.gov.uk/rds/pdfs06/hosb2006.pdf
4
As the number of county councils and single-tier authorities in the sample is small it is not possible to analyse the results of the survey by these two types individually. Instead, comparisons are made between district councils and ‘first-tier’ authorities5
(which includes county councils, London boroughs, metropolitan districts and other unitary authorities).
The questionnaire was based heavily on the 2004/5 benchmark survey although new questions relating to mandatory indicators and Community Payback were included. The questionnaire was developed jointly by BMRB and a steering group from the LGA. To assist the questionnaire design, a small-scale trial of five interviews was carried out by BMRB. The trial was carried out by telephone and was used to identify the suitability of new questions which had not been included in the previous survey.
The questionnaire consisted mainly of closed questions. However, respondents were asked to provide a written summary of effective and innovative schemes that their authorities were involved with locally to reduce re-offending rates. The questionnaire can be found in the appendix to this report.
The report consists of four main chapters: 1) Targets and strategies to reduce re-offending; 2) Local authorities’ contributions to reducing re-offending; 3) Partnerships and cross-agency working and; 4) Community Payback schemes and Restorative Justice. Case studies are presented at the end of the report highlighting areas of good practice among 11 local authorities that took part in the survey.
5
2
Targets and strategies for reducing re-offending
The chapter begins by looking at staffing capacity within local authorities for reducing re-offending. The chapter also covers strategies and targets that have been set for reducing re-offending.
2.1 Local authority staff and responsibility for community safety
The reduction of re-offending at the local authority level typically falls within the remit of community safety. Community safety teams are responsible for reducing crime and anti-social behaviour in their local authority areas and the reduction of re-offending is a key part of their work.
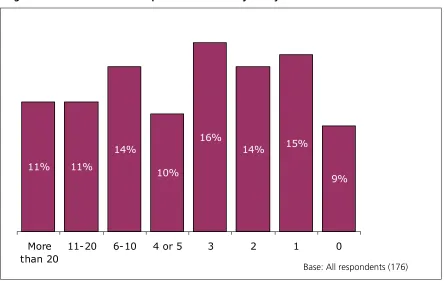
A large majority (91 per cent) of all local authorities had at least one full-time equivalent officer with
[image:9.595.65.511.298.579.2]responsibility for community safety (see Figure 1). This remains unchanged since 2005. Three-quarters (76 per cent) employed two or more full-time equivalent officers with 37 per cent employing more than five. The number of officers has increased since 2005 when only 17 per cent of authorities employed more than five.
Figure 1 Number of full-time equivalent community safety officers
11% 11%
14%
10%
16%
14% 15%
9%
More than 20
11-20 6-10 4 or 5 3 2 1 0
As in 2005, first-tier councils were more likely than district councils to have three or more full-time community safety officers (75 per cent compared with 28 per cent).
Most authorities (95 per cent) also had at least one executive member or portfolio holder with responsibility for community safety. This is comparable to the proportion in 2005 when 87 per cent had an executive member or portfolio holder in this type of position. These positions were equally common in district councils and first-tier authorities.
2.2 Strategies for reducing re-offending
The survey asked respondents if reducing re-offending featured in any local plans or strategies. Responses are summarised in Figure 2. At a local level there are a number of different strategies which relate to crime reduction. Typically these include: community strategies, Crime and Disorder Reduction Partnership (CDRP) strategies6
, police strategies and Local Area Agreement (LAA) strategies.
[image:10.595.64.514.256.582.2]Local strategies for reducing re-offending existed in nearly all the local authorities surveyed (94 per cent). This has risen from 81 per cent in 2005, suggesting that the reduction of re-offending has become a bigger issue at a local level. For authorities with a strategy for reducing re-offending, this most commonly featured in their CDRP / Community Safety Partnership (CSP) strategy or their LAA strategy (respectively 86 per cent and 79 per cent of all authorities who had a local strategy).
Figure 2 Strategies which featured tackling re-offending in the local area
Percentages do not add up to 100 as respondents could give more than one answer
6
CDRPs do no exist in Wales; the equivalent are CSPs (Community Safety Partnerships)
Base: All authorities with local strategies for reducing re-offending (166) 79%
56%
15%
1% 86%
CDRP
/ CSP LA
A
Police
Some
other
strate
gy
Not a
nswere
2.3 Targets for reducing re-offending
Mandatory indicators
For the year 2007/8, the Home Office requires all first-tier authorities in England to include an indicator of re-offending in their LAA. The indicator measures performance in relation to initiatives that attempt to ‘reduce the proportion of adult and young offenders and prolific and other priority offenders who re-offend’. The mandatory indicator does not apply to district councils in England or to Welsh authorities. All 63 respondents from first-tier authorities in England who took part were aware of the requirement for these mandatory indicators.
Those who were aware of the mandatory indicators were asked whether they had already set targets in the LAA. Nearly all (97 per cent) said that at least one of the three targets had already been set. Targets were most common for prolific and other priority offenders (83 per cent) and young offenders (81 per cent) while 62 per cent had targets for adult offenders.
Other official targets for reducing re-offending
Over a third (38 per cent) of all respondents said there were official targets outside of their LAA for reducing the adult re-offending rate. Four in ten (42 per cent) said that there were no such targets with the remaining 20 per cent saying they did not know whether a target existed. This suggests most targets are set as part of the LAA. There was little difference in the prevalence of official targets between district councils and first-tier authorities.
The majority (70 per cent) of respondents who said there was an official target for reducing adult
re-offending were unable to say what the target was. One in seven (14 per cent) said their target was to reduce rates by 1-5 per cent in the next year; 12 per cent said the target was between 6 per cent and 20 per cent over the next year.
Respondents were also asked how progress against these official targets was measured. A wide range of responses was given often involving an existing framework which was in use for Prolific and other Priority Offenders (PPOs). A typical response was:
‘Taking the cohort of adult prolific and priority offenders and measuring re-offending rates after they entered the scheme. Measures are taken each January. The baseline was established in 2007’
Current local re-offending rates
Current figures suggest that 59 per cent7
of all offenders re-offend within two years of their release. All respondents were asked to provide a comparable figure for their local authority area. Knowledge of the local re-offending rate was poor with three-quarters (76 per cent) saying they did not know or not answering the question. This may explain why so few respondents could provide a figure for the target reduction in re-offending. Without knowing the current local adult re-offending rate it is virtually impossible to set a meaningful target.
A total of 42 respondents were able to provide a figure for the local adult re-offending rate. Of these, 36 said the local adult re-offending rate was below or equal to the national rate of 59 per cent8
; 6 said the local rate was higher. The majority (86 per cent) of respondents who gave a figure indicated that it was an estimate.
7
Shepherd, A. and Whiting, E. (2006) Re-offending of adults: results from the 2003 cohort.
Online report for the Home Office. Available online at http://www.homeoffice.gov.uk/rds/pdfs06/hosb2006.pdf
8
The results suggest that little has changed since the 2005 survey. Few respondents were aware of the current re-offending rate two years ago. This suggests there is still scope for improving information sharing between Criminal Justice System (CJS) agencies and local authorities, without which it is unlikely that accurate
estimates of re-offending will become available to local authorities.
2.4 Summary
The number of staff within local authorities with responsibility for community safety has increased since the 2005 survey. Nearly all local authorities also had an executive member or portfolio holder with responsibility for community safety.
The majority (94 per cent) of local authorities had at least one local strategy which covered the reduction of re-offending. This most commonly featured in the CDRP/CSP or LAA strategy.
Awareness of the introduction of mandatory re-offending indicators was high (all respondents in English first-tier local authorities were aware). Nearly all respondents who were aware that their new LAA made it mandatory to set official targets for reducing re-offending said they had already set at least one. However, very few respondents were able to quantify their official target. Awareness of local re-offending rates was similarly low; only a quarter of respondents were able to provide an estimate for their local authority area.
3
Local authorities’ contributions to reducing re-offending
This chapter looks at local authorities’ perceptions of how they can contribute to the reduction of re-offending. The chapter covers the services provided by authorities for offenders prior to and after release. It also covers perceived barriers to reducing re-offending in the local authority area.
3.1 Priority level of reducing re-offending
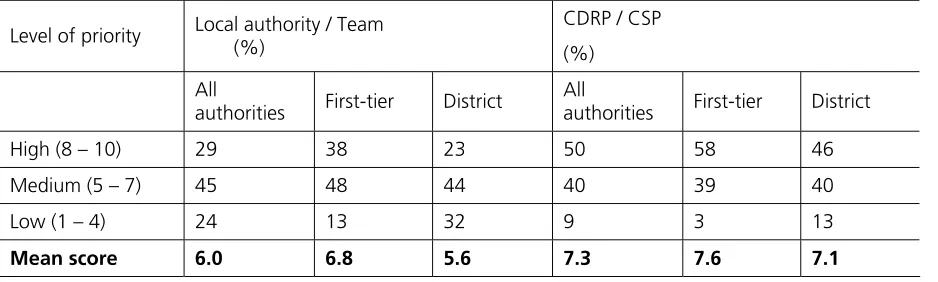
[image:13.595.66.535.262.403.2]Community safety teams have a wide range of responsibilities of which the reduction of re-offending is just one. All respondents were asked to rate how much of a priority the reduction of re-offending was for their local authority/team and for their CDRP/CSP. Ratings were made using a score of one to ten (one indicating ‘very low’ priority and ten ‘very high’ priority). Responses are summarised in Table 1.
Table 1 Priority level of reducing re-offending
Level of priority Local authority / Team (%)
CDRP / CSP (%)
All
authorities First-tier District All
authorities First-tier District
High (8 – 10) 29 38 23 50 58 46
Medium (5 – 7) 45 48 44 40 39 40
Low (1 – 4) 24 13 32 9 3 13
Mean score 6.0 6.8 5.6 7.3 7.6 7.1
Base: All respondents (176)
The majority of respondents rated the reduction of re-offending as a ‘high’ or ‘medium’ priority for both their local authority/team and their local CDRP/CSP. As observed in 2005, the reduction of re-offending was seen as a higher priority for the CDRP/CSP than for their own local authority/team.
Respondents from first-tier authorities were more likely than those from district councils to rate the reduction of re-offending as a high priority for their team (38 per cent and 23 per cent respectively). This difference was also present at the CDRP / CSP level (58 per cent and 46 per cent respectively).
Overall the reduction of re-offending was rated by more respondents as a higher priority than in 2005. At the time of the previous survey 17 per cent of respondents rated the reduction of re-offending as a high priority for their local authority/team, with 39 per cent rating it as high for the local CDRP/CSP.
3.2 Contributions to reducing re-offending
As evidenced in the 2005 survey, local authorities can contribute to the reduction of re-offending in a wide variety of ways. Respondents were asked to list the top three things that they thought authorities should do, both in terms of prevention and rehabilitation. These could be provided in any order (see Table 2 for
summary of results).
The most common response was housing support and provision, mentioned by two-thirds (64 per cent) of respondents. This reflects the significant involvement authorities have in providing council / housing
There was very little variation in the responses given by respondents from first-tier and district councils.
Table 2 Contributions authorities should make to the reduction of re-offending
All authorities (%)
First-tier (%)
District (%) Housing provision / support 64 61 65 Employment provision / support 31 32 30 Working in partnership with other agencies 23 29 20 Drugs / alcohol rehabilitation / support /
treatment 17 19 16
Preventative strategies 15 19 13
Involvement in PPO Strategy 13 12 14
Support offender and offender’s relatives 11 12 11 Education Training and Employment (ETE) –
specific mention of all three 11 16 7
Percentages do not add up to 100 as respondents could give more than one answer
Base: All respondents (176 / 69 / 107)
Comparisons between the current survey and the 2005 survey are not possible on this measure; in 2005 respondents were asked what contributions authorities could make rather than the contributions they should make.
3.3 Services offered to offenders / offenders who are released in local area
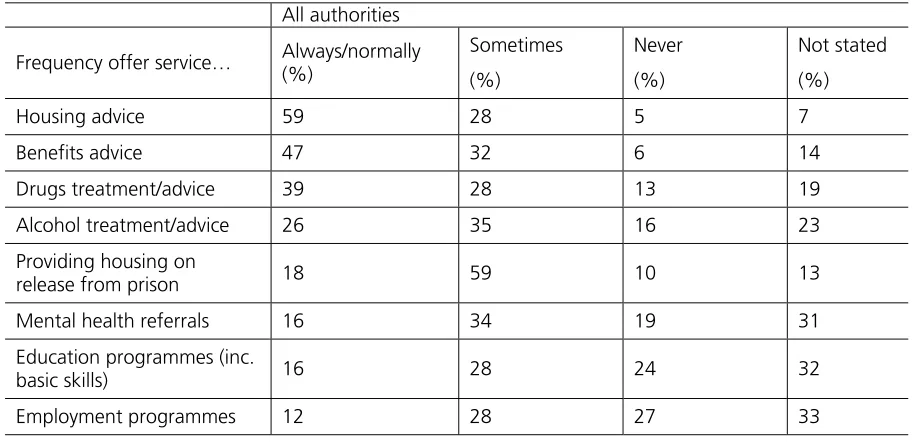
All respondents were asked what types of services they offered to offenders specifically to reduce
re-offending and how often they were offered (see Table 3). These could include services provided to offenders (ie those who are still in a prison or Young Offenders’ Institution) and offenders who had been released in their local area, and to services provided directly by the authority or commissioned by the authority and provided in partnership with other agencies.
Table 3 Services offered to offenders / offenders released in local area
All authorities
Frequency offer service… Always/normally (%)
Sometimes (%)
Never (%)
Not stated (%)
Housing advice 59 28 5 7
Benefits advice 47 32 6 14
Drugs treatment/advice 39 28 13 19
Alcohol treatment/advice 26 35 16 23
Providing housing on
release from prison 18 59 10 13
Mental health referrals 16 34 19 31
Education programmes (inc.
basic skills) 16 28 24 32
Employment programmes 12 28 27 33
Percentages do not add up to 100 as respondents could give more than one answer
[image:14.595.63.523.530.752.2]All authorities offered some kind of service for offenders. Overall, the most common types of services normally provided were housing advice (59 per cent of all local authorities), benefits advice (47 per cent) and drugs treatment or advice (39 per cent). These were also the three most common services provided by authorities in 2005. Education and employment programmes remained the least common services, as they were in 2005.
[image:15.595.61.506.221.407.2]The proportion of authorities that provided housing on release from prison decreased since the 2005 survey (18 per cent of all authorities compared with 39 per cent in 2005). This may simply be a reflection of the continuing decrease of authorities’ direct involvement in the provision of accommodation generally.
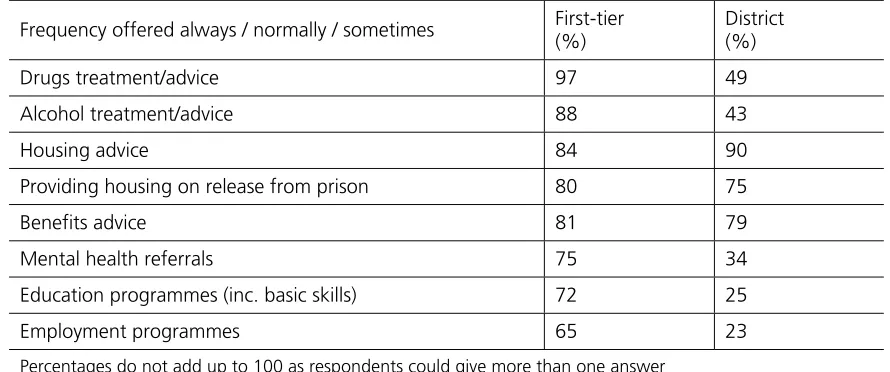
Table 4 Services offered to offenders by first-tier and district authorities
Frequency offered always / normally / sometimes First-tier (%)
District (%)
Drugs treatment/advice 97 49
Alcohol treatment/advice 88 43
Housing advice 84 90
Providing housing on release from prison 80 75
Benefits advice 81 79
Mental health referrals 75 34
Education programmes (inc. basic skills) 72 25
Employment programmes 65 23
Percentages do not add up to 100 as respondents could give more than one answer
Base: All first-tier/district councils (69 / 107)
As in 2005, there were differences in the types of services provided by first-tier authorities and district councils (see Table 4). Reflecting their wider remit, first-tier authorities were more likely than district councils to provide all but one of the services covered in the survey. The majority of first-tier authorities provided each of the eight services covered. For first-tier authorities, the most common services provided were drugs treatment or advice (97 per cent) and alcohol treatment or advice (88 per cent). In contrast, the most common services for district councils were housing advice (90 per cent), benefits advice (79 per cent) and provision of housing (75 per cent).
A half (51 per cent) of all respondent authorities also worked specifically with the families and children of offenders to reduce levels of re-offending. Previous research9
identified the importance of this type of work. The imprisonment of a family member can increase stress and pressure on family members and conversely the presence of a supportive family can be beneficial for offenders. There has been an increase in the prevalence of work with offenders’ families since the survey in 2005, when a third (36 per cent) of all authorities said their authority was involved in this type of work. First-tier authorities were more likely to be working with offenders’ families than district councils to reduce re-offending (57 per cent and 47 per cent respectively).
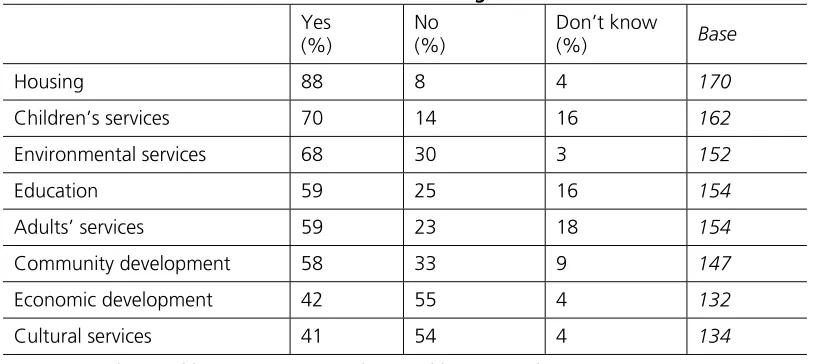
3.4 Areas worked with to reduce re-offending
[image:16.595.64.471.194.376.2]Community safety teams do not operate in isolation within local authorities; frequently teams work with other departments within an authority to deliver services and share expertise. Respondents were asked in which areas (if any) they worked with colleagues in their authority specifically to reduce re-offending. As not all authorities have the same departments, respondents were given the option of saying if a particular department was ‘not applicable’. Responses, where applicable, are summarised in Table 5.
Table 5 Areas worked with to reduce re-offending
Yes (%)
No (%)
Don’t know
(%) Base
Housing 88 8 4 170
Children’s services 70 14 16 162
Environmental services 68 30 3 152
Education 59 25 16 154
Adults’ services 59 23 18 154
Community development 58 33 9 147
Economic development 42 55 4 132
Cultural services 41 54 4 134
Percentages do not add up to 100 as respondents could give more than one answer
Base: All respondents (176)
All authorities worked with colleagues from a range of areas. The most common area that respondents worked with specifically in relation to reducing re-offending was housing (88 per cent). More than half of respondents indicated that they worked with children’s services (70 per cent), environmental services (68 per cent), education (59 per cent), adults’ services (59 per cent) and community development (58 per cent).
3.5 Services provided for offenders prior to release
As well as providing services for offenders when they are released into the local area, some local authorities provide facilities and services prior to release.
In the current survey, respondents were asked about services their authority provided directly or funded, commissioned or worked with other organisations to provide (responses are summarised in Table 6). Four in ten (39 per cent) of the authorities surveyed said they provided services prior to release in this way, compared to 15 per cent in 2005. A third (36 per cent) said they did not provided any services prior to release with the remaining quarter (25 per cent) saying they did not know if they provided any services. First-tier authorities were more likely than district councils to provide facilities or services prior to release (58 per cent compared with 27 per cent).
Table 6 Whether local authorities provide facilities prior to release
All
authorities First-tier District
Reducing re-offending a
HIGH
priority
Reducing re-offending
a MEDIUM
priority
Reducing re-offending a LOW
priority
% % % % % %
Provides facilities
prior to release 39 58 27 53 39 26
Does not provide facilities prior to release
36 26 42 31 34 44
Don’t Know 25 16 31 16 28 30
Base: All respondents (176 / 69 / 107/ 51/ 80/ 43)
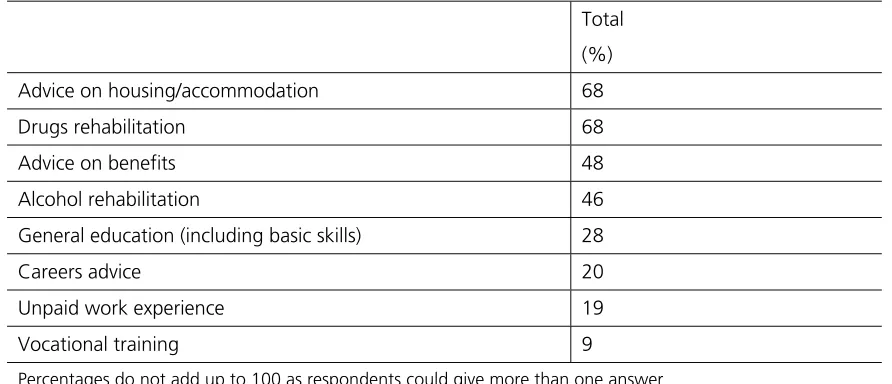
The types of facilities and services provided are shown in Table 7. Authorities most commonly provided advice on housing (68 per cent), drugs rehabilitation services (68 per cent), advice on benefits (48 per cent) and alcohol rehabilitation (46 per cent). In contrast, services relating to education and work were relatively uncommon. The range of services provided by first-tier authorities and district councils were similar.
Table 7 Facilities provided / funded for offenders prior to release
Total (%) Advice on housing/accommodation 68
Drugs rehabilitation 68
Advice on benefits 48
Alcohol rehabilitation 46
General education (including basic skills) 28
Careers advice 20
Unpaid work experience 19
Vocational training 9
Percentages do not add up to 100 as respondents could give more than one answer
Base: All authorities that provide facilities / services prior to release (69)
Two thirds (65 per cent) of all services provided prior to release were provided within a prison, 28 per cent were provided within a Young Offenders’ Institution and one in ten (9 per cent) were provided as part of a day release programme.
[image:17.595.62.508.353.545.2]Previous research has highlighted the need to follow-up schemes which are provided prior to release with continued work after offenders are released. Continued support between serving a sentence and being released helps to provide continuity for offenders and strengthens their support network when they are released. Encouragingly, the majority (78 per cent) of local authorities that were involved in providing services or facilities prior to release said that these services were followed up with continued work after release. One fifth (22 per cent) of respondents whose local authorities were involved in providing services or facilities prior to release said that all the services and facilities their authority was involved with were followed up.
3.6 Reviews of local authorities’ or partnerships’ roles in reducing re-offending
Respondents were asked if a review had ever been conducted of the role of their local authority or other local partnerships in reducing re-offending. These could include reviews of the role of the local authority itself, local CDRP / CSP or LSP (Local Strategic Partnership). Just over a quarter of all respondents (27 per cent) said that a review had been conducted at some point in the past.
Just one in twenty of all respondents (5 per cent) said there had ever been a review conducted by their local authority into their role in reducing re-offending rates. Reviews of the local authority’s role were most common among first-tier authorities (reviews had been conducted of 10 per cent of first-tier authorities). Reviews conducted by LSPs were even less common; just 2 per cent of all respondents said there had ever been a review by an LSP. In contrast, a quarter (23 per cent) of all respondents said there had been a review by their CDRP / CSP.
Nearly half (49 per cent) of the reviews conducted by a CDRP/CSP were conducted within the last year and a further 39 per cent were conducted between one and three years ago.
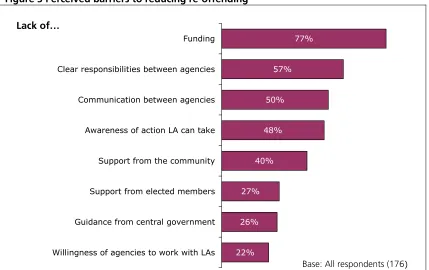
3.7 Perceived barriers to reducing re-offending
Up until this point the chapter has focused on the types of services that local authorities can provide to help reduce offending. Respondents were also asked what they thought were the barriers to them reducing re-offending in the local area. Figure 3 summarises the most common perceived barriers for all respondents.
[image:19.595.66.495.257.527.2]The most common perceived barriers were a lack of funding (77 per cent), a lack of clear responsibilities between agencies (57 per cent), a lack of communication between agencies (50 per cent), a lack of awareness of the action their authority could take (48 per cent) and a lack of support from the local community (40 per cent). This suggests that after funding the most common barriers to reducing re-offending relate to cross-agency working and the lack of communication / clear responsibilities between agencies and the local authorities.
Figure 3 Perceived barriers to reducing re-offending
22% 26%
27% 40%
48% 50%
57% 77%
Willingness of agencies to work with LAs Guidance from central government Support from elected members Support from the community Awareness of action LA can take Communication between agencies Clear responsibilities between agencies Funding
Percentages do not add up to 100 as respondents could give more than one answer
Base: All respondents (176)
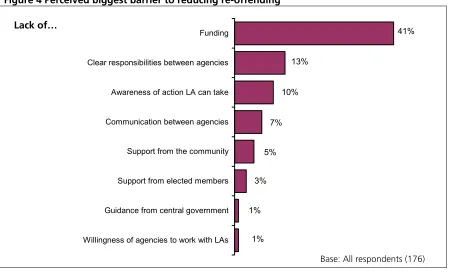
Respondents were also asked to select the single biggest perceived barrier to reducing re-offending in the local area (see Figure 4). Lack of funding was easily the most common response (41 per cent of all respondents) as it was in 2005 (41 per cent). Lack of clear responsibilities was the second most common response (13 per cent), this compares with 23 per cent of all respondents in 2005. This might suggest that difficulties with cross-agency working are perhaps less of a barrier than they were in 2005. Similarly in 2005, 40 per cent of all respondents cited lack of communication between agencies as the biggest barrier. In the 2007 the equivalent figure was 7 per cent.
[image:20.595.67.516.227.500.2]Unlike the 2005 survey, there were very few differences in opinion between respondents working for district councils and first-tier authorities; the most common perceived barriers were the same for both.
Figure 4 Perceived biggest barrier to reducing re-offending
1% 1%
3% 5%
7% 10%
13%
41%
Willingness of agencies to work with LAs Guidance from central government Support from elected members Support from the community Communication between agencies Awareness of action LA can take Clear responsibilities between agencies Funding
3.8 Summary
The reduction of re-offending remains a priority area for both first-tier authorities and district councils, and is rated a higher priority than in 2005. Most respondents rated the reduction of re-offending as either a high or medium priority for both their local authority and CDRP/CSP.
Local authorities are involved in providing a range of services and facilities for offenders. Services and facilities are most commonly provided after release although the proportion of authorities offering services and facilities prior to release has increased since 2005. There has also been an increase in the proportion of authorities that follow up these services after offenders are released.
First-tier authorities continue to be involved in providing a wider range of services for offenders than district councils. Overall the most common services provided for offenders were housing and benefits advice. First-tier authorities were more likely to be involved in ‘front-line’ services such as drug or alcohol treatment and advice.
The biggest perceived barrier to reducing re-offending locally was lack of funding. Lack of communication and clear responsibilities between agencies were seen as barriers by fewer authorities than in 2005, suggesting improvements in cross-agency working since the previous survey.
Lack of…
4
Partnerships / working with other organisations
This chapter looks at local authorities’ relationships with the Criminal Justice System (CJS) and its constituent parts: the prison and probation services, police and courts. The chapter also evaluates respondents’
perceptions of which agencies and organisations have the biggest impact on reducing re-offending within the local area.
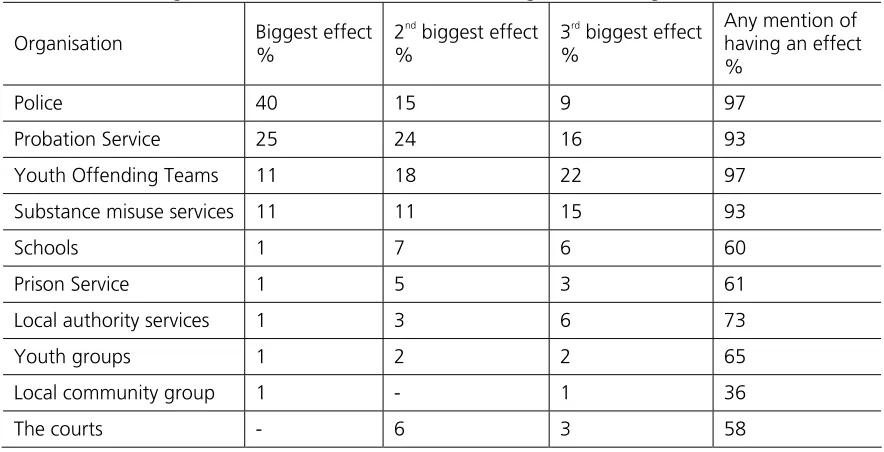
4.1 Organisations which have an effect on reducing re-offending
All respondents were asked which public service organisations they felt had any effect on reducing the level of re-offending in their local area. Responses are summarised in Table 8. Over nine in ten respondents felt that the police (97 per cent), youth offending teams (97 per cent), probation services (93 per cent) and substance misuse services (93 per cent) had an effect. The proportion of respondents that mentioned the police, youth offending teams, substance misuse services and probation services as having an effect on reducing re-offending has remained stable since the 2005 survey.
Nearly three-quarters of respondents (73 per cent) felt that local authority services had an effect on reducing the level of re-offending. First-tier authorities were more likely than district authorities to think that local authority services have an effect on reducing the level of re-offending (81 per cent compared with 67 per cent).
Respondents were then asked which organisations they felt had the biggest effect on reducing re-offending. Responses are summarised in Table 8. Four in ten respondents (40 per cent) felt that the police had the biggest effect on reducing re-offending. There had been no change in this respect since 2005. A quarter (25 per cent) of respondents indicated that the Probation Service had the biggest effect on reducing
re-offending, which is an increase from 2005 when 17 per cent felt the Probation Service had the biggest effect.
Around one in nine respondents said that the Youth Offending Teams and substance misuse services had the biggest effect (both 11 per cent). This is a decrease from 2005 where a quarter of respondents (25 per cent) thought Youth Offending Teams had the biggest effect on reducing re-offending. The difference in
[image:21.595.64.506.535.761.2]responses between authority types was minimal.
Table 8 Which organisations have an effect on reducing re-offending
Organisation Biggest effect %
2nd
biggest effect %
3rd
biggest effect %
Any mention of having an effect %
Police 40 15 9 97
Probation Service 25 24 16 93
Youth Offending Teams 11 18 22 97
Substance misuse services 11 11 15 93
Schools 1 7 6 60
Prison Service 1 5 3 61
Local authority services 1 3 6 73
Youth groups 1 2 2 65
Local community group 1 - 1 36
The courts - 6 3 58
4.2 Quality of working relationship with Criminal Justice System
[image:22.595.66.507.157.426.2]Respondents were asked to rate how good their own / their team’s relationship was with different parts of the Criminal Justice System. If the respondent or their team had little or no contact with the agency they had the option to indicate that the question was ‘not applicable’. The ratings of each agency are summarised in Figure 5 below.
Figure 5 Quality of working relationship with CJS agencies
3 3 2 2 2 1 13 8 7 10 1 20 14 17 15 7 49 50 45 44 18 1 15 22 27 25 50 19 1 3 3 4 22 80
0% 10% 20% 30% 40% 50% 60% 70% 80% 90% 100% Crown courts National Offender Management Service Magistrates' courts Prison Service Probation Service Police
Not stated Very poor Poor Neither good nor poor Good Very good
As Figure 5 shows, nearly all respondents (99 per cent) responsible for community safety said the quality of the relationship with the police was ‘very good’ or ‘good’, with 80 per cent rating their relationship as ‘very good’. No respondents rated their own or their team’s relationship with the police as ‘poor’ or ‘very poor’. The majority of respondents (72 per cent) also rated their own or their team’s relationship with the probation services as ‘very good’ or ‘good’. There were no differences in the relationships between first-tier and district council’s relationships with the police and probation services. The quality of the relationship between respondents or their team and the police was very similar when compared with the 2005 survey. There was an increase in the quality of the relationship with the Probation Service with 57 per cent indicating in 2005 that their relationship was ‘good’ or ‘very good’ compared with 72 per cent in 2007.
Around half of the respondents said the relationship with NOMS (50 per cent), the Crown Courts (49 per cent) and Magistrates’ Courts (45 per cent) was neither good nor poor. This is a slight increase from 2005 when 33 per cent of respondents said the relationship with Crown Courts was neither good nor poor and 37 per cent said this of Magistrates’ Courts. Heavy use of the mid-point on this type of scale (‘neither’) often indicates a lack of respondent knowledge. This suggests that local authorities did not have a particularly close relationship with these agencies, making it difficult for respondents to say whether the relationship was good or poor.
The quality of authorities’ relationships with the Prison Service, Magistrates’ Court and Crown Courts were rated less highly by respondents, with 29 per cent, 30 per cent and 16 per cent respectively indicating they were ‘very good’ or ‘good’. This is, however, an improvement from 2005 when the Prison Service (15 per cent), Magistrates’ Courts (26 per cent) and Crown Courts (10 per cent) were rated less highly. The
relationship with Crown Courts was rated most negatively, with 33 per cent of respondents rating it as ‘poor’ or ‘very poor’, which is a slight increase from 2005 when 24 per cent of respondents rated it as ‘poor’ or ‘very poor’. District councils were more likely than first-tier councils to rate the relationship with Magistrates’ Court as very poor/poor (30 per cent compared with 15 per cent).
4.3 Awareness of regional and other partnerships
Respondents were asked if they were aware of a number of different plans / partnerships including those arising through NOMS. The majority of respondents (56 per cent) indicated that they were not aware of regional commissioning plans for NOMS. More than half of the respondents (59 per cent) were aware of Regional Re-offending Delivery plans which are overseen by NOMS and aim to aid the effort towards reducing re-offending at a local level.
Respondents were less likely to be aware of the work of the Regional Board for Reducing Re-offending with three in ten (29 per cent) indicating that they knew about this. Only 15 per cent of respondents were aware of work conducted by ‘alliances’ (civil, corporate and faith / voluntary).
4.4 Prevalence of elected members working within the CJS
Respondents were asked whether their local authority had any elected members who worked for agencies within the Criminal Justice System (see Table 9). Overall, 68 per cent of local authorities had elected members working within the CJS.
[image:23.595.63.507.554.678.2]This increase seems to be mainly due to an increase in elected members within police authorities. Over half (53 per cent) said that their local authority had elected members ‘within a police authority’, compared with 42 per cent in the 2005 survey. Four in ten local authorities (40 per cent) indicated that they had elected members that worked as a magistrate, while just over one in ten (13 per cent) had elected members on a probation board. First-tier councils were more likely than district councils to have had elected members within a police authority, working as a magistrate, or on a probation board.
Table 9 Agencies within the CJS that have elected members working within them
All authorities %
First-tier %
District %
Within a police authority 53 72 40
Magistrate 40 46 36
On a probation board 13 22 7
Prison visitor 6 4 7
In some other role 6 10 4
Percentages do not add up to 100 as respondents could give more than one answer
4.5 Information sharing for releases in local area
Another indicator of how closely local authorities work with agencies within the CJS is how often they are informed when prisoners are released into the local area (irrespective of the location of the prison). Respondents were asked how often they are told about the release of prisoners into their local area by the prison and probation services. The findings are summarised in Figure 6.
Respondents indicated that the Probation Service and Prison Service were most likely to inform their local authority about the release of high risk offenders in their local area (40 per cent and 31 per cent respectively). Only one in ten (10 per cent) respondents stated that their local authority was informed by the Probation Service about all prisoners being released, with 9 per cent being informed by the Prison Service about all
releases. This is an increase from 2005 where only 3 per cent were informed of all releases by both the probation and prison services.
[image:24.595.66.510.374.756.2]Nearly one in five respondents (19 per cent) said that their local authority was never informed by the Prison Service of offenders being released in their area while one in ten (11 per cent) authorities said that they were never informed by the Probation Service. Whilst still relatively high, these rates are lower than in 2005 when 33 per cent of respondents said that they were never informed by the Prison Service and 28 per cent were never informed by the Probation Service. These changes suggest a greater level of communication between these agencies and teams within local authorities. District councils were more likely to say they were never informed of offenders being released by both the probation and prison service.
Figure 6 Frequency of information received about released offenders
9% 31% 5% 8% 10% 19% 19% 10% 40% 6%
9% 9% 11%
15% 0% 5% 10% 15% 20% 25% 30% 35% 40% 45% All releases Some releases-high risk offenders Some releases-other groups of offenders
On an ad hoc basis
Rarely Never Not Stated
Prison Probation
Respondents who indicated that they were told about offenders who were released in their local area were asked what type of information they actually received in relation to offenders’ needs. Responses are summarised in Table 10.
[image:25.595.65.503.248.431.2]The most common type of information provided about offenders when they were released in the local area related to housing needs (52 per cent said the Prison Service provided it and 56 per cent said the Probation Service provided it). Half of local authorities said that they received information regarding drugs/treatment advice needs of released offenders from the prison and probation services (42 per cent and 46 per cent respectively). More than two-fifths of local authorities that did receive information on released offenders were told about offenders needs for alcohol treatment/advice (35 per cent by prison, 39 per cent by probation).
Table 10 Type of information received about released offenders’ needs
Prison %
Probation %
From either %
Housing 52 56 60
Drugs treatment/advice 42 46 51
Alcohol treatment/advice 35 39 44
Mental health treatment 30 31 34
Benefits advice 18 31 29
Employment 16 27 27
Education 16 25 27
None of these / Not applicable 9 7 8
Percentages do not add up to 100 as respondents could give more than one answer
Base: All authorities that were informed of releases (91/114/124)
First-tier councils were more likely than district councils to be given information about released offenders’ drugs treatment/advice needs. There was very little difference between respondents from first-tier and district council in terms of information received for all the other released offenders’ needs.
For each type of information the authority received, respondents were asked to indicate whether they received this information before, at the time of, or after the release of offenders. Responses are summarised in Figure 7.
Around two-thirds of respondents who received information regarding released offenders’ drugs, alcohol and mental health treatment needs were given the information before the offenders’ release (69 per cent, 64 per cent and 63 per cent respectively). Just under half were told about offenders’ needs for housing and
[image:26.595.65.548.235.668.2]education (49 per cent for each) before their release. Over one in five respondents who were told about offenders’ employment and education needs were told after the offender’s release (22 per cent and 23 per cent respectively).
Figure 7 When receive information regarding released offenders needs
Percentages do not add up to 100 as respondents could give more than one answer
When respondents were asked whether they felt they received the right level of information about offenders released in their local area, nearly half said that they received too little information (45 per cent) and a quarter (24 per cent) said they received about the right amount of information. Nearly a third (30 per cent) of respondents indicated that they did not know whether the amount of information they received was too much or too little. There was little difference in the proportion of respondents from first-tier councils compared with district councils who said they received too little information.
69 64 63 49 49 39 36 13 15 16 21 11 18 22
3 4 5
9
23
16
22
16 18 16
21 17 26 19 0 10 20 30 40 50 60 70 80 Drug s trea
tmen t/ad
vice
Alco hol tr
eatme nt/a
dvice
Ment al he
alth treat men t Hous ing Educ ation (i
nc. B asic S
kills)
Bene fits a
dvice
Empl oym
ent
Before release At the time of release After release Don't Know
Respondents who said that they received too little information were asked what additional information they would like to receive. One main theme that can be identified from the responses is that respondents would like information about offenders’ needs, especially regarding housing and substance misuse. A second theme is that respondents would like to know the risk posed by released offenders to the general public. Typical responses were:
‘When being released (with plenty of notice). Specific needs (housing esp).’
‘Who, where, risk type, needs, relations, substance dependency’
‘Level of risk - History of substance misuse how their behaviour has affected local community before custody. What other needs are required i.e. employment etc’
‘Release dates/risk factors/house information/health needs’
One way that local authorities can get more information about released offenders is through direct or indirect access to computer records (for example, records held by the Probation Service). Respondents were asked whether they or anyone on their team had any access to computer records for the offenders who were released into their local area. Over a third (35 per cent) of respondents said that they or someone on their team had direct or indirect access to computer records. This represents a slight increase from 25 per cent in 2005. More than half (55 per cent) of respondents said that their team had no access to offenders’ computer records. One in ten (10 per cent) respondents indicated that they were unsure of whether their team had access to computer records of released offenders.
Just 6 per cent of respondents said that they or someone on their team had direct access to computer records which is the same proportion that was found in 2005. This suggests that most access was through another agency or organisation. Many local authorities would have needed to request information through the Probation Service on an ad hoc basis.
[image:27.595.63.484.518.727.2]Other than the prison and probation services notifying respondents about released offenders needs, there are other ways that they can find out this information. Table 11 summarises the other avenues that information came through.
Table 11 Other ways of finding out about offenders needs
All authorities %
Through the police 76
When they present themselves to housing departments 73 When they present themselves to adults’ social care services 26
From families of offenders 15
When they present themselves to ward councillors’ surgeries 11 Through offenders’ children’s schools 7
Through the Primary Care Trust 6
No other way 4
Other 9
Percentages do not add up to 100 as respondents could give more than one answer
The most common response given was through the police (76 per cent). A similar proportion (73 per cent) of respondents said that they found out about offenders’ needs when they presented themselves to housing departments. Other less common responses included when offenders presented themselves to adults’ social care services, through families of offenders and when they presented themselves to ward councillors’ surgeries.
The ways in which local authorities receive information about released offenders needs have become a lot more varied than at the time of the 2005 survey. In 2005, one-fifth (21 per cent) of respondents said that they did not receive information about released offenders needs other than through the police and probation services. This is compared with just four per cent who gave this response in the current survey.
4.6 Summary
Evidence suggests that local authorities’ relationships with agencies in the CJS have improved since 2005 and that the level of information sharing between agencies has increased. The majority of respondents indicated that the quality of their own or their team’s relationship with the police and Probation Service was ‘very good’ or ‘good’. The relationship with the Probation Service has improved since the 2005 survey. Relationships with other elements of the CJS were rated less positively.
Over two-thirds of local authorities had elected members working within the CJS, which is an increase from 2005. There has been in an increase in the proportion of local authorities that had elected members ‘within the police authority’ compared with the 2005 survey.
There has been a decrease in the number of respondents who said their authority never received information on offenders who are released in their area compared with the 2005 survey.
Aside from the Prison Service and Probation Service, the most common other ways that authorities found out about offenders’ needs were ‘through the police’ and ‘when they present themselves to housing
5
Community Payback and Restorative Justice
Community Payback was launched in November 2005 and gave communities the opportunity to influence the work that offenders carry out in their neighbourhoods. Typical jobs that offenders carry out through Payback are graffiti removal, painting and gardening. This chapter looks at the awareness of and involvement of local authorities in Community Payback schemes as well as their involvement in Restorative Justice
schemes.
5.1 Awareness of and involvement in Community Payback schemes in local area
[image:29.595.65.505.274.362.2]Respondents were asked whether they were aware of any Community Payback schemes operating in their local area (See Table 12). Over eight in ten respondents (86 per cent) were aware of Community Payback schemes operating in their local authority area.
Table 12 Awareness of Community Payback schemes in local area
Total %
First-tier %
District %
Yes – aware 86 94 82
No – not aware 9 3 12
Don’t know 5 3 6
Base: All respondents (176/69/107)
5.2 Prevalence of Community Payback schemes in local area
Respondents who were aware of Community Payback schemes operating in their local area were asked whether they or their team had been consulted in the design of any of these schemes. Nearly two-thirds (63 per cent) of respondents said that they had been consulted on the design of a current scheme with a third (33 per cent) saying they had not been consulted. The remaining four per cent said they did not know or failed to answer the question. Teams within first-tier authorities were more likely than teams within district councils to have been consulted on the design of local Community Payback schemes (74 per cent compared with 55 per cent).
When asked how important it was for their local authority to be consulted in the design of Community Payback schemes almost all said that it was very or fairly important (95 per cent) which is a slight increase from 200510
(84 per cent). The importance of being consulted on the design of Community Payback schemes was high for all types of councils, with 94 per cent of district councils and 99 per cent of first-tier councils indicating it was important (responses are summarised in Table 13).
10
Table 13 Importance of consulting authorities on design of schemes
All authorities
%
District councils %
First-tier councils %
Very important 65 60 74
Fairly important 30 34 25
Not very important 3 4 1
Not at all important - - -
Not stated 2 3 -
Very/fairly important 95 94 99
Base: All respondents (176/107/69)
Six in ten respondents (60 per cent) indicated that their authority had been involved in the implementation of a Community Payback scheme. This indicates an increase in the use of Payback and community sentencing since 2005. In the 2005 survey only one in three authorities (36 per cent) indicated that they had been involved in the implementation of community sentencing programmes. In 2005, it was also suggested that there was a communication gap between the different agencies involved in community sentences and local authorities.
First-tier councils were more likely than district councils to have been involved with Community Payback schemes (71 per cent and 53 per cent respectively). This may simply be a reflection of the larger the geographical areas that first-tier authorities generally cover.
Respondents were asked to rate the local community’s general feeling towards offenders serving community sentences in the area (see Table 14). The majority of respondents (62 per cent) indicated that in their view the community was generally positive towards community sentences. This has increased from 31 per cent in 2005. Only one in ten (11 per cent) respondents felt that the local community was negative towards
community sentences in their local area. Whether a respondent was from a first-tier or district council did not seem to have an affect on the ratings of their community’s feeling towards offenders serving community sentences.
Table 14 How local community rate community sentences in local area
Total %
District councils %
First-tier Councils %
Very positive 15 15 16
Fairly positive 47 45 49
Neither positive nor negative 22 21 23
Fairly negative 10 13 6
Very negative 1 1 -
Not stated 5 5 5
Very/fairly positive 62 60 65
Very/fairly negative 11 14 6
[image:30.595.62.522.525.705.2]5.3 Restorative Justice
As well as Community Payback, councils can also be involved in Restorative Justice. This is similar in some respects to the Payback schemes discussed above. Restorative Justice schemes aim to involve the victims, offenders and communities in an effort to decide how to respond to a particular crime.
[image:31.595.66.507.240.338.2]The survey suggested that overall there was a fairly even split between authorities that were involved in Restorative Justice and authorities that were not involved (43 per cent compared with 45 per cent). Table 15 summarises the results from the relevant questions. A significantly higher proportion of first-tier councils (70 per cent) than district councils (26 per cent) indicated they have been involved with Restorative Justice Schemes.
Table 15 Whether authorities involved in Restorative Justice schemes
Total %
First-tier %
District %
Yes – involved 43 70 26
No – not involved 45 23 59
Don’t know 12 7 15
Base: All respondents (176/69/107)
5.4 Summary
The results presented in this chapter indicate, perhaps unsurprisingly, that local authorities have become more involved in Community Payback and Restorative Justice since the 2005 survey. The majority of local authorities had been involved in the implementation of a Community Payback scheme. Around two-thirds of respondents who were aware of Community Payback in their local area had actually been consulted in the design of a scheme. The majority of respondents would also welcome further consultation in the design of Community Payback schemes.
Case studies
Eleven in-depth interviews were carried out with local authorities during July and August 2007. Local authorities were selected to take part in this part of the research based on their responses at the main quantitative survey. The eleven local authorities were all involved in particularly interesting and effective schemes which had been designed to reduce adult re-offending in the local area.
All interviews were carried out by telephone and generally took around 30 minutes to complete. The interviews were used to establish how the schemes had been designed and implemented. Where possible, emphasis was placed on measuring the success of these schemes.
1) Cumbria County Council - Scafell
Scafell is a multi-agency programme targeting prolific and priority offenders in three distinct geographical areas of Cumbria. Offenders are selected for the scheme based on the volume of crime they have been involved with rather than the offence type. This approach aims to bring down the overall crime and re-offending rates as much as possible in the most efficient way possible.
The programme is holistic and multi-agency in nature. It is currently managed and funded through Safer and Stronger Communities Fund, Local Area Agreement pump prime funding and by the Crime and Disorder Reduction Partnerships, the Cumbria Drug and Alcohol Action Team, Cumbria Constabulary and Cumbria Probation Service. Joint working between the agencies who are involved in the programme has helped to ensure that offenders (who are often living chaotic lives) receive help and access to services in a joined up and coherent way. The services managed under the umbrella of Scafell include: housing, drugs and alcohol treatment, education, training, education and employment.
All offenders who are involved in Scafell are monitored using the OASyS assessment system. The success of the project is measured in terms of reconviction rates but also in terms of offending data. The latter consists of a combination of police data (including arrests and enquiries) and offenders’ self-reported offending behaviour. The organisers of the scheme have found the use of offending data particularly useful as this ensures that the offender managers are in a position to direct appropriate resources to target and respond to such offending. Generally conviction data are used to monitor the success of the scheme against LAA mandatory targets; offending data are used in daily, weekly and monthly reviews of the Scafell programme.
The Scafell programme has been a great success in Cumbria. During the first six months of the programme a reduction of 60-82 per cent in re-offending rates was seen among the offenders who were involved.
Cumbria is the only county to have a stretch target11
in place in relation to prolific and other priority
offenders. From 1 April 2007 partners in the programme have signed up to a target of reducing offending by 20 per cent in each of the next three years.
Local residents have also seen the benefits of the scheme. Prolific offenders can often be disruptive to the local neighbourhoods where they are housed; the Scafell programme ensures that prolific offenders are monitored closely and the reduction in their offending behaviour corresponds with a reduction in localised anti-social behaviour and crime which benefits local communities.
Mark Pannone, Chief Inspector, Cumbria Police Email: [email protected]
http://www.gnn.gov.uk/Content/Detail.asp?ReleaseID=265453&NewsAreaID=2
11
2) Basingstoke and Deane Borough Council - RHINO
RHINO(Recidivist Holistic Interventions North-East Operational Command Unit) was established in January 2007 and brings together four separate CDRP teams from across Hampshire. The project centres on the relocation of staff from a range of agencies to work at the same location and increase the amount of day to day contact across these agencies. The RHINO team, including a manager, three police officers, two
Probation Service officers and a client services co-ordinator (who is a qualified drugs and alcohol counsellor) now work out of the same office within Basingstoke Police Station but covers the police operational
command area of the North and East of Hampshire. The scheme provides guidance and support in relation to training and education, employment advice, drug and alcohol services and housing advice to prolific
offenders.
The client services co-ordinator was a new role created specifically for the RHINO scheme. The co-ordinator is responsible for case-managing a programme of work in which an offender is involved. In this sense the co-ordinator fulfils a similar role as a probation officer. The post was created to fill the gap for offenders who were not the responsibility of the Probation Service. Prior to the creation of the post, offenders who were not being supervised by the Probation Service often had no-one to co-ordinate a programme of work aimed at their rehabilitation and resettlement.
The scheme is based on a government strategy targeted at prolific and priority offenders and is more focused than some other similar schemes. Around 60 prolific offenders across the area will be involved in the scheme at any one time. However, the RHINO team usually focuses on those offenders who are out of prison, in the community and judged to be most at risk of re-offending. In some respects the scheme is based on a similar framework as MAPPA (Multi Agency Public Protection Agency).
Prior to RHINO, staff from different agencies tended to meet once a month at CDRP meetings. It was felt that the gaps between meetings were long and consequently the information shared was not always up to date. With staff working out of the same premises, contact between agencies is virtually continuous. This increases the ability to share knowledge and co-ordinate and signpost services for prolific offenders more efficiently. The change has been particularly useful for dealing with offenders who are let out of prison on early release; this often happens at short notice leaving local authorities little time to co-ordinate an offender management plan.
As RHINO is still a relatively new scheme, baseline measures of re-offending are still in the process of being created. The success of the scheme will be measured by looking at the re-conviction rates of those offenders selected for the RHINO scheme compared to their benchmark conviction rate for the 12 month period before participation in the scheme. The scheme target is to reduce re-offending rates by 15 per cent over the next 12 months. It is hoped that reductions in re-offending and baseline crime figures can eventually be linked to British Crime Survey data to estimate the financial benefits of RHINO.
3) Hartlepool Borough Council – Dordrecht Project
This is a well established multi-agency programme to target prolific adult offenders. Offenders are selected to go into the scheme in partnership with the local police. Initially the 50 most prolific burglary offenders were selected to go on the project. Burglary had been identified as a specific problem in the Hartlepool area.
The Hartlepool scheme was developed after its co-ordinators had visited authorities who already had a similar programme in place. Funding for the project was initially