SUMMARY
Only a few studies on quadrupedal locomotion have investigated symmetrical and asymmetrical gaits in the same framework because the mechanisms underlying these two types of gait seem to be different and it took a long time to identify a common set of parameters for their simultaneous study. Moreover, despite the clear importance of the spatial dimension in animal locomotion, the relationship between temporal and spatial limb coordination has never been quantified before. We used anteroposterior sequence (APS) analysis to analyse 486 sequences from five malinois (Belgian shepherd) dogs moving at a large range of speeds (from 0.4 to 10.0·m·s–1) to compare symmetrical and asymmetrical gaits through kinematic and limb coordination parameters. Considerable continuity was observed in cycle characteristics, from walk to rotary gallop, but at very high speeds an increase in swing duration reflected the use of sagittal flexibility of the vertebral axis to increase speed. This change occurred after the contribution of the increase in stride length had become the main element driving the increase in speed – i.e. when the dogs had adopted asymmetrical gaits. As the left and right limbs of a pair are linked to the same rigid structure, spatial coordination within pairs of limbs reflected the temporal coordination within pairs of limbs whatever the speed. By contrast, the relationship between the temporal and spatial coordination betweenpairs of limb was found to depend on speed and trunk length. For trot and rotary gallop, this relationship was thought also to depend on the additional action of trunk flexion and leg angle at footfall.
Key words: gait, limb coordination, mammal, quadruped, speed, APS.
INTRODUCTION
Footfall patterns have been used for the rigorous identification of gaits since the 19th Century (Marey, 1873; Muybridge, 1899). Symmetrical and asymmetrical gaits were later distinguished (Howell, 1944; Hildebrand, 1965); in symmetrical gaits, the footfalls of the two feet of the same pair (fore or hind) are evenly spaced in time whereas in asymmetrical gaits this is not the case for at least one of the two pairs of limbs. The fundamentals of gait analysis were established over the next few decades by Hildebrand (Hildebrand, 1965; Hildebrand, 1966; Hildebrand, 1977), Dagg (Dagg, 1973), Gambaryan (Gambaryan, 1974) and Sukhanov (Sukhanov, 1974). However, the methods used were not based on the same sets of parameters for studies of interlimb coordination in symmetrical and asymmetrical gaits. The links between gaits and the pattern of interlimb coordination over the entire range of speeds used by an animal were not clarified. The first efforts to investigate these links were based on the comparison of symmetrical and asymmetrical gaits at a large range of speeds, based on kinematic parameters (Herbin et al., 2004; Herbin et al., 2006), or through a linear discriminant analysis (LDA) for the automatic identification of all gaits (Robilliard et al., 2007). However, the changes occurring in limb coordination with increasing speed remain unclear. The anteroposterior sequence (APS) approach, first described in 2003 (Abourachid, 2003) and tested experimentally several years later (Abourachid et al., 2007), aims to quantify all kinds of interlimb coordination – symmetrical or asymmetrical gaits and unsteady locomotion – to define the mechanisms common to, and the differences between, the two types of gait. According to
Abourachid and colleagues, APS analysis considers quadrupedal locomotion to be a succession of anteroposterior sequences of movement, where a sequence is the association of consecutive cycles of the forelimbs followed by consecutive cycles of the hindlimbs (Abourachid, 2003; Abourachid et al., 2007). Thus, for all gaits, limb coordination involves coordinated movements of the forelimbs, coordinated movements of the hindlimbs and a relationship between these two pairs. Only three temporal parameters are thus required to define all coordination patterns of the limbs, whatever the steadiness of locomotion (Fig.·1A, Table·1). The first aim in the present study was to investigate, within the framework of APS analysis, changes in these three parameters with increasing speed, to understand the way in which temporal limb coordinations support changes in kinematics with changing speed.
Limb movement is clearly characterised by both spatial and temporal aspects, but spatial interlimb coordination has only recently been investigated (Abourachid et al., 2007). We define spatial interlimb coordination as the way in which the four limbs are distributed in space at footfall. As the left and right limbs of a pair are linked to the same rigid structure (thoracic belt for the fore pair and pelvic belt for the hind pair), the distance travelled would be simply equal to the product of speed and time. Due to this linear relationship, we presupposed that the spatial coordination of the pairs of limbs would reflect the temporal coordination of these pairs. However, because the pairs of limbs are not linked to the same anatomical structure, but rather are connected by a more or less flexible vertebral axis, it is less probable to observe a linear The Journal of Experimental Biology 211, 138-149
Published by The Company of Biologists 2008 doi:10.1242/jeb.008243
Steady locomotion in dogs: temporal and associated spatial coordination patterns
and the effect of speed
Ludovic D. Maes*, Marc Herbin, Rémi Hackert, Vincent L. Bels and Anick Abourachid
CNRS, MNHN, Université P6, Col. De France, Muséum National dʼHistoire Naturelle, Département Ecologie et Gestion de la Biodiversité, UMR 7179, Pavillon dʼAnatomie Comparée, CP 55, 57 rue Cuvier, 75231 Paris cedex 05, France
*Author for correspondence (e-mail: [email protected])
Fig.·1. Gait diagrams and track diagrams of one anteroposterior sequence (APS) at different speeds and gaits. Each colour corresponds to one foot: f1, 1-forelimb (red); f2, 2-1-forelimb (orange); h1, 1-hindlimb (dark green); h2, 2-hindlimb (pale green). On gait diagrams, coloured lines correspond to stances and coloured crosses represent the next footfall. On track diagrams, coloured squares indicate the positions of foot contacts on the runway. (A) APS temporal and spatial parameters [adapted from Abourachid et al. (Abourachid et al., 2007)]. Time lags, reflecting temporal coordination between forelimbs (fore lag;
FL), hindlimbs (hind lag, HL) or pairs of limbs (pair lag; PL), are calculated as a percentage of f1 cycle duration. Space gaps, which express spatial
coordination between the forelimbs (fore gap; FG), hindlimbs (hind gap; HG) or pairs of limbs (pair gap; PG), are expressed as a percentage of f1 stride
length. (B) Two experimental gait (left) and track (right) diagrams for each gait. The two pairs of gait–track diagrams correspond to low (top) and high (bottom) speed for the considered gait. For each foot, the duration of the cycle decreases, whereas stride length increases with increasing speed. The changes in kinematics and limb coordination support this decrease in cycle duration and increase in stride length.
0 0.5 1.0 1.5 2.0 0 1 2 3 4 5
0 0.5 1.0 1.5 2.0 0 1 2 3 4 5
0 0.5 1.0 1.5 2.0 0 1 2 3 4 5
Space (m) Time (s)
Space Time
Gait diagram Track diagram
A
B
100%
FL PL
HL
100%
FG PG
HG
Lateral walk
Pace
Trot
Transverse gallop
Rotary gallop
f1
f2 h1
h2
f1
f2 h1
h2
u=1.0 m s–1
u=2.3 m s–1
u=2.0 m s–1
u=3.3 m s–1
u=1.4 m s–1
u=5.4 m s–1
u=4.2 m s–1
u=6.3 m s–1
u=5.7 m s–1
u=9.3 m s–1
0 0.5 1.0 1.5 2.0 0 1 2 3 4 5
relationship between temporal and spatial coordination of the pairs of limbs. Thus, the second aim of this study was to verify these assumptions by quantifying the relationship between temporal and spatial limb coordination, to gauge the benefit of integrating spatial limb coordination into studies on quadrupedal locomotion.
Many studies of limb coordination in quadrupeds have been carried out on small mammals. Studies on dogs have focused on mechanics or kinematics (Alexander, 1974; Cavagna et al., 1977; Jayes and Alexander, 1978; Lee et al., 1999; Walter and Carrier, 2007) rather than on limb coordination. Furthermore, symmetrical and asymmetrical gaits were not analysed simultaneously in the few studies dealing with limb coordination (Hildebrand, 1966; Hildebrand, 1968; Hildebrand, 1977; Bertram et al., 2000). However, it is quite easy to control dogs during overground locomotion (on a steady flat ground), which most closely resembles locomotion in the natural environment, whereas a treadmill is generally needed to induce locomotion in studies of small mammals. Moreover, large amounts of data can be obtained with a simple video recording method, and no rider is required, in contrast to studies on horses. Finally, the dog is a medium-sized mammal with generally well-defined gaits. This makes it potentially useful for the definition of general trends in the locomotor behaviour of mammals.
MATERIALS AND METHODS Animals and runway
We did not want intraspecific morphological variability to interfere with our study. Thus, five malinois (Belgian shepherd) dogs (Canis familiarisL.) of very similar size (withers height=0.61±0.02·m, body mass=28.0±2.4·kg) were filmed. The dogs studied were all French military dogs. They were healthy, used to sporting exercises and very obedient. Moreover, they had not been trained to use a particular gait. The dogs moved along a 12·m flat carpet. White lines perpendicular to the axis of the runway and at 0.10·m intervals were used for investigations of the spatial characteristics of locomotion and for correction for parallax deformation. Free space at the experimentation site made it possible for the animals to take a run-up for high-speed gaits. Animals were led on a leash sufficiently long to have no effect on locomotion. The dog handlers were asked to practice walking or running with their animals at five constant speeds (0.8·m·s–1, 1.3·m·s–1, 2.0·m·s–1, 3.2·m·s–1 and 5.3·m·s–1), designed to incite dogs to use their entire locomotion repertoire. Dog handlers adjusted their speed using a stopwatch and the white marks on the runway. These speeds corresponded to walking, trotting and galloping speeds in the dogs, with slow and fast modulation in each
gait. For rapid gallops, at speeds beyond the running speed of the handlers (speed >7·m·s–1), the dogs ran alone towards a ball placed on the ground at the opposite end of the runway. Each dog performed three trials at each speed, giving a total of 90 trials.
Recording and film analysis
A high-speed video recorder (BASLER A504K; Highland, IL, USA), placed perpendicular to the runway, 8·m from its centre, was used to film the dogs throughout their progression along the carpet. We used different recording frequencies, depending on the speed of the animals (50·Hz for slow walking, 75·Hz for fast walking, 100·Hz for trot and 200·Hz for gallops). The records were analysed using Virtual Dub (version 1.6.12; http://www.virtualdub.org/). The timing of the footfalls (when the foot makes contact with the ground) and take-off (when the last toe leaves the ground) of the limbs was noted, using frame number, and the positions of the feet on each touchdown were determined using the white lines marked on the carpet (precision 0.05·m). Timings were recorded three times for one trial at each speed to establish a maximal error of one frame. The data were visualised, using classical gait diagrams (Vincent and Goiffon, 1779; Marey, 1873) and track diagrams (Dagg, 1974; Abourachid et al., 2007), making it possible to spot APSs (see below for terminology). Gaits were manually identified, and kinematic and APS parameters were then calculated.
Gait identification
For each trial, we used APS terminology to avoid confusion between trailing and leading limbs in time and space: one side of the dog was numbered 1 and the other 2 (Jayes and Alexander, 1978; Abourachid et al., 2007). When the dog used a symmetrical gait, the assignment of the number 1 to the left or right side was of no importance, because both sides had similar locomotion characteristics and functions. For asymmetrical gaits, the 1-forelimb (f1) corresponded to the first forefoot to touch the ground during a gallop sequence. Other limbs were referred to as 2-forelimb (f2), 1-hindlimb (h1) and 2-hindlimb (h2).
Each gait was identified based on classical definitions (Hildebrand, 1966; Hildebrand, 1977; Gambaryan, 1974) within the APS framework (Abourachid, 2003; Abourachid et al., 2007), resulting in three symmetrical gaits (lateral walk, pace and trot) and two asymmetrical gaits (transverse gallop and rotary gallop) (Fig.·1B).
Kinematic parameters
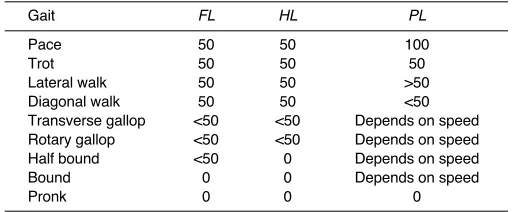
[image:3.612.43.299.90.196.2]For all trials, and for each APS, the following parameters were calculated: cycle duration (D; seconds), corresponding to the period between two consecutive footfalls for the foot concerned; stance (St; s) and swing (Sw; s) duration (the period of contact for a limb and the period of limb flight, respectively); cycle frequency (F=D–1; Hz); stride length (L; m), corresponding to the distance between two successive footprints for the same foot; and duty factor (DF=StⲐD; %), the fraction of the cycle for which the foot is in contact with the ground (Alexander et al., 1977). We also calculated the forelimb–hindlimb difference in duty factor (DFdiff= forelimb mean DF – hindlimb mean DF) (Hutchinson et al., 2006). We assessed temporal limb coordination by calculating the fore lag (FL), hind lag (HL) and pair lag (PL) (Fig.·1A): FL = time between the f1 and f2 footfalls; HL = the time between the h1 and h2 footfalls; and PL= the time between the f1 and h1 footfalls, as a percentage of f1 cycle duration (Abourachid, 2003). Similarly, we investigated spatial limb coordination by calculating fore gap (FG), hind gap (HG) and pair gap (PG) (Fig.·1A): FG = the distance Table 1. Theoretical identification of gaits based on anteroposterior
sequence (APS) time parameters (from Abourachid, 2003)
Gait FL HL PL
Pace 50 50 100
Trot 50 50 50
Lateral walk 50 50 >50
Diagonal walk 50 50 <50
Transverse gallop <50 <50 Depends on speed
Rotary gallop <50 <50 Depends on speed
Half bound <50 0 Depends on speed
Bound 0 0 Depends on speed
Pronk 0 0 0
The combination of the three temporal coordination parameters is specific to
the gait. Symmetrical gaits are characterized by FL=HL=50%; PLcan
distinguish between gaits. Asymmetrical gaits are characterized by
between the f1 and the f2 foot contact positions; HG = the distance between the h1 and h2 foot contact positions; and PG = the distance between the f1 and h1 foot contact positions in the same sequence, as a percentage of f1 stride length (Abourachid et al., 2007). When possible, we used the various parameters from previous studies to calculate the FL, HL and PL that would have been obtained if these studies had been carried out with the APS method. We also estimated these lags from gait diagrams in several reference publications, making it possible to compare our results for malinois dogs with those for other quadrupeds.
Speed (u=Lf1/Df1; m·s–1, where Df1and Lf1are the cycle duration and stride length of the f1, respectively) was used to calculate Froude number [Fr=u2(gh)–1, where g is free fall acceleration (g=9.81·m·s–2) and his the mean withers height], for possible future comparisons with other species (Alexander and Jayes, 1983).
Statistical analysis
The mean values of APS parameters were compared. As not all the data were normally distributed and homoscedasticity was not always observed, Mann–Whitney non-parametric tests were performed. Values of P<0.05 were considered statistically significant for differences between time and space, between the different coordination types (fore-, hind- or interpair coordination) or between gaits (GraphPad Prism, version 3.0; GraphPad Software, Inc., San Diego, CA, USA).
For the relationship between each APS parameter and speed, a runs test was used to determine whether the data deviated significantly from a straight line (one-tailed ANOVA). If the data did not deviate significantly from a straight line (P>0.01), an F-test was used to determine whether the slope differed significantly from zero (P<0.05). This approach was used to identify trends in the relationships between APS parameters and speed, rather than to try to account entirely for the dispersion of the data. We then used Zar’s method (Zar, 1984), which is equivalent to an ANCOVA and compares straight regression lines by testing whether their slopes and intercepts are significantly different. Values of P<0.05 indicated a significant difference in the slopes or intercepts of the regression lines (GraphPad Prism, version 3.0).
The statistical significance of differences between PL and ‘PG+TR’ (P<0.05) was assessed by an ANOVA, as the two sets of data followed a normal distribution for all gaits (Kolmogorov–Smirnov test).
RESULTS
We retained only those sequences corresponding to steady locomotion with constant speed (mean speed ±10%) and gait. We thus studied 486 sequences. We first carried out kinematic investigations over a very large range of speeds to assess the continuity of kinematic parameters between symmetrical and asymmetrical gaits. We then linked temporal and spatial coordination, using APS parameters, and assessed changes with speed.
Cycle characteristics
We obtained a large overall range of speeds (from 0.4 to 10.0·m·s–1) and specific but overlapping ranges for each gait (Fig.·2A). Trot was the only symmetrical gait with a speed range overlapping those of asymmetrical gaits.
Cycle duration and stance duration decreased whereas swing duration remained constant (P>0.05) with increasing speed (Fig.·3, Appendix·1). Plateaus were obtained for cycle duration and stance duration at ~0.4·s and 0.1·s, respectively. The contribution of swing
to cycle duration increased with speed. Within their own speed ranges, almost all gaits followed the general pattern for cycle and stance duration (Fig.·3). However, swing duration remained constant only during trot, transverse gallop and slow rotary gallop (P>0.05). In particular, once a plateau had been reached for the slow rotary gallop, the cycle and swing durations suddenly decreased, tending to increase subsequently with increasing speed (at speed exceeding 7.5·m·s–1; P>0.05).
Moreover, the DFdecreased with increasing speed (Fig.·4A). It fell below 50%, resulting in the duration of swing being higher than that of stance (Fig.·3), for speeds exceeding 2.0·m·s–1(approximately
Fr=0.7). This threshold corresponded to slow trot and pace – the beginning of running gaits and the introduction of suspension phases,
0 20 40 60 80 100
0 0.2 0.4 0.6 0.8 1.0
0 0.2 0.4 0.6 0.8 1.0
0
0.51.01.5 2.0 2.5 3.0 3.5 4.0 4.5 5.0 5.56.06.57.07.58.08.59.09.510.010.5
0
0.51.01.5 2.0 2.5 3.0 3.5 4.0 4.5 5.0 5.56.06.57.07.58.08.59.09.510.010.5
0
0.51.01.5 2.0 2.5 3.0 3.5 4.0 4.5 5.0 5.56.06.57.07.58.08.59.09.510.010.5
Speed, u (m s–1) Nsp2
/
NN
sp1
/
N
Number of sequences (
N
)
Froude number, Fr
A
B
C
0 1 2 3 6 10 16
0 1 2 3 6 10 16
0 1 2 3 6 10 16
Fig.·2. Distribution of the sequences over the whole range of speeds (A).
The number of sequences is represented for each gait: lateral walk (blue), pace (red), trot (green), transverse gallop (violet), slow (yellow) and fast (brown) rotary gallop. Frequency of appearance of the first suspension phase, sp1 (B) or the second suspension phase, sp2 (C), plotted against ranges of speed or Froude number for each gait. Frequencies are plotted as bars. Stars indicate the presence of the considered gait without a
corresponding suspension phase. N, number of sequences; Nsp1, number
of sequences with sp1; Nsp2, number of sequences with sp2. Sp1 and Sp2
during which no foot of the animal was in contact with the ground. The DFdiffas a function of speed showed an irregular distribution centred on zero (Fig.·4B). The DFof the forelimbs was higher than that of the hindlimbs in 62.5% of sequences and similar to that of the hindlimbs in only 9.0% of sequences. A higher DFof the forelimb was observed for all gaits, except the fast rotary gallop, in which hindlimb DFwas higher than forelimb DFin 78.9% of sequences. We observed a simultaneous gradual decrease in the variation of
DFdiffabout the mean value, from higher than ±0.2 to lower than ±0.05, with increasing speed (Fig.·4B).
In almost all gaits, there were no suspension phases (no foot on the ground) at low speed, whereas two possible suspension phases were observed at high speed (Fig.·2B,C). There was no suspension phase during lateral walk, by definition, but also at the lowest speeds for symmetrical ‘running gaits’ (pace and trot). In this last case, one diagonal limb couplet (f1–h2 or f2–h1) during trotting or one lateral limb couplet (f1–h1 or f2–h2) in pace touched the ground just before the take-off of the foot of the other diagonal or
lateral couplet. As speed increased, one or two suspension phases per sequence were observed for trot, pace and gallops. A first suspension phase (sp1) separated the stance of the first diagonal limb couplet (f1–h2) from the second in trot and the first lateral limb couplet (f1–h1) from the second in pace. For asymmetrical gaits, sp1 occurred after the two forelimb stances and corresponded to a flexed suspension phase (Hildebrand, 1959; Dagg and De Vos, 1968) or crossed flight (Gambaryan, 1974). The second suspension phase, sp2, separated the stance of the second diagonal limb couplet (f2–h1) from the first in trot and the second lateral limb couplet (f2–h2) from the first in pace. For asymmetrical gaits, sp2 occurred after the two hindlimb stances – sp2 therefore typically corresponded to the extended suspension phase (Hildebrand, 1959; Gambaryan, 1974). The frequency of these suspension phases increased with speed, but there was never an sp2 in the absence of an sp1 in the sequence. However, the sp2 pattern was irregular in transverse gallop, and the rotary gallop was the only gait for which no sequence was observed without at least one suspension phase, regardless of speed.
Finally, stride length increased linearly from slow to high speeds (Fig.·5). Only the fast rotary gallop distinguished itself from the general tendency, with a slope significantly higher than those of other gaits.
Interlimb coordination: mean temporal and spatial values Lags and temporal coordination
APS lags were calculated for each gait (Fig.·1A, Table·2). For symmetrical gaits, lags within the two pairs of limbs were 50±5%, with no difference between gaits (P>0.05). PL confirmed the distinction between the symmetrical gaits: lateral walk (PL=84±5%), trot (PL=50±4%) and pace (PL=96±3%). During trotting, PL is about 50%, with the footfall of a given hindlimb
0 2 4 6 8 10
0 0.2 0.4 0.6 0.8 1.0 1.2
Duration of the stance phase (St),
the swing phase (Sw) or the cycle (D) (s)
Speed, u (m s–1) Froude number, Fr
0 1 2 3 6 10 16
Fig.·3. Stance (filled diamonds), swing (open triangles) and
cycle (filled squares) durations plotted against speed (u) or
Froude number (Fr) for each gait: lateral walk (blue), pace (red),
trot (green), transverse gallop (violet), slow (yellow) and fast (brown) rotary gallop.
0 0.2 0.4 0.6 0.8 1.0
–0.3 –0.2 –0.1 0 0.1 0.2 0.3
Duty factor,
DF
Duty factor fore–hind difference,
DF
diff
A
B
0 2 4 6 8 10
Speed, u (m s–1) Froude number, Fr
0 1 2 3 6 10 16
0 2 4 6 8 10
0 1 2 3 6 10 16
Fig.·4. Duty factor (A) and fore–hind duty factor difference (B) plotted against speed or Froude number for each gait: lateral walk (blue), pace (red), trot
occurring in the middle of the cycle of the ipsilateral forelimb. This results in the synchronisation of diagonally opposite limbs. Three dogs used pace, theoretically characterised by a PL of 100±5% (Abourachid, 2003). We obtained slightly lower PLvalues (96±3%), so this gait may actually be considered to be a paced walk. However, as the corresponding PLvalue was significantly higher than that for lateral walk (84±5%) (P<0.05), we nonetheless considered this gait as pace. As the PLis around 100%, the footfall of a given hindlimb occurs at the start of the next cycle of its ipsilateral forelimb. The ipsilateral limbs are therefore synchronised.
The HLvalue confirmed the distinction between the transverse gallop (HL>0%) and the rotary gallop (HL<0%). Dogs did not use the bound, half bound or pronk. The two sets of data obtained for the rotary gallop, resulting from the two experimental conditions (dogs running beside their handlers – slow rotary gallop; dogs running alone – fast rotary gallop), differed in having slightly different FLand HL values (slow rotary gallop, FL=21±3% and
HL=–18±3%; fast rotary gallop, FL=18±1% and HL=–15±1%).
FL was systematically slightly higher than HL for absolute values (4.8±3.5%) in asymmetrical gaits (P<0.05), and PLvaried between 50 and 100%. This last temporal APS parameter was the only one with a large standard deviation.
Gaps and spatial coordination
[image:6.612.66.275.67.219.2]FG, HGand PGwere calculated to investigate spatial coordination (Fig.·1A, Table·3). In symmetrical gaits, FG=HG=50±5% (P>0.05) – the foot of a 2-limb therefore makes contact with the ground in the middle of the contralateral 1-limb stride length (Fig.·1). In
Table 2. Experimental time lags for all gaits
Gait FL HL PL
Pace (N=30) 51±3 50±3 96±3
Trot (N=180) 51±3 49±4 50±4
Lateral walk (N=189) 51±3 50±4 84±5
Transverse gallop (N=29) 29±4 20±4 63±9
Slow rotary gallop (N=39) 21±3 –18±3 76±6
Fast rotary gallop (N=19) 18±1 –15±2 68±3
Values are means ± s.d.; FL, fore lag; HL, hind lag; PL, pair lag.
Str
ide length,
L
(m)
0 1 2 3 4
0 2 4 6 8 10
0 1 2 3 6 10 16
Speed, u (m s–1) Froude number, Fr
Fig.·5. Relationship between stride length and speed or Froude number for
each gait: lateral walk (blue), pace (red), trot (green), transverse gallop (violet), slow (yellow) and fast (brown) rotary gallop.
–50 –25 0 25 50 75 100
–50 –25 0 25 50 75 100
–50 –25 0 25 50 75 100
–50 –25 0 25 50 75 100
FL
(% of cycle duration)
A
HL
(% of cycle duration)
FG
(% of stride length)
HG
(% of stride length)
C
B
D
0 2 4 6 8 10
0 1 2 3 6 10 16
0 2 4 6 8 10
0 1 2 3 6 10 16
Speed, u (m s–1) Froude number, Fr
0 2 4 6 8 10
0 1 2 3 6 10 16
0 2 4 6 8 10
0 1 2 3 6 10 16
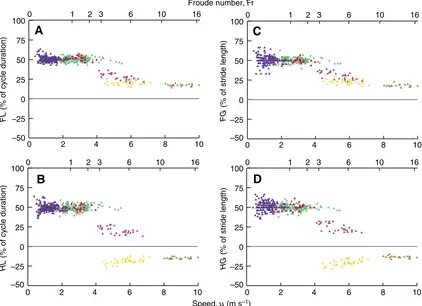
Fig.·6. Fore lag (A; FL), hind lag (B; HL), fore gap (C; FG) and hind gap (D;HG), plotted against speed or Froude number for each gait: lateral walk (blue),
[image:6.612.316.567.79.157.2] [image:6.612.90.512.409.715.2]asymmetrical gaits, FG<50±5% and HG<50±5% (P>0.05) – the feet of the two limbs of a pair therefore touch the ground close together, at a distance less than half the stride length of one of these limbs (Fig.·1). HG, like HL, also distinguished between transverse gallop (HG<50±5%) and rotary gallop (HG<0%). Moreover, absolute values of FGwere always higher than those for HGin asymmetrical gaits (5.1±3.8%, P<0.05). Thus, in both symmetrical and asymmetrical gaits, the gaps for limb pairs (FGand HG) were similar to the lags for these pairs (FLand HL) (P>0.05), except for the lateral walk, for which variability was higher in space than in time, and the transverse gallop, for which FLand HLwere slightly lower than FGand HG, respectively (P<0.05).
The pair gap differed considerably between different symmetrical or asymmetrical gaits (Table·3). These pair gap values were both highly variable and very different from the pair lag (P<0.05), in contrast to the similarity observed for FL–FGand HL–HG.
Finally, the widely accepted gait variability of 5% for time parameters (Hildebrand, 1966) was respected for most lags and gaps (Tables·2,·3). However, variability exceeded 5% for PLin transverse gallop and the slow rotary gallop and for PGin almost all gaits, with standard deviations between 6% and 15%.
Interlimb coordination: relationship to speed
Straight regression lines were used to assess trends in possible relationships between APS parameters and speed (Appendix 1). In the results presented below, a linear regression line could be fitted to the data unless otherwise stated.
Lags and gaps within pairs (FL, HL, FGand HG)
In all symmetrical gaits, FL, HL, FGand HGwere constant (Fig.·6), with values of 50±5%, whatever the speed (P>0.05, Appendix·1). By contrast, the fast rotary gallop was the only asymmetrical gait in which the values of the four parameters remained significantly constant with increasing speed (P>0.05). Moreover, all four parameters for transverse gallop and FG for slow rotary gallop decreased significantly with increasing speed (P<0.05). Only HL
and HG for slow rotary gallop increased significantly with increasing speed (P<0.05), due to the inversion of hindlimb coordination with respect to forelimb coordination. In general, data dispersion decreased with increasing speed.
PLand PG
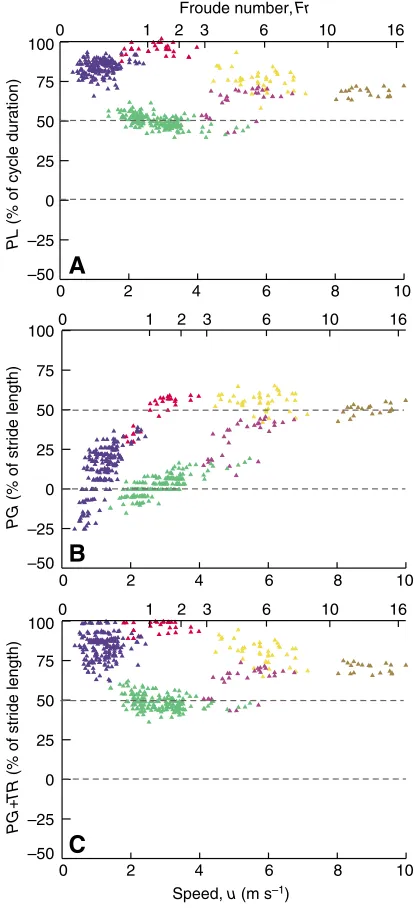
The relationship between PLand speed depended on gait (Fig.·7A).
PLincreased significantly with increasing speed for the lateral walk and transverse gallop (P<0.05), whereas it decreased significantly with speed for the trot and slow rotary gallop (P<0.05) (Appendix·1). By contrast, PLshowed no specific relationship to speed in pace and fast rotary gallop (P>0.05). However, several PL
values for the slow transverse gallop of one dog closely resemble
PLvalues of trot, making the corresponding slope higher.
PGincreased with increasing speed for all gaits (P<0.05), except the slow rotary gallop, which had a constant PG (P>0.05), (Fig.·7B). Moreover, the positive relationship between PG and speed decreased in magnitude with increasing speed, from the lateral walk to the rotary gallop (Appendix·1). However, because of the dispersion of the data, the straight regression lines calculated indicate trends only in the relationship between PG and speed, without explaining data dispersion entirely (Appendix·1).
DISCUSSION
[image:7.612.335.542.69.523.2]Variations in kinematic parameters with speed The specific speed ranges for different gaits overlapped, indicating that several gaits were possible at a given speed. Thus, the trot, which had the largest speed range, was used in some cases in which Table 3. Spatial anteroposterior sequence (APS) parameters
measured for each gait
Gait FG HG PG
Pace (N=30) 49±3 50±4 48±11
Trot (N=180) 50±3 50±3 2±6
Lateral walk (N=189) 51±5 51±5 13±15
Transverse gallop (N=29) 32±3 25±5 33±12
Slow rotary gallop (N=39) 24±3 –20±4 55±6
Fast rotary gallop (N=19) 18±2 –13±1 50±4
Values are means ± s.d.; FG, fore gap; HG, hind gap; PG, pair gap.
–50 –25 0 25 50 75 100
–50 –25 0 25 50 75 100
A
PL
(% of cycle duration)
PG
(% of stride length)
B
C
–50 –25 0 25 50 75 100
PG
+
TR
(% of stride length)
0 1 2 3 6 10 16
Speed, u (m s–1) Froude number, Fr
0 2 4 6 8 10
0 1 2 3 6 10 16
0 2 4 6 8 10
0 1 2 3 6 10 16
0 2 4 6 8 10
Fig.·7. Pair lag (A; PL), pair gap (B; PG) and pair gap added to trunk length
(C; PG+TR) plotted against speed or Froude number for each gait: lateral
[image:7.612.45.297.89.167.2]lateral walk, pace, transverse gallop and slow rotary gallop would have been possible. Despite a lack of values between 7.14 and 8.03·m·s–1, we could gauge the continuity of kinematic parameters or temporal and spatial limb coordination.
How can speed be increased?
The decrease in cycle duration reached a plateau at a speed of about 4.0·m·s–1 (about Fr=2). Beyond this threshold, increasing stride length rather than increasing cycle frequency is used to increase speed. Most quadrupeds use this strategy to increase speed (Pennycuick, 1975; Heglund and Taylor, 1988; Hutchinson et al., 2006). The threshold of 4.0·m·s–1 corresponds to the zone of overlap between symmetrical and asymmetrical gaits in our data. Thus, to increase speed, dogs increase both cycle frequency and stride length if they use symmetrical gaits, whereas they almost exclusively increase stride length if they use an asymmetrical gait. Similar observations have been reported in mice, but with a different threshold (speed of 42.5·cm–1, around Fr=1) (Herbin et al., 2004; Herbin et al., 2006). Thus, the difference in the contributions of cycle frequency and stride length to increasing speed seems to be a key difference between symmetrical and asymmetrical gaits and may be one of the main mechanisms underlying transitions from symmetrical to asymmetrical gaits.
Swing duration was found to be constant in dogs. However, swing has recently been reported to decrease in alligators (Reilly and Elias, 1998), mice (Herbin et al., 2004; Herbin et al., 2006), horses (Robilliard et al., 2007) and elephants (Hutchinson et al., 2006). Differences in data treatment may account for these differences in results. Our data were not averaged, in contrast to those of other studies. Thus, interindividual variability may be responsible for our not observing a real decrease in swing duration, because the runs test showed that our data could not be reasonably linearised.
At very high speed – for the fast rotary gallop – cycle duration fell abruptly by around 0.1·s and then increased with increasing speed. Even if only three of the five dogs ran at these speeds, each of these three dogs showed a similar pattern (P>0.05). This was due to the increase in swing duration with only a slight further decrease in stance duration (Fig.·3). To our knowledge, this pattern has never before been reported, probably due to the lack of studies with a wide range of speeds, including very fast locomotion. This increase in swing duration is due to the increase in duration of the suspension phases. Each of the two suspension phases increased in duration from 0 to around 0.05·s (L.D.M., unpublished results), leading to an increase in swing duration of about 0.1·s. However, morphological characteristics may be responsible for the first decrease in swing duration; we observed sagittal flexing of the spinal column, resembling the movement of a sprung leaf, particularly in the lumbar region. This behaviour was observed beyond 8.0·m·s–1and enabled the animal to cover longer distances during suspension phases, thus having a longer stride length, with a shorter swing duration than during the slow rotary gallop. This mechanism makes it possible to increase both swing duration and stride length, allowing the animal to reach very high speeds. At these speeds, the dogs ran without handlers and aimed to retrieve the ball, which was placed at the opposite end of the runway, as rapidly as possible. They therefore optimised their locomotion, as predators do when chasing their prey. This interpretation is based on behavioural observations and was not measured. However, it has already been shown in other mammals that sagittal flexion of the spinal axis is largely responsible for an increase in the distance travelled by the
hindlimbs (Hildebrand, 1959; Grillner, 1975; Rocha Barbosa et al., 1996; Schilling and Hackert, 2006).
Relationship between suspension phases and speed The increasing frequency of suspension phases (Fig.·2) contributed to the increase in speed. The presence of suspension phases classically distinguishes running gaits from walking gaits (Hildebrand, 1966). However, at the lowest speeds, suspension phases were not observed in symmetrical ‘running gaits’ (pace and trot). We interpret this as indicating that dogs adapted their limb coordination, using pace or trot, in case they needed to go faster, but no suspension phase was required because the speed was too low. A similar pattern has been observed in horses trotting at low speeds (Hoyt et al., 2006). A single suspension phase was sufficient at slightly higher speeds and a second suspension phase occurred at the highest speeds, to increase the distance covered during the flight phase. Horses generally use a maximum of one suspension phase, in the flexed position (Hildebrand, 1959), although a second suspension phase has been reported in rare cases (Howell, 1944). Hildebrand suggested that there might be even a third suspension phase between the stance phases of the two forelimbs, during rotary gallop in the cheetah (Hildebrand, 1959). The number of suspension phases in the sequence therefore seems to increase with flexibility of the back, from elephant (Hutchinson et al., 2006) to cheetah. The rotary gallop is the only gait that required at least one suspension phase, probably to make the forelimbs withdraw from the trajectory of the hindlimbs, thereby avoiding interference between the forelimb and its ipsilateral hindlimb.
Duty factor and fore-hind kinematic homogeneity
In malinois dogs, the mean fore–hind difference in duty factor was mainly positive (in more than 60% of the sequences) (Fig.·4B). This result is consistent with data from studies on other mammals (Biewener, 1983; Hutchinson et al., 2006) and reptiles (Renous et al., 2002). Moreover, 60% of the body weight is supported by the forelimbs in most quadrupedal mammals (Björk, 1958; Jayes and Alexander, 1978; Rollinson and Martin, 1981), especially dogs (Lee et al., 1999), probably accounting for the higher duty factor or stance duration of the forelimbs than of the hindlimbs. However, at very high speeds, the duty factor of the hindlimbs exceeded that of the forelimbs in these malinois dogs. As dogs power locomotion by torque about the hips (Lee et al., 1999; Usherwood and Wilson, 2005), the duty factor of the hindlimbs probably takes over that of the forelimbs to optimise the exchanges of forces between the ground and the hindlimbs. This is consistent with the notion that very high speed makes the difference between the weight-supporting role of the forelimbs and the propellant role of hindlimbs more marked (Usherwood and Wilson, 2005).
The variability of DFdiff decreased with increasing speed, possibly due to increasingly precise stance and swing durations, due to an increasing role of cognition in locomotion at increasing speed. As stability increases strongly at high speeds if the swing duration becomes more precise (Seyfarth et al., 2003), a decrease in DFdiff should reflect an increase in dynamic stability.
Relationship between temporal and spatial coordination and the effect of speed
Coordination within pairs
was frequently found to result from treadmill locomotion, especially in small mammals. Limb coordination may be influenced by a permanent adjustment of the speed of the animal to treadmill speed, as shown for various kinematic parameters in many studies (Wetzel et al., 1975; Eliot and Blanksby, 1976; Alton et al., 1993; Barrey et al., 1993; Wank et al., 1998; Dunbar, 2004; Herbin et al., 2007).
FGand HGvalues reflected those for FLand HL(Table·3, Fig.·1). These findings are consistent with the results obtained with track diagrams of pacing camels [FG=51% and HG=48%, calculated from Dagg (Dagg, 1974)]. Thus, in symmetrical gaits, the footfalls of the limbs of a given pair are evenly spaced not only in time but also in space. In asymmetrical gaits, there is a similar tendency to synchronise the two limbs of a pair not only in time but also in space. This result confirmed our assumption: the spatial coordination of the pairs of limbs reflects the temporal coordination of these pairs.
For asymmetrical gaits, HLand HGwere lower than FLand FG, respectively, indicating that hindlimbs have a more marked tendency to become synchronised than forelimbs. This may facilitate the propulsion exerted by hindlimbs, if we consider the animal as a combination of a pendulum for the forelimbs and a spring for the hindlimbs (Cavagna et al., 1977). Certain lags and gaps maintained by the forelimbs during their stance may make the ‘pole-vaulter movement’ (Cavagna et al., 1977) more efficient, making it possible to lift the centre of mass without slowing down the forward progress of the whole body. This is particularly evident at very high speeds, such as those reached by running cheetahs, with HL=–9.5% and
FL=15% (Table·4). The highest relative running speeds are reached by animals of the Rodentia, Marsupialia and Lagomorpha (Iriarte-Diaz, 2002), which move mostly by bounding or half-bounding. Thus, hindlimb synchronisation, which is almost achieved by running cheetahs, seems to be one of the most useful strategies for reaching maximum speed, taking bone, muscle and tendon strains into account (Biewener and Taylor, 1986; Iriarte-Diaz, 2002).
Coordination between pairs of limbs
PLvalues were previously thought to depend on speed, and no detail was provided about the range of values (Table·1). In this study, although speed clearly had some effect, because variability did exceed the widely accepted level of 5% in some cases, PLwas found to be specific for each gait and could be used to distinguish between symmetrical gaits, whereas no such distinction was possible with FL
and HLalone. This proved to be the case in several other mammals (Table·4). Thus, PLvalues are more dependent on gait than on speed. In terms of spatial coordination between pairs of limbs, when
PGis 50%, the hindlimb foot contacts the ground midway between two successive footprints of the ipsilateral forelimb (Fig.·1). However, this situation is unlikely to occur without at least one flexed suspension phase. It is therefore necessary to move with a running gait and at high speed (fast pace and rotary gallop). This is particularly true for PGvalues exceeding 50%. PGis mostly lower than 50%, indicating that the hindlimb contacts the ground before the midpoint in the stride length of the ipsilateral forelimb (e.g. high speed in lateral walk and trot and low speed in pace or transverse gallop). Similar findings have been obtained for camel pacing [PG=36%, from track diagram in Dagg (Dagg, 1974)]. When the animal trots or walks at very low speed (u<1.3·m·s–1for walk and u<3·m·s–1for trot), PG reaches 0%. This indicates that the hindfoot contacts the ground at the same place as the ipsilateral forefoot. Generally, the hindfoot contacts the ground slightly ahead of the ipsilateral forefoot in the same sequence. This makes the back of the animal deviate from the line of travel, most often during several consecutive sequences, to avoid interference between the hindlimb and its ipsilateral forelimb (Hildebrand, 1968), especially at high speeds.
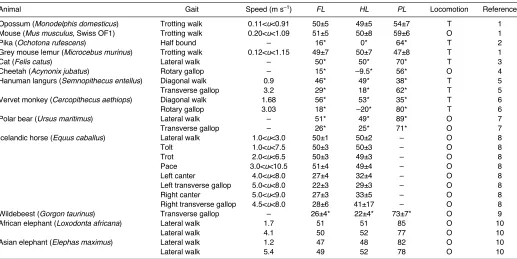
[image:9.612.47.564.78.337.2]Moreover, unlike coordination within pairs of limbs, PGand PLare very different for each gait (Tables·2 and 3). Indeed, the pairs of limbs are not in the same position on the anteroposterior axis, translating the Table 4. Temporal coordination parameters calculated from studies on other animal groups
Animal Gait Speed (m·s–1) FL HL PL Locomotion Reference
Opossum (Monodelphis domesticus) Trotting walk 0.11<u<0.91 50±5 49±5 54±7 T 1
Mouse (Mus musculus, Swiss OF1) Trotting walk 0.20<u<1.09 51±5 50±8 59±6 O 1
Pika (Ochotona rufescens) Half bound – 16* 0* 64* T 2
Grey mouse lemur (Microcebus murinus) Trotting walk 0.12<u<1.15 49±7 50±7 47±8 T 1
Cat (Felis catus) Lateral walk – 50* 50* 70* T 3
Cheetah (Acynonix jubatus) Rotary gallop – 15* –9.5* 56* O 4
Hanuman langurs (Semnopithecus entellus) Diagonal walk 0.9 46* 49* 38* T 5
Transverse gallop 3.2 29* 18* 62* T 5
Vervet monkey (Cercopithecus aethiops) Diagonal walk 1.68 56* 53* 35* T 6
Rotary gallop 3.03 18* –20* 80* T 6
Polar bear (Ursus maritimus) Lateral walk – 51* 49* 89* O 7
Transverse gallop – 26* 25* 71* O 7
Icelandic horse (Equus caballus) Lateral walk 1.0<u<3.0 50±1 50±2 – O 8
Tolt 1.0<u<7.5 50±3 50±3 – O 8
Trot 2.0<u<6.5 50±3 49±3 – O 8
Pace 3.0<u<10.5 51±4 49±4 – O 8
Left canter 4.0<u<8.0 27±4 32±4 – O 8
Left transverse gallop 5.0<u<8.0 22±3 29±3 – O 8
Right canter 5.0<u<9.0 27±3 33±5 – O 8
Right transverse gallop 4.5<u<8.0 28±6 41±17 – O 8
Wildebeest (Gorgon taurinus) Transverse gallop – 26±4* 22±4* 73±7* O 9
African elephant (Loxodonta africana) Lateral walk 1.7 51 51 85 O 10
Lateral walk 4.1 50 52 77 O 10
Asian elephant (Elephas maximus) Lateral walk 1.2 47 48 82 O 10
Lateral walk 5.4 49 52 78 O 10
The locomotion heading corresponds to the experimental conditions: treadmill (T) or overground (O) locomotion. * estimated from gait diagrams. 1(M.H.,
unpublished); 2(Hackert et al., 2006); 3(Wetzel et al., 1975); 4(Hildebrand, 1959); 5(Dunbar et al., 2004); 6(Dunbar, 2004); 7(Renous et al., 1998); 8(Robilliard et
spatial movement of the hind pair back a trunk length of the animal with respect to the spatial movement of the fore pair. By trunk length, we mean the distance between the shoulder and the hip – this was measured in a static posture, using marks made on the skin of the dogs from the caudal angle of the scapula to the hip (estimated by palpation). Thus, the distance travelled by the centre of mass of the animal, during a period equal to the pair lag in a real time unit (pl; s), is equal to the sum of the pair gap in real space unit (pg; m) plus the trunk length (tr; m). Hence, speed can be expressed as follows:
u= (pg+ tr) / pl·. (1)
These parameters are normalised by expressing pg and tr as a percentage of stride length (PGand TR; %), and plas a percentage of cycle duration (PL; %). Thus, after reduction, Eqn·1 can be written as:
PL= PG+ TR·. (2)
PLand ‘PG+TR’presented similar patterns when plotted against speed (Fig.·7A,C). As speed increases (and thus stride length
increases), TRdecreases, resulting in a smaller difference between
PL and PG, with PG values following curvilinear distribution (Fig.·7B). However, PG+TRdiffered significantly from PLfor trot and rotary gallop (slow and fast modulation) (P<0.05). In trot, the hindlimb has to move around its ipsilateral forelimb to avoid interference, and this hindlimb cannot touch the ground as far as theoretically predicted (Fig.·8B). This may also involve a reduction of the hindlimb angle at footfall. For rotary gallop, sagittal flexion of the vertebral axis, particularly in the pelvic region (Alexander et al., 1985; Schilling and Hackert, 2006), allows the hindlimbs to travel over a greater distance during swing phase (Hildebrand, 1959; Grillner, 1975; Rocha Barbosa et al., 1996; Schilling and Hackert, 2006), touching the ground further forward than theoretically predicted (Fig.·8C). Finally, Eqn·2 not being observed may be used to quantify the involvement of trunk flexibility (laterally for trot and sagittally for rotary gallop) in locomotion.
Conclusions
If we observed a great continuity in kinematic parameters from slow walking to fast running in malinois dogs, the respective contributions of cycle frequency and stride length to the increase in speed nevertheless showed a strong difference between symmetrical and asymmetrical gaits. Setting up suspension phases then sagittal flexing of the trunk, which induced an increase of the swing duration at very high speed, also supported the increase in speed. This came with changes in spatiotemporal limb coordination. As initially supposed, spatial coordination within pairs of limbs reflected the temporal coordination within pairs of limbs, while temporal and spatial coordination between the pairs of limbs was strongly linked through trunk length. Variations in this last relationship seemed to reflect the involvement of trunk movement in locomotion, which would require a rigorous three-dimensional kinematic analysis to be clearly characterised. These parallels between temporal and spatial coordination with increasing speed should increase our understanding of particular cases of limb coordination and probably facilitate the interpretation of fossilised tracks left by ancient quadrupeds.
PG TR
A
B
C
(u=0 m s–1)
PL=0 %
PL<PG+TR
Static posture Trot Rotary gallop
PL>PG+TR PG=–TR
Fig.·8. Particular cases in the relationship between temporal and spatial
interpair coordination. In the static posture, the delay in pair gap (PG) is
easy to explain as a function of pair lag (PL). TR, trunk length; u, speed.
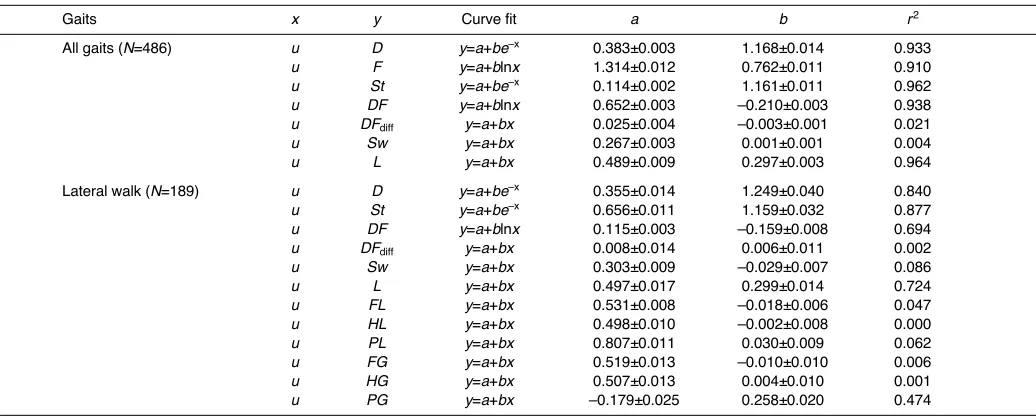
Appendix 1. Regression equations for the curves for stride parameters
Gaits x y Curve fit a b r2
All gaits (N=486) u D y=a+be–x 0.383±0.003 1.168±0.014 0.933
u F y=a+blnx 1.314±0.012 0.762±0.011 0.910 u St y=a+be–x 0.114±0.002 1.161±0.011 0.962 u DF y=a+blnx 0.652±0.003 –0.210±0.003 0.938
u DFdiff y=a+bx 0.025±0.004 –0.003±0.001 0.021
u Sw y=a+bx 0.267±0.003 0.001±0.001 0.004
u L y=a+bx 0.489±0.009 0.297±0.003 0.964
Lateral walk (N=189) u D y=a+be–x 0.355±0.014 1.249±0.040 0.840
u St y=a+be–x 0.656±0.011 1.159±0.032 0.877 u DF y=a+blnx 0.115±0.003 –0.159±0.008 0.694
u DFdiff y=a+bx 0.008±0.014 0.006±0.011 0.002
u Sw y=a+bx 0.303±0.009 –0.029±0.007 0.086
u L y=a+bx 0.497±0.017 0.299±0.014 0.724
u FL y=a+bx 0.531±0.008 –0.018±0.006 0.047 u HL y=a+bx 0.498±0.010 –0.002±0.008 0.000
u PL y=a+bx 0.807±0.011 0.030±0.009 0.062
u FG y=a+bx 0.519±0.013 –0.010±0.010 0.006
u HG y=a+bx 0.507±0.013 0.004±0.010 0.001
[image:10.612.52.294.66.221.2]u PG y=a+bx –0.179±0.025 0.258±0.020 0.474
[image:10.612.48.566.529.737.2]Appendix 1. Continued
Gaits x y Curve fit a b r2
Pace (N=30) u D y=a+be–x 0.426±0.004 0.472±0.049 0.768
u St y=a+be–x 0.127±0.005 0.911±0.053 0.913 u DF y=a+blnx 0.711±0.022 –0.293±0.022 0.869
u DFdiff y=a+bx –0.021±0.022 0.017±0.008 0.144
u Sw y=a+bx 0.183±0.013 0.030±0.005 0.607
u L y=a+bx 0.252±0.028 0.365±0.010 0.979
u FL y=a+bx 0.523±0.022 –0.004±0.008 0.008
u HL y=a+bx 0.473±0.028 0.009±0.010 0.028
u PL y=a+bx 0.948±0.029 0.003±0.010 0.003
u FG y=a+bx 0.492±0.023 0.001±0.008 0.000
u HG y=a+bx 0.466±0.033 0.014±0.017 0.047
u PG y=a+bx 0.051±0.045 0.157±0.016 0.779
Trot (N=180) u D y=a+be–x 0.401±0.004 0.983±0.048 0.699
u St y=a+be–x 0.135±0.003 0.954±0.029 0.863 u DF y=a+blnx 0.635±0.010 –0.203±0.010 0.707
u DFdiff y=a+bx 0.028±0.012 –0.002±0.004 0.001
u Sw y=a+bx 0.274±0.008 –0.002±0.003 0.004
u L y=a+bx 0.498±0.023 0.286±0.008 0.878
u FL y=a+bx 0.512±0.009 –0.003±0.003 0.004
u HL y=a+bx 0.481±0.011 0.005±0.004 0.009
u PL y=a+bx 0.597±0.010 –0.034±0.004 0.345 u FG y=a+bx 0.514±0.009 –0.004±0.003 0.010 u HG y=a+bx 0.530±0.011 –0.010±0.004 0.038 u PG y=a+bx –0.174±0.012 0.071±0.004 0.603
Transverse gallop (N=29) u D y=a+be–x 0.362±0.012 4.292±1.522 0.228
u St y=a+be–x 0.096±0.003 4.001±0.432 0.761 u DF y=a+blnx 0.668±0.060 –0.215±0.036 0.573
u DFdiff y=a+bx 0.011±0.036 –0.002±0.007 0.003
u Sw y=a+bx 0.279±0.043 –0.002±0.008 0.002
u L y=a+bx 0.695±0.244 0.256±0.046 0.535
u FL y=a+bx 0.508±0.039 –0.042±0.007 0.549 u HL y=a+bx 0.392±0.050 –0.035±0.009 0.343
u PL y=a+bx 0.314±0.104 0.059±0.020 0.255
u FG y=a+bx 0.550±0.047 –0.044±0.009 0.482 u HG y=a+bx 0.499±0.055 –0.048±0.010 0.448 u PG y=a+bx –0.244±0.119 0.108±0.022 0.466
Slow rotary gallop (N=39) u D y=a+be–x 0.402±0.006 2.662±1.327 0.098
u St y=a+be–x 0.104±0.003 2.559±0.586 0.340 u DF y=a+blnx 0.453±0.054 –0.102±0.031 0.227
u DFdiff y=a+bx –0.005±0.023 0.002±0.004 0.005
u Sw y=a+bx 0.304±0.029 –0.001±0.005 0.001
u L y=a+bx 0.380±0.173 0.346±0.030 0.787
u FL y=a+bx 0.200±0.044 0.002±0.008 0.003
u HL y=a+bx –0.339±0.039 0.027±0.007 0.306 u PL y=a+bx 0.962±0.084 –0.034±0.001 0.132 u FG y=a+bx 0.327±0.044 –0.016±0.008 0.105 u HG y=a+bx –0.386±0.039 0.031±0.007 0.368 u PG y=a+bx 0.619±0.078 –0.011±0.013 0.019
Fast rotary gallop (N=19) u D y=a+be–x 0.366±0.008 –211.285±47.240 0.541
u St y=a+be–x 0.068±0.003 45.877±15.496 0.340 u DF y=a+blnx 1.008±0.148 –0.357±0.068 0.621
u DFdiff y=a+bx –0.123±0.061 0.012±0.007 0.144
u Sw y=a+bx –0.061±0.058 0.036±0.006 0.644
u L y=a+bx –2.363±0.535 0.599±0.060 0.855
u FL y=a+bx 0.190±0.053 –0.002±0.006 0.004 u HL y=a+bx –0.157±0.041 0.001±0.005 0.004
u PL y=a+bx 0.607±0.109 0.009±0.012 0.028
u FG y=a+bx 0.217±0.061 –0.004±0.007 0.019 u HG y=a+bx –0.062±0.052 –0.008±0.006 0.093
u PG y=a+bx 0.221±0.113 0.032±0.013 0.027
The ʻall gaitsʼ heading shows the best-fit curves for the pooled data.
Exponential and logarithmic equations for individual gaits do not necessarily correspond to best-fit curves but show how each gait is included in the ʻall gaitsʼ tendency.
LIST OF SYMBOLS AND ABBREVIATIONS
APS anteroposterior sequence
D cycle duration (s)
DF duty factor
DFdiff duty factor fore–hind difference
F cycle frequency (Hz) f1 forelimb of side 1 f2 forelimb of side 2
FG fore gap (%)
FL fore lag (%)
Fr Froude number
g acceleration in free fall (m·s–2)
h withers height (m) h1 hindlimb of side 1 h2 hindlimb of side 2
HG hind gap (%)
HL hind lag (%)
L stride length (m)
N number of samples
pg pair gap (m)
PG pair gap (%)
pl pair lag (s)
PL pair lag (%)
r2 determination coefficient s.d. standard deviation sp1 suspension phase 1 sp2 suspension phase 2
St stance duration (s)
Sw swing duration (s)
tr trunk length (m)
TR trunk length (%)
u speed (m·s–1)
We thank the members of the 132th BCAT of the French army, Lt.-Cl. Deuwel, Cdt. Lamour, Ch. Foehrle, Cpl.-Ch. Séné and Monnier, 1stCl. Risser and Sdt. Baron. We would also like to thank Paul-Antoine Libourel for films and software optimisation and Sabine Renous for her comments. We are also grateful to the two reviewers for their very shrewd comments. This work was supported by the French Department of Education and Research, by funds from CNRS-MNHN and the project ANR-Kameleon (ANR-05-MMSA-0002).
REFERENCES
Abourachid, A.(2003). A new way of analysing symmetrical and asymmetrical gaits in quadrupeds. C. R. Biol. 326, 625-630.
Abourachid, A., Herbin, M., Hackert, R., Maes, L. and Martin, V.(2007). Experimental study of coordination patterns during unsteady locomotion in mammals. J. Exp. Biol. 210, 370-372.
Alexander, R. McN.(1974). The mechanics of jumping by a dog (Canis familiaris).J. Zool. Lond. 173, 549-573.
Alexander, R. McN. and Jayes, A. S.(1983). A dynamic similarity hypothesis for the gaits of quadrupedal mammals. J. Zool. 201, 135-152.
Alexander, R. McN., Langman, V. A. and Jayes, A. S.(1977). Mechanics and scaling of terrestrial locomotion. In Scale Effects in Animal Locomotion(ed. T. J. Pedley), pp. 93-110. London: Academic Press.
Alexander, R. McN., Dimery, N. J. and Ker, R. F.(1985). Elastic structures in the back and their role in galloping in some mammals. J. Zool. Lond. A207, 467-482. Alton, F., Badley, L., Caplan, S. and Morrissey, M. C.(1993). A kinematic
comparison of overground and treadmill walking. Clin. Biomech.13, 434-440. Barrey, E., Galloux, P., Valette, J.-P., Auvinet, B. and Wolter, R.(1993). Stride
characteristics of overground versus treadmill locomotion in the saddle horse. Acta Anat. 146, 90-94.
Bertram, J. E. A., Lee, D. V., Case, H. N. and Todhunter, R. J.(2000). Comparison of the trotting gaits of Labrador Retrievers and Greyhounds. Am. J. Vet. Res. 61, 832-838.
Biewener, A. A.(1983). Allometry of quadrupedal locomotion: the scaling of duty factor, bone curvature and limb orientation to body size. J. Exp. Biol. 105, 147-171.
Biewener, A. A. and Taylor, C. R.(1986). Bone strain: a determinant of gait and speed? J. Exp. Biol. 123, 383-400.
Björk, G.(1958). Studies on the draught force of horses: development of a method using strain gauges for measuring between hoof and ground. Acta Agric. Scand. Suppl.4, 1-109.
Cavagna, G. A., Heglund, N. C. and Taylor, C. R.(1977). Mechanical work in terrestrial locomotion: two basic mechanisms for minimizing energy expenditure. Am. J. Physiol. 233, 243-261.
Dagg, A. I.(1969). The gallop of the wildebeest. J. Mamm. 50, 825-826. Dagg, A. I.(1973). Gaits in mammals. Mammal Rev. 3, 135-154.
Dagg, A. I.(1974). The locomotion of the camel (Camelus dromedarius). J. Zool. Lond. 174, 67-78.
Dagg, A. I. and De Vos, A.(1968). Fast gaits of pecoran species. J. Zool. 155, 499-506.
Dunbar, D. C.(2004). Stabilization and mobility of the head and trunk in vervet monkeys (Cercopithecus aethiops) during treadmill walks and gallops. J. Exp. Biol. 207, 4427-4438.
Dunbar, D. C., Badam, G. L., Hallgrimson, B. and Vieilledent, S.(2004). Stabilization and mobility of the head and trunk in wild monkeys during terrestrial and flat-surface walks and gallops. J. Exp. Biol. 207, 1027-1042.
Eliot, B. C. and Blanksby, B. A.(1976). A cinematographical analysis of overground and treadmill running by males and females. Med. Sci. Sports Exerc. 8, 84-87.
Gambaryan, P. P.(1974). How Mammals Run. New York: John Wiley & Sons. Grillner, S.(1975). Locomotion in vertebrates: central mechanisms and reflex
interaction. Physiol. Rev. 55, 247-304.
Hackert, R., Witte, H. and Fischer, M. S.(2006). Interaction between motions of the trunk and the limbs and the angle of attack during synchronous gaits of the pika (Ochotona rufescens). In Adaptive Motion in Animals and Machines(ed. H. Kimura, K. Tsishiya, A. Ishiguro and H. Witte), pp. 69-77. Tokyo: Springer.
Heglund, N. C. and Taylor, C. R.(1988). Speed, stride frequency and energy cost per stride: how do they change with body size and gait? J. Exp. Biol. 138, 301-318. Herbin, M., Gasc, J.-P. and Renous, S.(2004). Symmetrical and asymmetrical gaits
in the mouse: patterns to increase velocity. J. Comp. Physiol. A 190, 895-906. Herbin, M., Gasc, J.-P. and Renous, S.(2006). How does a mouse increase
velocity? A model for investigation in the control of locomotion. C. R. Palevol 5, 531-540.
Herbin, M., Hackert, R., Gasc, J.-P. and Renous, S.(2007). Gait parameters of treadmill versus overground locomotion in mouse. Behav. Brain Res. 181, 173-179. Hildebrand, M.(1959). Motion of the cheetah and horse. J. Mammal. 40, 481-495. Hildebrand, M.(1965). Symmetrical gaits of horses. Science 150, 701-708. Hildebrand, M.(1966). Analysis of symmetrical gaits of tetrapods. Folia Biotheor.6,
9-22.
Hildebrand, M.(1968). Symmetrical gaits of dogs in relation to body build. J. Morphol. 124, 353-360.
Hildebrand, M.(1977). Analysis of asymmetrical gaits. J. Mammal. 58, 131-156. Howell, A. B.(1944). Speed in Animals. Chicago: University of Chicago Press. Hoyt, D. F., Wickler, S. J., Dutto, D. J., Catterfeld, G. E. and Johnsen, D.(2006).
What are the relations between mechanics, gait parameters, and energetics in terrestrial locomotion? J. Exp. Zool. A 305, 912-922.
Hutchinson, J. R., Schwerda, D., Famini, D. J., Dale, R. H. I., Fischer, M. S. and Kram, R.(2006). The locomotor kinematics of Asian and African elephants: changes with speed and size. J. Exp. Biol. 209, 3812-3827.
Iriarte-Diaz, J.(2002). Differential scaling of locomotor performance in small and large terrestrial mammals. J. Exp. Biol. 205, 2897-2908.
Jayes, A. S. and Alexander, R. McN.(1978). Mechanics of locomotion of dogs (Canis familiaris) and sheep (Ovis aries). J. Zool. Lond. 185, 289-308.
Lee, D. V., Bertram, J. E. A. and Todhunter, R. J.(1999). Acceleration and balance in trotting dogs. J. Exp. Biol. 202, 3565-3573.
Marey, E. J.(1873).La machine animale. Paris: Bibliothèque scientifique internationale.
Muybridge, E.(1899). Animals in Motion. London: Chapman & Hall.
Pennycuick, C. J.(1975). On the running of the gnu (Connochaetes taurinus) and other animals. J. Exp. Biol. 63, 775-799.
Reilly, S. M. and Elias, J. A.(1998). Locomotion in Alligator mississippiensis: kinematic effects of speed and posture and their relevance to sprawling-to-erect paradigm. J. Exp. Biol. 201, 2559-2574.
Renous, S., Gasc, J.-P. and Abourachid, A.(1998). Kinematic analysis of the locomotion of the polar bear (Ursus maritimus, Phipps, 1774) in natural and experimental conditions. Neth. J. Zool. 48, 145-167.
Renous, S., Gasc, J.-P., Bels, V. L. and Wickler, R.(2002). Asymmetrical gaits of juvenile Crocodylus johnstoni, galloping Australian crocodiles. J. Zool. Lond. 256, 311-325.
Robilliard, J. J., Pfau, T. and Wilson, A. M.(2007). Gait characterisation and classification in horses. J. Exp. Biol. 210, 187-197.
Rocha Barbosa, O., Renous, S. and Gasc, J.-P.(1996). Comparison of the fore and the hind limbs kinematics in the symmetrical and asymmetrical gaits of a caviomorph rodent, the guinea pig, Cavia porcellus(Linné, 1758) (Rodentia, Caviidae). Ann. Sci. Nat. Zool. Paris17, 149-165.
Rollinson, J. and Martin, R. D.(1981). Comparative aspects of primate locomotion, with special reference to arboreal cercopithecines. Symp. Zool. Soc. Lond. 48, 377-427. Schilling, N. and Hackert, R.(2006). Sagittal spine movements of small therian
mammals during asymmetrical gaits. J. Exp. Biol. 209, 3925-3939.
Seyfarth, A., Geyer, H. and Herr, H.(2003). Swing-leg retraction: a simple control model for stable running. J. Exp. Biol. 206, 2547-2555.
Sukhanov, V. B.(1974). General System of Symmetrical Locomotion of Terrestrial Vertebrates and Some Features of Movement of Lower Tetrapods(translated by M. M. Hague). New Delhi: Amerind Publishing Co.
Usherwood, J. R. and Wilson, A. M.(2005). No force limit on greyhound sprint speed. Nature438, 753-754.
Vincent, A. F. and Goiffon G. C.(1779). Mémoire artificielle des principes relatifs à la fidèle représentation des animaux, tant en peinture qu’en sculpture. Ecole Nationale Vétérinaire Alfort: Alfort, France.
Walter, R. M. and Carrier, D. R.(2007). Ground forces applied by galloping dogs. J. Exp. Biol. 210, 208-216.
Wank, V., Frick, U. and Schmidtbleicher, D.(1998). Kinematics and
electromyography of lower limb muscles in overground and treadmill running. Int. J. Sports Med. 19, 455-461.
Wetzel, M. C., Atwater, A. E., Wait, J. V. and Stuart, D. G.(1975). Neural
implications of different profiles between treadmill and overground locomotion timings in cats. J. Neurophysiol. 38, 492-501.